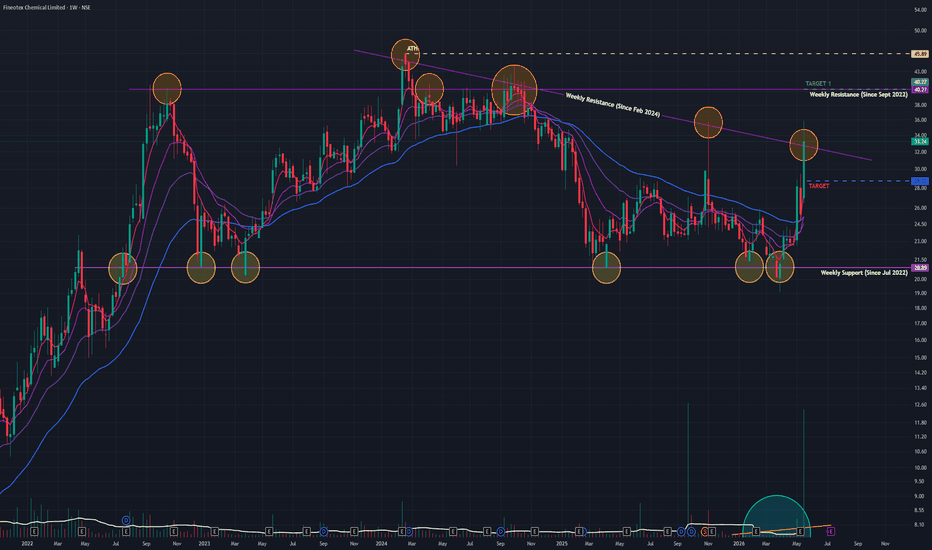
Fineotex Chemical (W): Extreme Bullish Timeframe: Weekly | Scale: Logarithmic
Overall View: 🐂 Extreme Bullish (Earnings-Led Structural Breakout)
Fineotex Chemical has shattered a multi-year consolidation range with historic volume, driven by blowout quarterly earnings and strong institutional buying. The stock has entered a highly aggressive markup phase.
🚀 1. The Fundamental Catalysts (The "Why")
The technical breakout is fully backed by tremendous fundamental strength:
> Earnings Blowout: Q4 FY26 Net Profit surged 117.6% YoY and 45.4% QoQ, proving that the company's operational leverage and margin expansion strategies are working perfectly.
> Capital Deployment: Management confirmed the full utilization of their ₹150.85 Crore preferential issue (primarily allocated to business expansion), giving investors clear visibility into future capacity growth.
> Institutional Backing: The massive 500+ million volume week suggests that major funds and high-net-worth investors (like Ashish Kacholia, who backs the stock) are aggressively increasing their stakes.
📈 2. The Chart Structure (The Range Breakout)
> The Consolidation: The stock spent nearly two years (since July 2022) trapped in a wide, choppy range, digesting previous gains and building a massive base.
> The Breakout: Clearing the dynamic angular resistance from Feb 2024 is the definitive signal that the base-building is complete.
> Weekly Candle: The stock hit a new 52-week high of ₹35.80 intraday on Wednesday before cooling off slightly to close at ₹33.44. The resulting long green weekly candle is a hallmark of dominant buying pressure.
📊 3. Volume & Indicators
> Climax Volume: Trading 500 million shares in a week for a small-cap company is an absolute anomaly. It represents a complete change of hands from weak retail holders to strong institutional hands.
> Momentum Harmonization:
- EMAs: The short-term EMAs are in a Positive Crossover (PCO) state on both Daily and Weekly timeframes, with the Monthly catching up. This confirms trend alignment.
- RSI: The Weekly RSI is surging vertically, reflecting extreme bullish momentum.
🎯 4. Future Scenarios & Key Levels
The stock is moving into "Price Discovery" mode, making Fibonacci-based and psychological targets highly relevant.
🐂 Bullish Targets (The Extension):
Target 1: ₹40.27.
Target 2: ₹77.00.
🛡️ Support (The "Must Hold"):
Immediate Support / Invalidation: ₹28.00. It served as heavy resistance during the base-building phase. The Polarity Principle dictates that this former ceiling must now act as a rock-solid floor. A weekly close below ₹28 would invalidate the breakout and trap late buyers.
Conclusion
This is a Grade-A Breakout Setup.
> Refinement: The momentum is incredibly strong, but because the stock has rallied over 30% in just five days, it may experience minor intraday volatility or a brief sideways pause to digest the gains.
Rectangle
JLHL - A detailed Price action observationNSE:JLHL
Jupiter Life Line Hospitals Ltd - A detail price action observation
⚠️ DISCLAIMER :
I am NOT a SEBI-registered investment advisor. This is a personal technical observation for educational purposes only. It is NOT a recommendation to buy, sell, or hold any security. Trading involves substantial risk of loss. Consult a SEBI-registered advisor before making investment decisions.
From 52 W high, price was arrived at area of origin from where past move get originated
First sign was high volume (Point A)
Selling Pressure was felt vanished may be due to passive buying
Price Run 10% in few session due to lack of liquidly - 3rd Sign (B to C)
Price moved down with drying volume & returned to B point but not broke (D)
From D another fast move towards C and made Sweep - Validating Big Player positioning (E)
Price intermediately come down with low to high volume in between E to D range
Again Price shown a shake out type move to grab liquidity (D1)
Till then price slowly shifting up with low volume
Within consolidation, RSI expressing strength
Conclusion
Drawn gray area is possibly an area of absorption since Point B with active as well as passive buy orders possibly triggered, so we may concludes an accumulation is going on silently.
=================================================================================
NOT A RECOMMENDATION: This post is strictly for educational purposes to demonstrate price action principles and observation skills. I am NOT a SEBI-registered Investment Advisor or Research Analyst. Many time I was proven failed in past.
NO CALL TO ACTION: Do not treat this as a "Buy," "Sell," or "Hold" instruction. No specific price targets or stop-loss levels are being provided.
MARKET RISK: Equity investments are subject to market risks. Past performance and chart patterns do not guarantee future results.
PERSONAL DISCLOSURE: I may have a personal interest or position in this stock. My views are personal and should not be used as a basis for financial decisions.
ADVICE: Always consult a qualified and SEBI-registered financial professional before investing your capital.
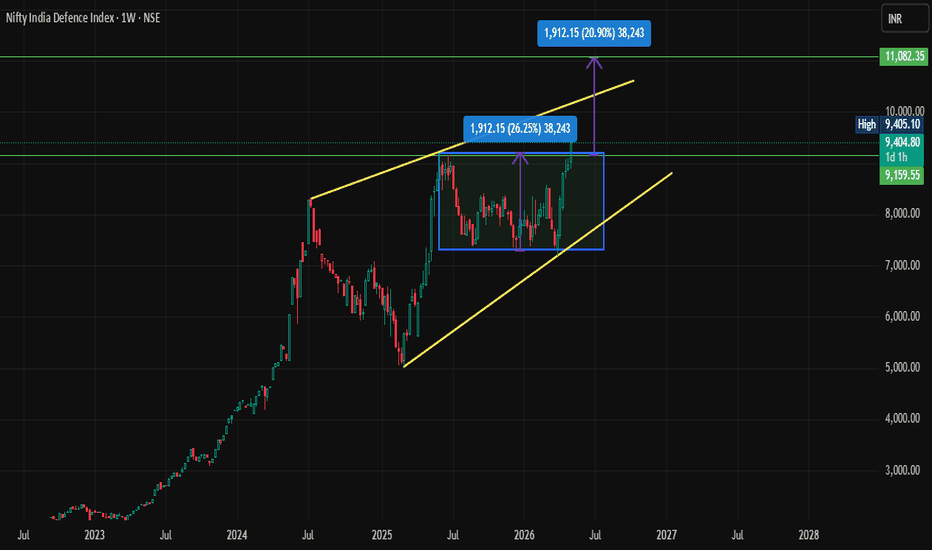
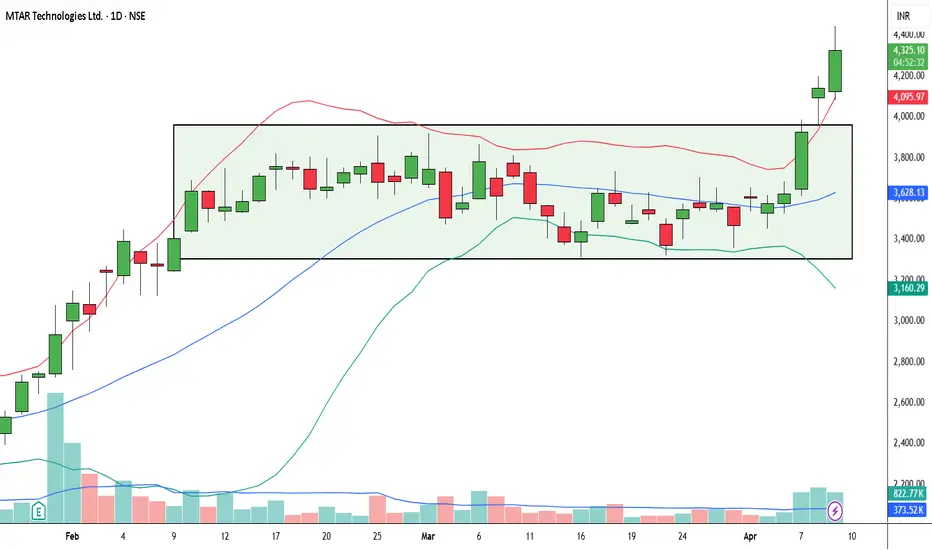
NIFTY DEFENSE very big break outNIfty Defense is giving very big break out on chart , rectangle break out can take this index to 20-22% higher from here aprox 11000 from 9300.
Many defense stocks also giving big break out , MZDOC, HAL,BDL etc.
I am not a SEBI-registered Investment Adviser or Research Analyst. The views expressed here are solely my personal opinions and for educational purposes. This is not a solicitation to trade. Investing in securities is subject to market risks; I assume no responsibility for any profit or loss arising from this post. I hold any position in the mentioned security.
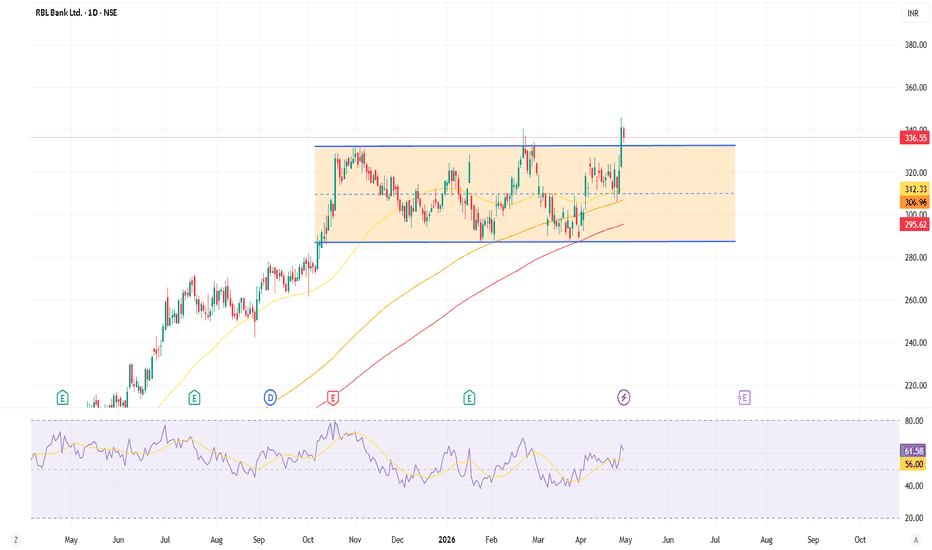
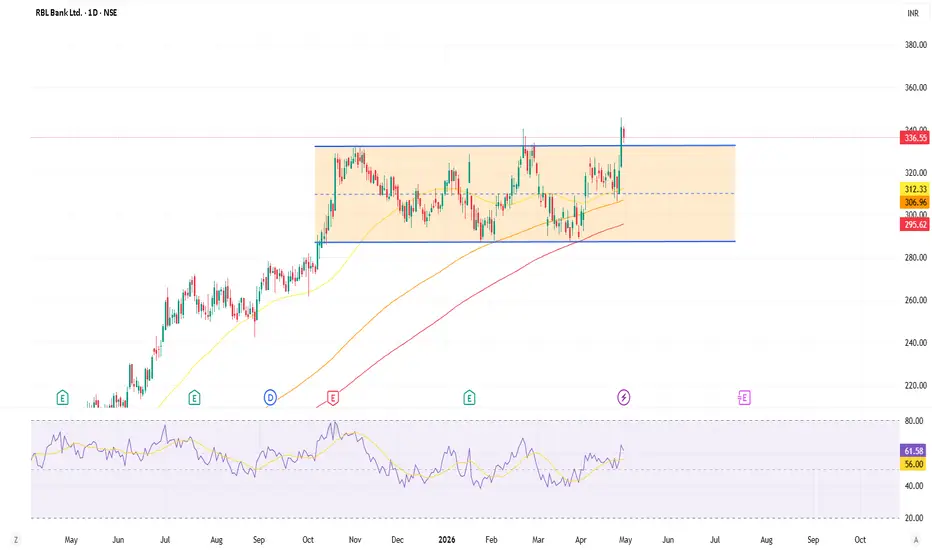
RBLBANKThe chart is self-explanatory and is shared for educational purposes.
RBLBANK has recently delivered a strong breakout from a long-term consolidation range (rectangle pattern). The stock is consistently trading above its key moving averages, with the 50, 150, and 200-period lines showing a positive slope.
Following the breakout above the resistance zone, the price action suggests that previous resistance is now acting as a floor. With the RSI maintaining positive momentum, the upward trend appears likely to continue as long as it holds above the breakout level.
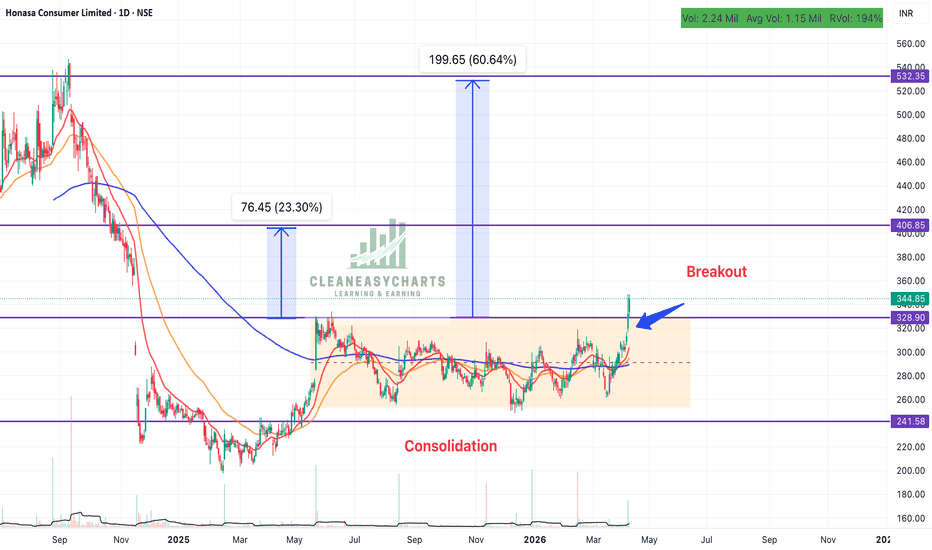
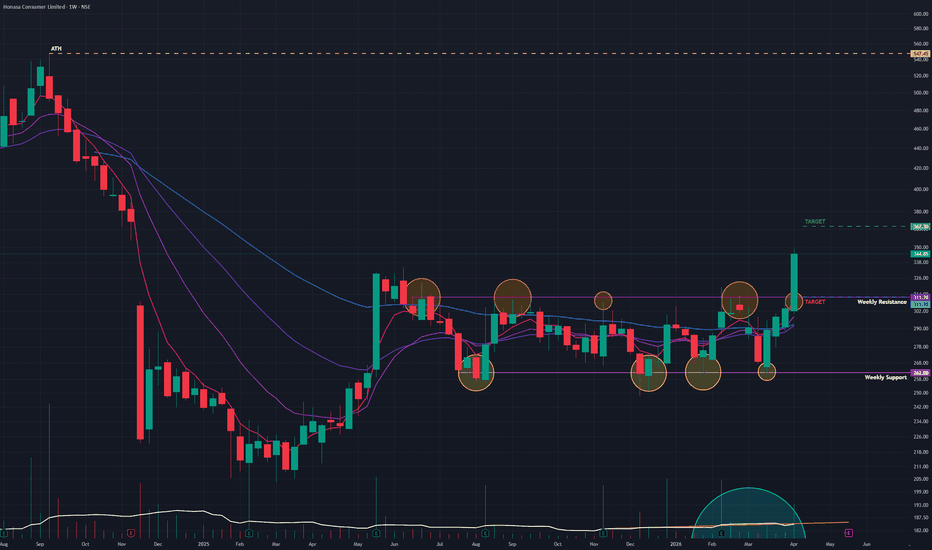
Honasa Consumer - Breakout after 1 year consolidationHonasa Consumer owns brands viz. Mama Earth; B Blut, Dr. Sheth; etc - a complete business line for cosmetics. Why this tock is heading for a big rise:
1. Multiple brands and not dependent on one brand
2. Growth of its products are rising
3. Last Quarter has best results
4. Technically, after falling 60%, it has given a breakout after 1 year with good volumes
5. Golden cross-over - 20EMA crossing over 50 & 200EMA
6. Promoters have increased stake in the company on QvQ
Given the above, the stocks is looking solid and is heading to move upwards.
Keep following @cleaneasycharts as we provide Right Stocks at Right Time at Right Price.
Cheers!!
Honasa Consumer ltd (W): Aggressive Bullish, Earnings-led BOTimeframe: Weekly | Scale: Logarithmic
The stock has decisively shattered a 10-month consolidation ceiling. The breakout is of the highest quality because it is backed by a powerful fundamental earnings update, massive relative strength against a falling market, and climax volume.
🚀 1. The Fundamental Catalyst (The "Why")
The technical explosion is fully justified by the Q4 FY26 update:
> Growth Projections: Management forecast overall business growth in the "late twenties," with its flagship Mamaearth brand delivering "teens" growth and newer brands (like The Derma Co. and Aqualogica) hitting "mid-twenties."
> Margin Stability: The company expects to sustain its operating profit margins through marketing efficiencies, easing investor concerns over high customer acquisition costs in the D2C space.
> Relative Strength: The stock surged over 11% on April 9th—a day when the broader Nifty 50 index fell over 1%. This divergence is a classic sign of institutional money rotating into fundamentally strong performers.
📈 2. The Chart Structure (The Box Breakout)
> The Consolidation: The sideways phase was active since June 2025. The stock spent months absorbing selling pressure and resetting its valuations.
> The Breakout: The close near ₹345 is well above the ₹311–₹315 resistance zone, definitively confirming the end of the consolidation phase.
📊 3. Volume & Indicators
> Volume Ignition: The 14.64 Million weekly volume is an "Institutional Stamp." This level of churn indicates that smart money is aggressively positioning for the next fiscal year.
> Momentum:
- EMAs: The Positive Crossover (PCO) on the weekly timeframe confirms the medium-term trend has shifted to an uptrend.
- RSI: Rising on both the Monthly and Weekly timeframes confirms trend harmony.
🎯 4. Future Scenarios & Key Levels
The stock is now in a "Markup Phase" with momentum firmly in the bulls' favor.
🐂 Bullish Target (The Extension):
- Target: ₹370. It acts as the next major psychological resistance and aligns with the measured move of the recent consolidation box.
🛡️ Support (The "Must Hold"):
- Immediate Support: ₹311.70. This is the exact breakout point. The Polarity Principle dictates that this former ceiling must now act as a rigid floor.
- Stop Loss: A weekly close below ₹300 would invalidate the breakout momentum and trap late buyers.
ICEMAKE at a Critical Decision Zone | Support Test in ProgressICEMAKE is currently approaching a make-or-break zone, where the next move will likely define the short-term direction.
After a strong long-term uptrend, the stock is now showing short-term weakness, drifting towards a key support area.
🔍 Price Action Breakdown
• Price is testing a crucial support zone around ₹755–₹765
• This zone aligns with previous demand + long-term structure support
• The stock is forming lower highs, indicating weakening momentum
📊 What’s Happening Now?
• The recent decline is happening with low participation, showing lack of strong buying interest
• No visible aggressive demand near support yet
• Price is slowly drifting down — not a strong panic fall, but also not a confident hold
⚖️ Key Levels to Watch
🔹 Support: ₹750 – ₹760
🔹 Resistance: ₹840 – ₹850
📈 Possible Scenarios
✅ Bullish Case:
If price holds this support and shows a strong bullish reaction, we may see a bounce towards ₹840+
❌ Bearish Case:
If price breaks and sustains below ₹750, it can lead to further downside towards ₹700–₹720 zone
💡 Trading Insight
This is not a confirmed reversal yet —
it’s a stock approaching support with weak structure and low demand visibility
📌 Strategy
• Fresh buying only above ₹850 breakout
• Existing holders should keep a strict eye on ₹750
• Avoid early entries — let the market confirm
📊 Final Verdict: WAIT & WATCH
Patience is key here. Let price react first, then act.
💬 What’s your view?
Support hold karega ya breakdown aayega? Comment below 👇 Market Insights by Ayushi Shrivastava | NISM-Certified Research Analyst
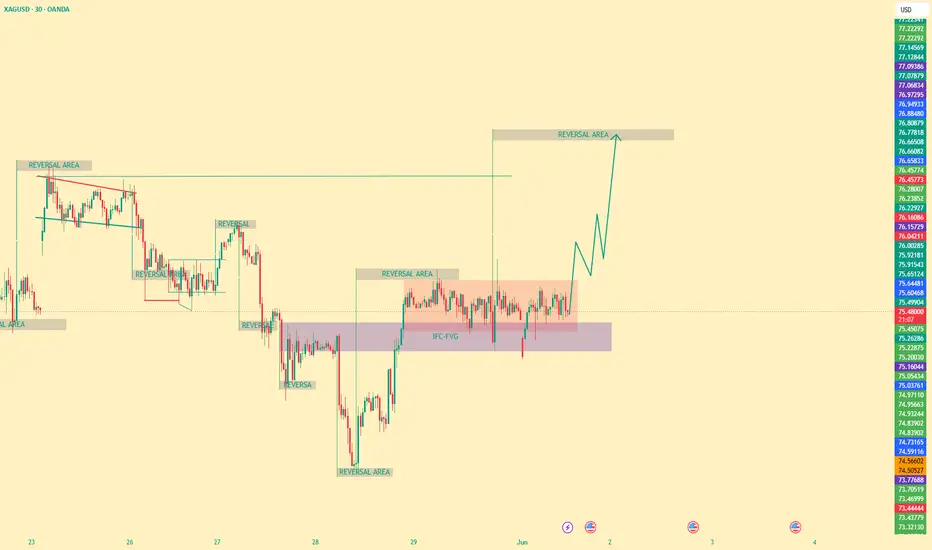
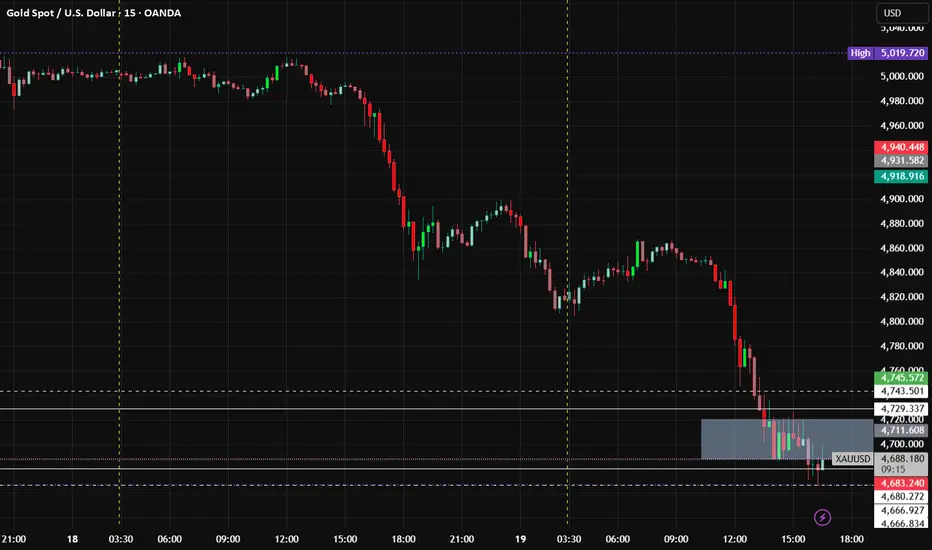
Gold Crash Continues – Bearish Momentum DominatesGold (XAU/USD) is trading near 4679 USD, down -2.9%, showing strong bearish momentum as all major indicators signal sell.
However, oversold conditions suggest a possible short-term bounce. As long as price stays below 4800–4820, the bias remains bearish with downside targets around 4650–4620. A move above 4820 may trigger a brief pullback toward 4855–4880.
Disclaimer: This is for educational purposes only, not financial advice. Trade with proper risk management.
IGB 10Y Weekly UpdateBonds have traded largely within a range of 6.64%-6.76%, amid geopolitical tensions in West Asia, rising oil prices, and supply shortages due to the closure of the Strait of Hormuz. RBI purchases of ₹57,000 Cr in the first week of March, along with OMO purchases of ₹50,000 Cr each on March 9 and 13, supported yields within this range—even as inflation fears from geopolitical tensions weighed heavily.
For the coming week, bond yields are expected to trade in a similar range of 6.64%-6.78%. A breach of the 6.64% support level could drive yields toward 6.60%, which is likely if positive news emerges about a war stoppage or easing supply chain fears.
Let me know your thoughts. DYOR
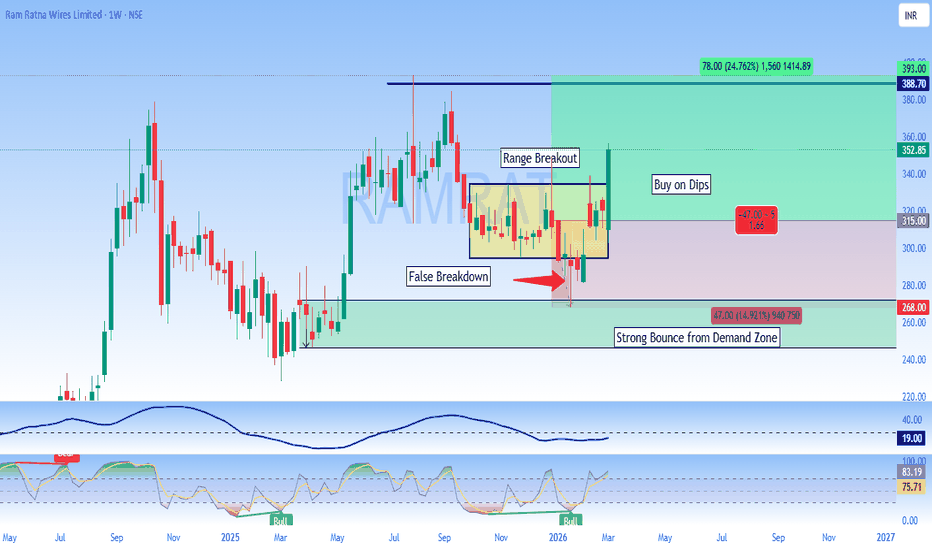
Ramrat Range Breakout - Long - Investment Ideas
**Ram Ratna Wires Limited (NSE) – Weekly Chart Analysis**
📊 **False Breakdown → Strong Demand Zone Bounce!**
Price showed a **False Breakdown** below the consolidation range and has bounced strongly from the **Demand Zone (268.00)**. A classic bull trap reversal setup with momentum building.
**Buy on Dips** opportunity as price reclaims the range breakout level.
🎯 **Targets:**
- Tgt 1: 388.70
- Tgt 2: 393.00 (+24.76%)
📍 **Current Price:** ₹352.85
🛑 **SL:** 315.00 (candle close basis)
📉 **Risk:Reward** – 1.66 (as marked)
Momentum indicators turning **Bullish** on weekly timeframe. Watch for sustained close above 360 for confirmation.
---
⚠️ **Disclaimer:** *This analysis is purely for educational and informational purposes only and does not constitute financial or investment advice. I am not a SEBI-registered research analyst. Please do your own due diligence or consult a certified financial advisor before making any trading or investment decisions. Markets are subject to risk. Past performance is not indicative of future results.*
Agi Infra Ltd (NSE): Breakout from 5-Month Accumulation ZoneAgi Infra is currently presenting a high-probability breakout setup. After consolidating in a tight range between ₹230 and ₹295 since October, the price is finally challenging the upper boundary with significant bullish intent.
Execution Note
Wait for a decisive daily close above ₹295 to avoid the bull trap seen in early January. If the price retests the breakout zone at ₹290, it could offer a lower-risk entry point.
Technical Breakdown
Price Action: The stock has formed a Rectangular Base. A decisive daily close above the ₹295 resistance level confirms the breakout.
Volume Confirmation: Notice the surge in volume on the latest bullish candles .This indicates strong institutional absorption of supply at the resistance zone.
Momentum : The RSI has crossed above 60 and is trending toward 70, signaling that the bullish momentum is accelerating without being overextended.
Support Base: The recent swing low at ₹275 serves as immediate structural support.
The Trade Setup
Entry: Above ₹296
Stop Loss (SL): ₹270
Target 1: ₹325 (Previous swing high)
Target 2: ₹355+
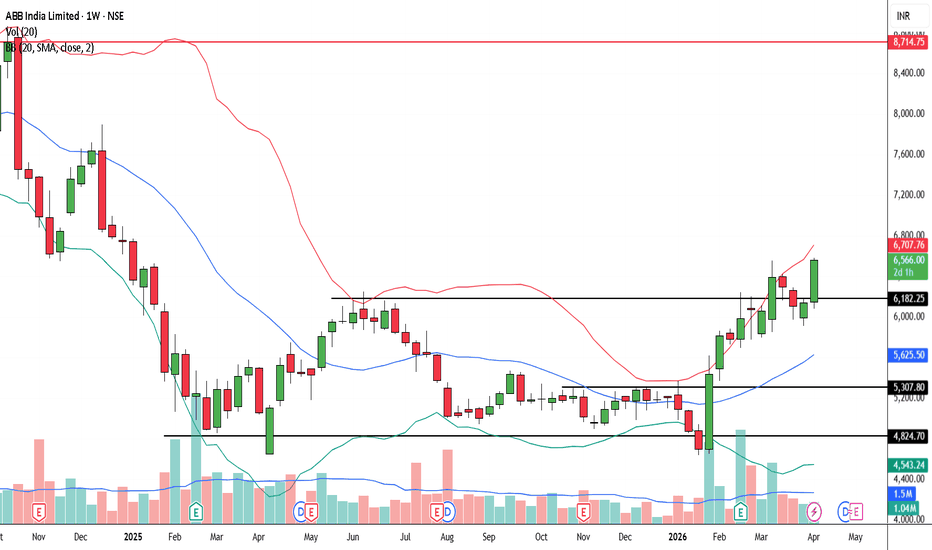
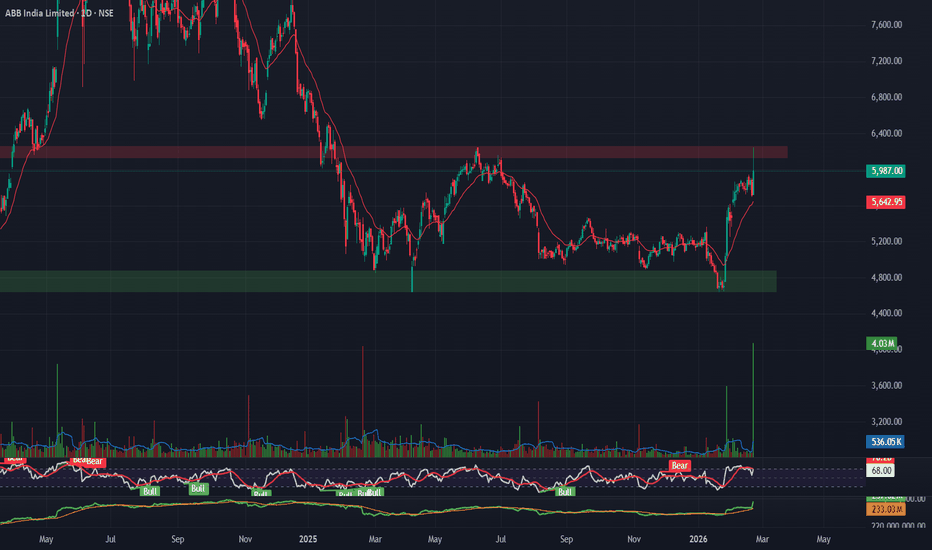
ABB India in a consolidation zoneABB India
Structure: Base Building / Horizontal Consolidation
-Breakout Level: 6256
-Target: 7856
-Stop Loss: 5719
Why it matters:
Industrial theme + consolidation after correction.
Volume supportive during bounce.
Risk: Still near resistance cluster — false breakout possible.
Lupin (D): Bullish (Pre-Earnings Breakout Attempt)(Timeframe: Daily | Scale: Linear)
The stock is challenging its 52-week high of ₹2,249 ahead of its Q3 results. The structure is a "Cup and Handle" or "Ascending Triangle" breakout, supported by recent product launches in the US.
🚀 1. The Fundamental Catalyst (The "Why")
The stock is active due to two specific triggers:
> Q3 Earnings (Feb 12): The Board meets this Thursday to declare results. The market expects strong US sales numbers, which is keeping the price buoyant.
> US Launch (Feb 5): The recent launch of Topiramate ER Capsules (a generic epilepsy drug) in the US is a positive revenue driver, fueling the current sentiment.
📈 2. The Chart Structure (The Squeeze)
> The Range: The stock has spent months absorbing supply between ₹1,800 and ₹2,200 .
> The Breakout Point: The angular resistance and horizontal resistance converge at ₹2,215 – ₹2,230.
- Current Action: Today's move (trading near ₹2,210+) is an attempt to clear this final supply zone before the results.
📊 3. Volume & Indicators
> RSI Refinement: The RSI is ~54 (Daily) , which is healthy. It has room to run towards 70 (Overbought) if the breakout occurs.
> EMAs: The stock is respecting the 20-Day EMA (approx. ₹2,170) , which acts as a dynamic trendline support.
🎯 4. Future Scenarios & Key Levels
The trade is an "Earnings Breakout" play.
🐂 Bullish Breakout (The Trigger):
- Condition: A Daily Close above ₹2,250 .
- Target 1: ₹2,275.
- Target 2: ₹2,370.
🛡️ Support (The Safety Net):
- Immediate Support: ₹2,170. The 20-Day EMA.
- Stop Loss: A close below ₹2,130 would signal a "False Breakout" and potential post-earnings profit booking.
Force Motors (W): Aggressive Bullish (Earnings based BO attempt)(Timeframe: Weekly | Scale: Logarithmic)
The stock is challenging its "Blue Sky" zone after delivering a blowout earnings performance. While it faced intraday rejection at ₹22,200 (profit booking on news), the massive volume and 252% profit growth suggest that this resistance will likely be taken out soon.
🚀 1. The Fundamental Catalyst (The "Why")
The technical surge is fully supported by the Q3 FY26 numbers released this week:
> Profit Explosion: Net Profit jumped 252% YoY to ₹406 Crore , significantly beating estimates.
> Operational Growth: Revenue grew 12.6% , and the company showed resilience in margins.
> Expansion News: The board approved acquiring Veera Tanneries for ₹175 Cr, which the market views as a strategic move to secure land for future capacity expansion.
📈 2. The Chart Structure (The Box Breakout)
> The Box: The ₹14,980 – ₹22,200 range. This 7-month consolidation allowed the stock valuations to catch up with earnings.
> The Breakout Attempt: The stock spiked to ₹22,200 but failed to close above it.
- Interpretation: The long upper wick on the weekly candle indicates "Supply at ATH." Traders who bought the rumor sold the news. However, the body of the candle remains strong green, meaning the trend is still up.
📊 3. Volume & Indicators
> Volume Ignition: The volume of ~740K is an "Institutional Stamp." This is significantly higher than the average weekly volume, confirming that big funds are entering on the earnings beat.
> RSI: Rising in all timeframes. The Weekly RSI is entering the "Super Bullish" zone (60-80), which supports a trend continuation.
🎯 4. Future Scenarios & Key Levels
The stock is in "Price Discovery" mode, fighting the final resistance.
🐂 Bullish Target (Blue Sky):
- Trigger: A decisive Daily Close above ₹22,200 .
- Target 1: ₹27,380
- Target 2: ₹29,420.
🛡️ Support (The "Must Hold"):
- Immediate Support: ₹19,500 – ₹20,000. The "Psychological Round Number" and recent breakout base.
- Stop Loss: A weekly close below ₹18,152 would invalidate the bullish view and signal a return to the sideways range.
Conclusion
This is a Grade A+ Setup .
> Refinement: The "wick" at 22,200 is temporary supply. The 252% Profit Growth acts as a fundamental floor.
> Strategy: Buy on dip opportunity.
Sharda Cropchem (D): Aggressive Bullish (Earnings-Led Re-rating)(Timeframe: Daily | Scale: Linear)
The stock has confirmed a major breakout from a 7-month consolidation ("The Box"). This is a high-quality breakout because it is supported by a fundamental turnaround (earnings explosion) and record volumes.
🚀 1. The Fundamental Catalyst (The "Why")
The technical explosion is fully justified by the numbers:
> Q3 Earnings Blowout: The 366% profit jump re-rated the stock overnight. The market is adjusting the price to reflect this new earnings reality.
> Dividend Yield: The interim dividend of ₹6 (Record Date: Feb 6) adds a "Carry" incentive for buyers to hold.
> Volume Significance: The "Huge Volume" is institutional accumulation. Funds are likely re-entering the stock after the strong guidance.
📈 2. The Chart Structure (Rectangle Breakout)
> The Box: The ₹760 – ₹1,160 trading range, the stock spent 7 months coiling in this zone.
> The Breakout: Today's close at ₹1,162.70 is the first valid daily close above this multi-year barrier. A breakout from such a deep base usually has long legs.
📊 3. Volume & Indicators
> RSI: RSI is rising in all timeframes. In "Blue Sky" breakouts (New ATH), RSI can stay above 70 (Overbought) for extended periods. Do not treat it as a sell signal yet.
> EMAs: The Positive Crossover (PCO) across all timeframes confirms the trend is in the strongest possible state ("Markup Phase").
🎯 4. Future Scenarios & Key Levels
The stock is now in "Price Discovery."
🐂 Bullish Targets (The Upgraded View):
- Target 1: ₹1,327
- Target 2: ₹1,560.
🛡️ Support (The "Must Hold"):
- Immediate Support: ₹1,119 – ₹1,150 . The breakout zone.
- Refinement: If the stock dips to ₹1,120 , it is a "screaming buy" opportunity. The sideways support of ₹760 is now too far away to be relevant for this momentum leg.
Conclusion
This is a Grade A+ Setup.
> Refinement: The combination of Record Earnings + New ATH + Volume is the "Holy Trinity" of trading setups.
> Strategy: Watchout for the price action in the coming days & hold for ₹1,327 .
PAYTM KARO ONE97 COMMUNICATIONS NSE:PAYTM
Paytm karo varna stock ko niche karo 😅😅
Paytm take strong resistance from his major resistance and also do classical pattern consolidation after breaking down that is double confirmation for trend direction.
now, 1000 is major support
this is not a any types of advice.
this is just chart analysis
do your own research