Rectangle
17 Years Multiyear Rectangle Consolidation Breakout at RCF 17 Years #Multiyear Rectangle Consolidation #Breakout at #RCF (Rashtriya Chemicals & Fertilizers Ltd) Weekly Chart. Its #Outperformed #Nifty
What Is a Rectangle?
A rectangle is a pattern that occurs on price charts. A rectangle is formed when the price reaches the same horizontal support and resistance levels multiple times. The price is confined to moving between the two horizontal levels, creating a rectangle. The concept of a rectangle is similar to a Darvas Box.
KEY TAKEAWAYS -
1. A rect
SHERVANIBOX PATTERN / RECTANGLE PATTTERN
32 months of consolidation happening (from March 2020) in the range of 186_419 after a Break Out Retest. Seems like stock is waiting for some big trigger.Can blast one sided, once it sustains or MCB above 419.
Buy on sustain/MCB above 419 | WCBSL 264 | Tgt 550 / 650 / 750+
(or)
Buy around 340_270 | WCBSL 170 | Tgt 550 / 650 / 750+
6.9 Years Multiyear Rectangle Consolidation Breakout at JTEKT6.9 Years #Multiyear Rectangle Consolidation #Breakout at #JTEKTINDIA (JTEKT India Ltd) Weekly Chart. Its #Outperformed #Nifty.
What Is a Rectangle?
A rectangle is a pattern that occurs on price charts. A rectangle is formed when the price reaches the same horizontal support and resistance levels multiple times. The price is confined to moving between the two horizontal levels, creating a rectangle. The concept of a rectangle is similar to a Darvas Box.
KEY TAKEAWAYS -
1. A rectangle occurs
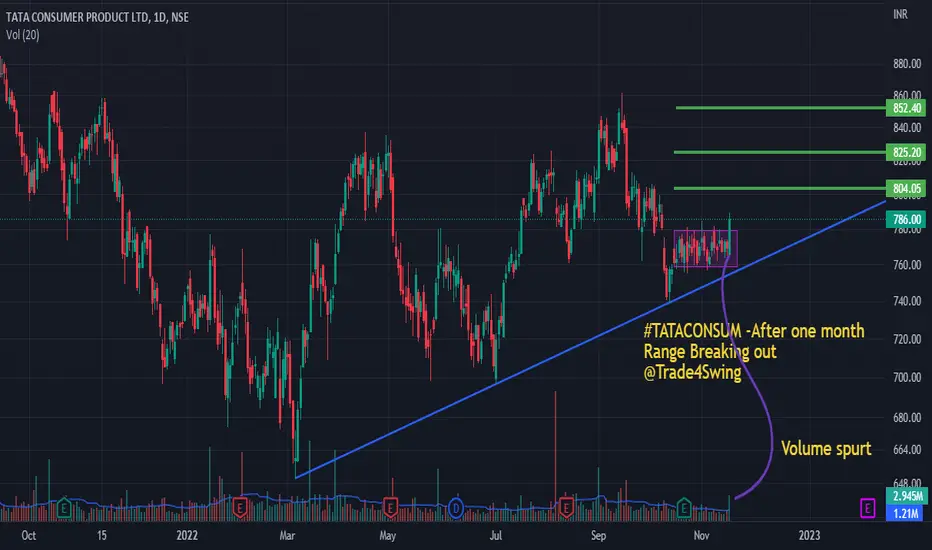
Consolidation BreakoutTataconsumer - showing sideways consolidation from last month. Now it gives breakout from the last one-month range forming a Bullish candle i.e. Engulfing or like a Marubozu candlestick pattern with good volume spurt, it may touch 850-860 level which is next resistance level .
Disclaimer - All updates/posts/discussions are only for education and learning purpose only. not provide any tips/recommendations/advice.
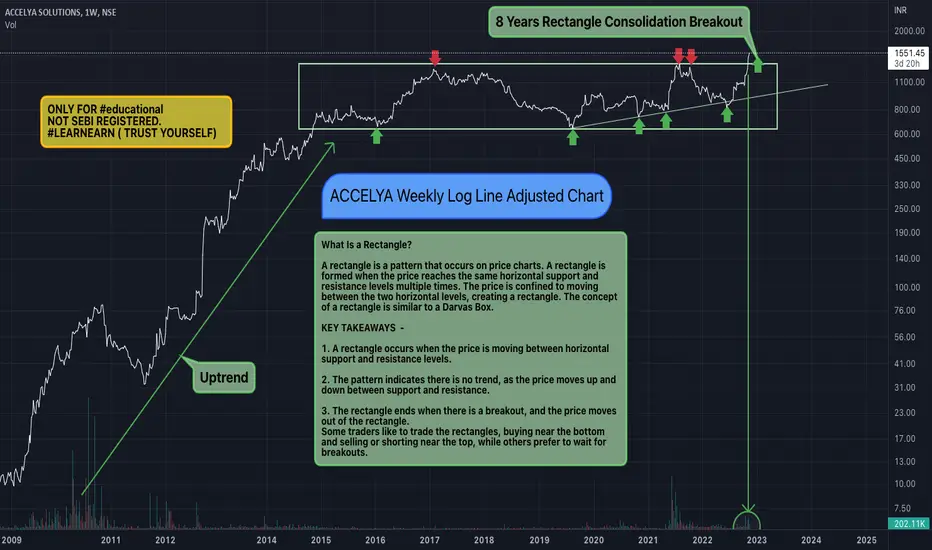
8 Years Multiyear Rectangle Consolidation Breakout at ACCELY8 Years #Multiyear #Rectangle Consolidation #Breakout at #ACCELYA (Accelya Solutions India Ltd) Weekly Chart. Its #Outperformed #Nifty.
BSE: 532268 / NSE : ACCELYA
What Is a Rectangle?
A rectangle is a pattern that occurs on price charts. A rectangle is formed when the price reaches the same horizontal support and resistance levels multiple times. The price is confined to moving between the two horizontal levels, creating a rectangle. The concept of a rectangle is similar to a Darvas Box.
HP Adhesive Cmp 408 dated 11-11-2022 FUNDAMENTAL & TECHNICALVIEWHP Adhesive Cmp 408 dated 11-11-2022
Analysis based on FUNDAMENTALS & TECHNICALS
1. Rectangle Consolidation
2. RSI already done BO
3. VOLUME BO
Buy @ CMP for target 420-435-450-460-475 SL 380
Fundamental Points :
1. Company has reduced debt.
2. Promoters Holding 71 %
3. FII's 4 % (75 % in strong hands)
4. Growth in Net profit with increase in Margin Profit.
Disclaimer :
I am not a Sebi registered Analyst so please do your own Analysis before taking any action.
The above view is shared jus
HDFC Bank Daily Timeframe AnalysisHDFC Bank getting ready for Breakout
It has formed Narrow range of last 8 sessions and Inside bar candles in last 3 sessions
Making LH - LH structure
Consolidating above last 88 days support zone and sustaining after dynamic resistance (trendline) breakout and formed NR7
If Breakout above 1468 and sustained can go long with SL 1445 and momentum targets of 1487,1513,1540
Kotak Mahindra Bank I have observed that Kotak Mahindra Bank is in weekly range of 1650-2000 since two years. Bank Nifty has shot-up up to 71 percent in last two years. Kotak Mahindra Bank is one of the fig four bank in major four private banks namely HDFC, ICICI, Axis and Kotak.
Still kotak mahindra bank is within the range. If, Kotak Mahindra Bank breaks range of 2000 and moves above, we will see fantastic rally in such stock.
Banknifty view for 10 Nov ExpiryNSE:BANKNIFTY is Trading in a narrow price range from date 24 nov to 4 nov.
41,500 is crucial level for banknifty. Its a strong resistance or supply zone. Banknifty is trying to break this resistance. On Nov 1 it succeed to break resistance but not able to sustain. Also this level is tested for multiple times.
On the other hand, 40850 is strong support. 2 times banknifty took support from that level and gone upside.
Banknifty is curretly neither in Up trend nor in Down trend. Its just mov
BESTAGROBOX PATTERN / RECTANGLE BREAKOUT
Buy @ cmp & in dips till 1440 | WCBSL 1365 | Tgt 1850 / 1950+
In past, stock moved more than 550 points twice after the BOX / RECTANGLE BREAKOUT. Now again gave breakout of same pattern. Price Action indicates stock can move 450_550+ points from the Breakout level.
Cummins India Cmp 1293 dated 30-10-2022 RECTANGLE BOCummins India Cmp 1293 dated 30-10-2022
1. Rectangle Pattern Bo @ 1290
2. Price Rise with Volume Rise
Buy @ Cmp for target 1350-1415 SL 1250
Disclaimer :
I am not a Sebi registered Analyst so please do your own Analysis before taking any action.
The above view is shared just for educational purpose.
By no means shall be responsible for any losses amounting out of it incase if any trades on it.
It is just a view, pls trade at your own risk.
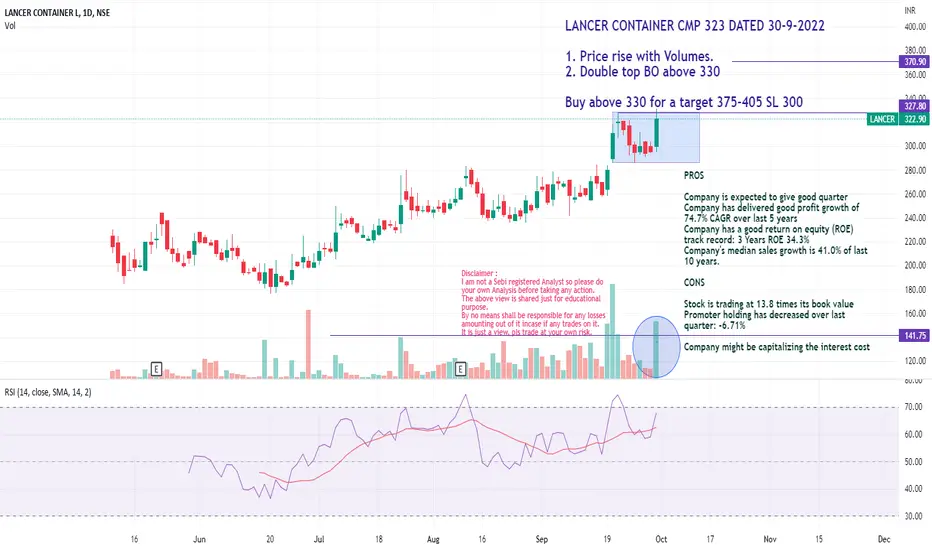
LANCER CONTAINER CMP 323 DATED 30-9-2022 Price+Volume+LANCER CONTAINER CMP 323 DATED 30-9-2022
1. Price rise with Volumes.
2. Double top BO above 330
Buy above 330 for a target 375-405 SL 300
PROS
Company is expected to give good quarter
Company has delivered good profit growth of
74.7% CAGR over last 5 years
Company has a good return on equity (ROE)
track record: 3 Years ROE 34.3%
Company's median sales growth is 41.0% of last
10 years.
CONS
Stock is trading at 13.8 times its book value
Promoter holding has decreased over last
quarter: -6.
MCX Cmp 1495 dated 25-10-2022 RECTANGLE BOMCX Cmp 1495 dated 25-10-2022
1. Bullish Katana Candle
2. Rectangle Pattern BO above 1501
2. Volume Rise
3. RSI BO
Buy above 1501 for target 1540-1610-1665-1715-1790-1850 SL 1385
Disclaimer :
I am not a Sebi registered Analyst so please do your own Analysis before taking any action.
The above view is shared just for educational purpose.
By no means shall be responsible for any losses amounting out of it incase if any trades on it.
It is just a view, pls trade at your own risk.