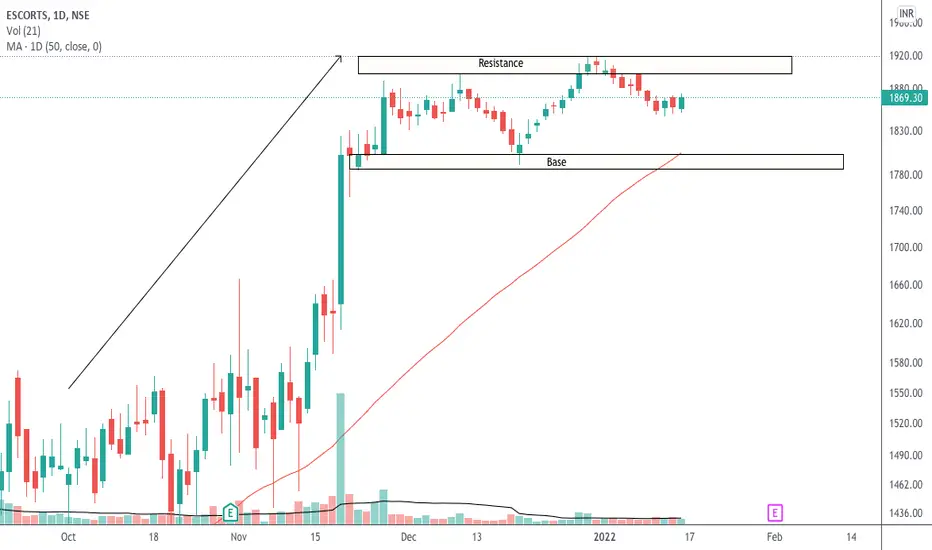
Rectangle
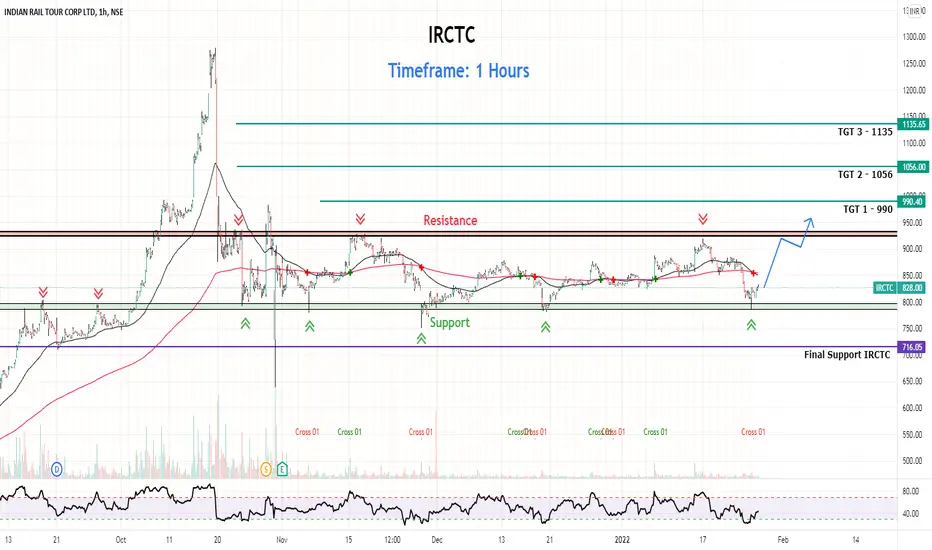
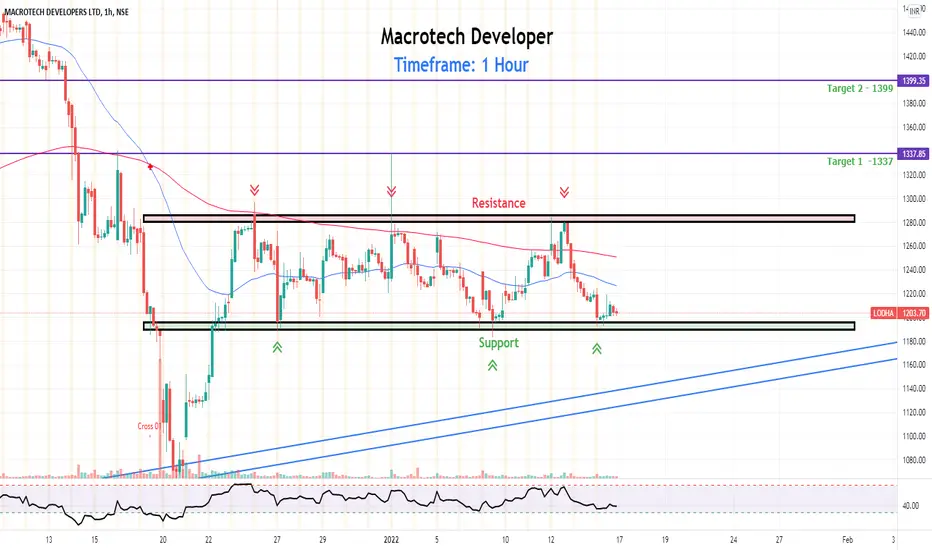
IRCTC is stand on very strong support zone .IF IRCTC is respect this support zone then we very easily see IRCTC at Resistance level .& If stock breakout resistance zone then we see TGT 1 / 2 / 3 also .& more than because Fundamentaly very nice & also monopolly stock.Which is Good for long term also.
Nifty Bank- 30 Minutes chartsNSE:NIFTYBANK 37382
1. While Nifty is showing free fall, Nifty Bank still holding some strength in charts
2. 30Min Chart trading between the Rectangle Pattern
3. Breakdown below 37000 level and below this we can see some major fall
4. Some Relief for bulls above 38000 and breakout above 38900 levels.
#TechnicalAnalysis
Still waiting more Confirmation#Laurus Next support around 390 -400
please refer to the chart.
Gratify if you appreciate the practice then you can like it, share it and
If you want me to investigate any chart for you then would cherish doing that for you.
Thank you for your time and support.
Stay safe.
ADA reversal when?Hey everyone,
Here is a detailed analysis of Cardano . It has been in a downtrend since September first week. We might consider this downtrend as a correction if it takes support on the 0.786 level of Fibonacci . Let's get into the history of ADA and what happened in the past few weeks.
ADA retraced from the golden zone of Fibonacci of the previous wave and went for a new high at 3.097 USDT . Since then, it is in the downtrend. It has made some chart patterns too. Let’s look into it.
Th
Breakout in praj industries.Rectangle pattern breakout in praj industries in daily chart.
Good volume support.
This rectangle pattern is just a halt to the upmove started prior it as the volume dries down during its formation.
It also seems bullish flag pattern breakout in monthly chart
So, it is looking very good.
First Target is 510 and second Target is 610.
Stoploss is 391.
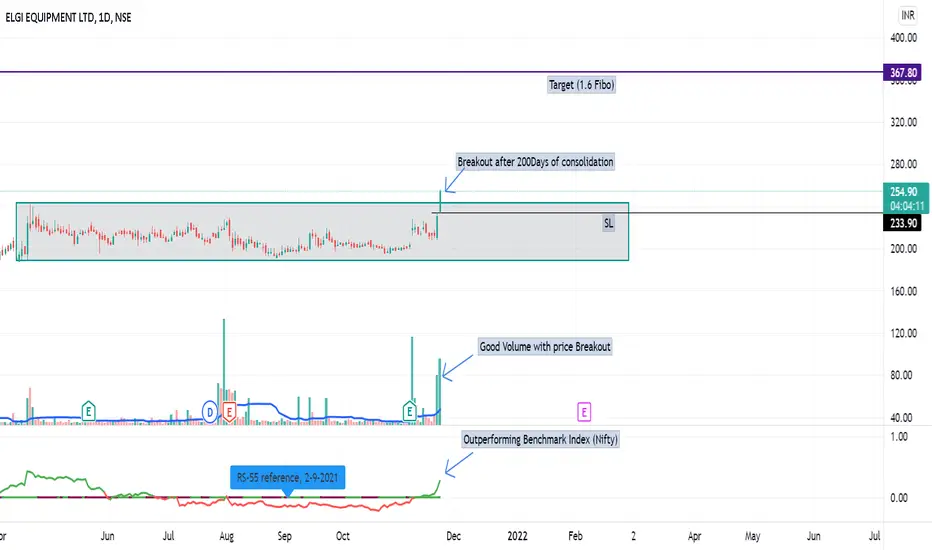
Simple risk Reward positional setupElgiequip Price is Breaking out 200 days of consolidation with good volume
Simple Low risk-reward setup for positional trade.
Few points to consider
- Rectangular Box price breakout.
- Good volume to support Price
- Relative strength is outperforming Benchmark Index (Nifty)
- Risk (SL), low of daily candle close
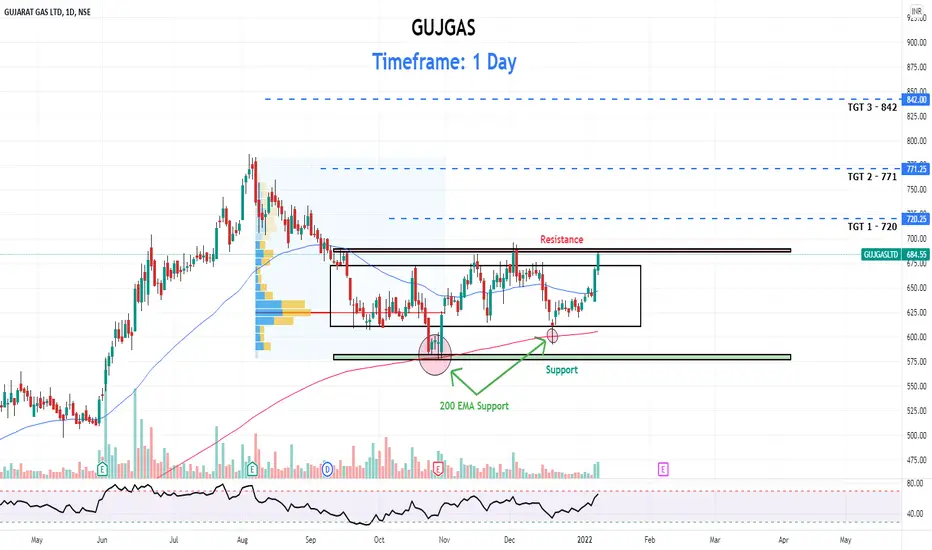
GUJGAS 2 times supported on 200 EMA ( Looking Bullish )NO discreption now watch chart . If monday morning gujgas open positive then we look for the buying side.
GLong
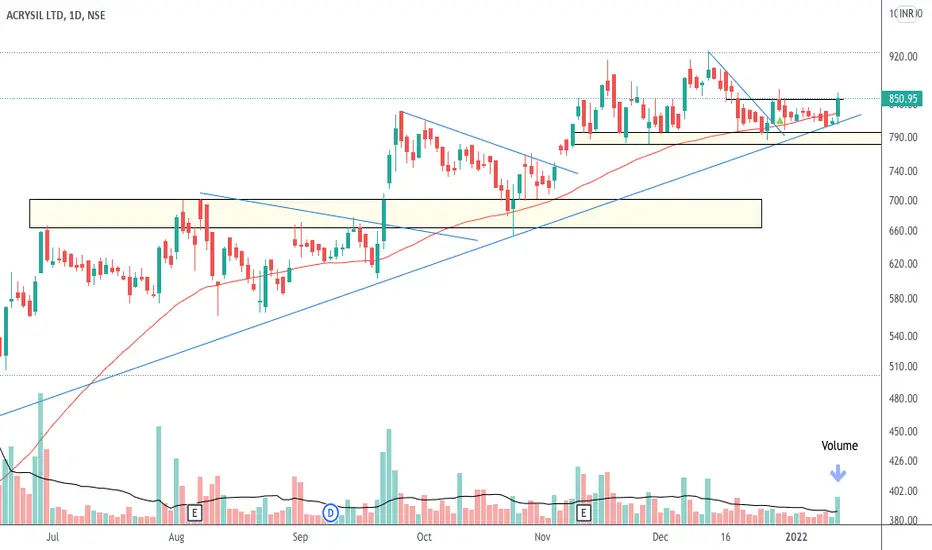
Near fresh Breakout, All time high possibleGood consolidation, holding trendline , ATH possible, volume support
ALong
HDFC LTD Conditional LONG Technically on the daily charts we see major support on the downside @ 2505 levels, whereas minor resistance on the upside is capped around 2588 level
If breaches minor resistance on the upside and closes above it For 15min , we may see fresh breakout and Hdfc can Lead towards higher levels around 2765/2845 levels in Short Term.
For Educational Purpose Only.
Regards,
MD
HLong