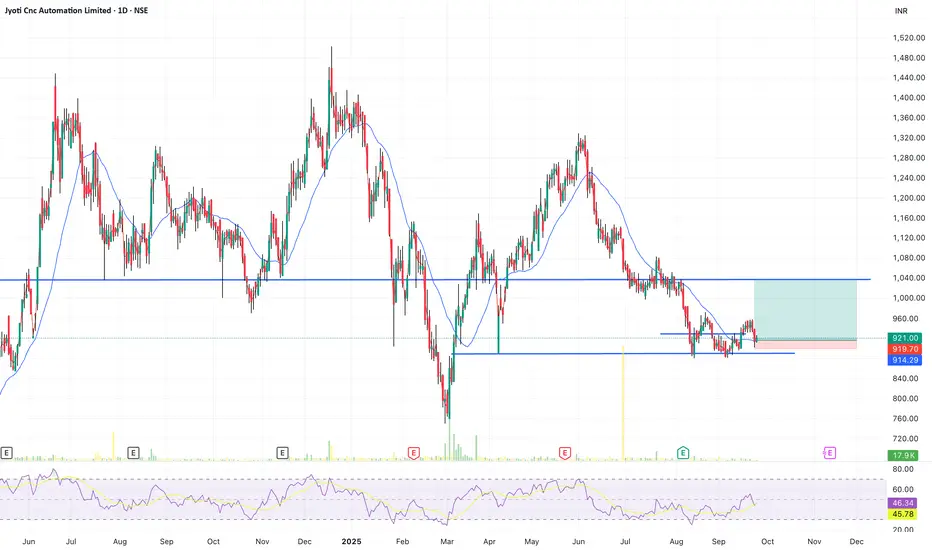
Short term swing on Jyoti CNCWith the earnings flattening out , EPS seems to have bottomed out and recent CEO statements clearly indicate strong order book and positive cash flow in Q3 leading upto Q4.
Along with these fundamental view , it formed a base between 878 - 924 range. Entererd the trade on breakout and pull back in to base.
Entry : Entry 912
SL : 875 ( I usually dont keep a hard SL, I exit if the price sustains under 875 for 2 successive trading sessions - thats how I've found success )
Target : 1035
Curr
Rectangle
InoxGreen (Weekly) - Major Breakout, Potential New UptrendInox Green Energy has shown significant bullish strength, breaking out of a key long-term horizontal resistance trendline last week. This crucial move was powered by a substantial +13.61% price surge and supported by decent trading volume, signaling a potential continuation of its upward trajectory.
This breakout follows a period of sideways consolidation that began in May 2025. The prior resistance had capped the stock's progress after its trend reversed in April 2025, following a downtren
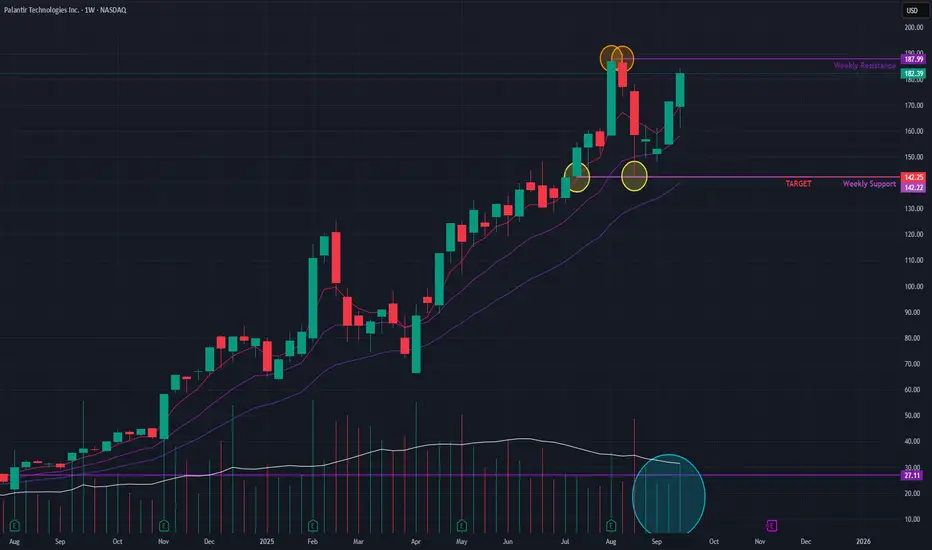
Palantir (Weekly) - Consolidation Near All-Time HighAfter reaching a new All-Time High (ATH) in recent weeks, Palantir has entered a period of consolidation. The stock has since been trading in a sideways range, struggling to break past the newly established resistance level.
Emerging Bullish Signals 👍
Despite the sideways movement, several indicators suggest that buyers are showing renewed interest:
- Momentum: Short-term Exponential Moving Averages (EMAs) have formed a positive crossover , a technical signal indicating that upward mom
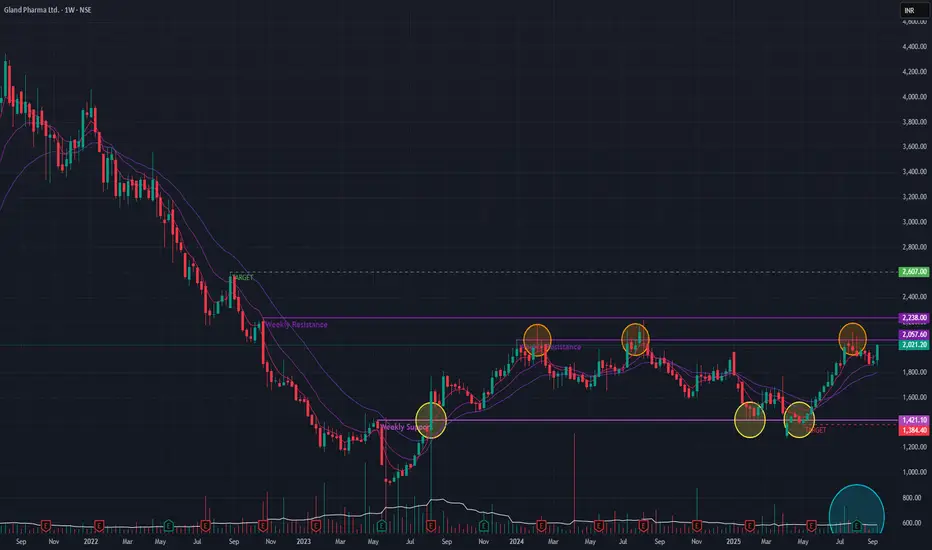
Gland Pharma (Weekly Timeframe) - Breakout of Sideways trend ?After a prolonged downtrend from its all-time high in August 2021, Gland Pharma has been trading in a sideways consolidation range since August 2023. Recent price action suggests that the stock is building momentum for a potential breakout, signaling a possible end to its bearish phase.
## Bullish Developments 📈
Recent Momentum: The stock showed significant buying interest last week, surging +6.82% accompanied by a decent spike in trading volume .
Technical Posture: The short-term Exp
Bajaj Finance (Weekly Timeframe) - Making new ATHAfter a multi-month sideways consolidation from April to September 2025, Bajaj Finance has signaled a potential resumption of its primary uptrend. This recent price action mirrors a similar pattern seen from October 2021 to January 2025, which was followed by a powerful rally to new all-time highs.
## Recent Bullish Developments 📈
Pattern Breakout: The stock decisively broke out of its recent sideways range last week, surging +7% on strong volume & a new ATH. This move indicates a shift f
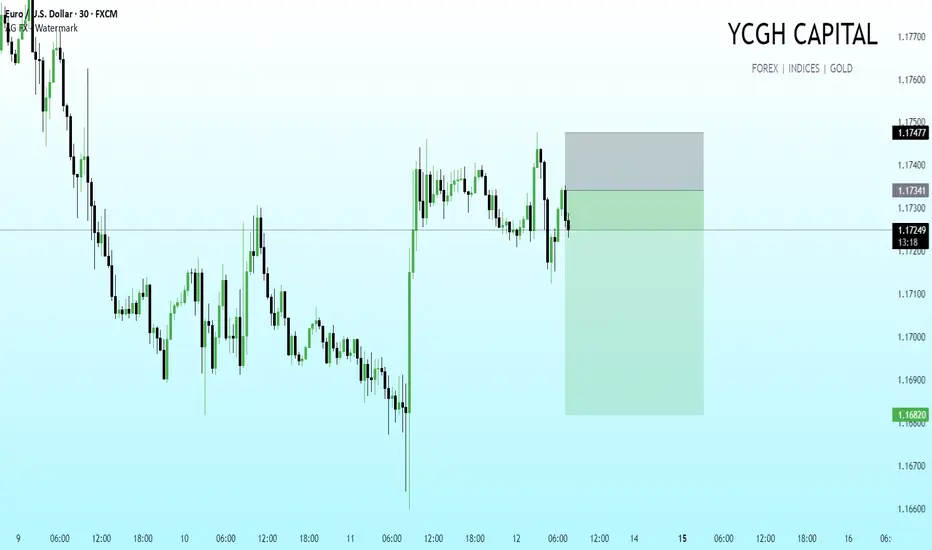
EUR/USD | 30M | Live Execution Zone
We’ve marked out our trade zone post-CPI. Price tapped into our supply pocket at 1.1747 and is now reacting as anticipated. Position structured with:
Entry at the rejection from supply
Stop above the sweep zone
Target the lower liquidity pool near 1.1680
Key narrative: Market took out liquidity on both sides, confirmed displacement, and is now showing signs of delivering south before the next structural shift.
This is a clean setup aligning with the higher-timeframe bias — patience and di
FIRSTCRY (Breakout Candidate) - Swing Pick#FIRSTCRY #stage1stock #breakoutstock #Trendingstock
FIRSTCRY : Swing / Short term (1-3 months)
>> Ready for Stage 1 breakout
>> Momentum stock
>> Volumes Spike Visible
>> Good strength in stock
>> Swing Traders can target 18% move, short term traders can look for Higher Targets
Swing Traders can lock profit at 10% and keep Trailing
Please Boost, comment and follow us for more Learnings
Disc : Charts shared are for learning purpose only, not a Trade recommendation. Do your own research and
IOL CP (Daily Timeframe) - Has the Sideways Trend BrokenOut ??IOL CP in the past two sessions have BrokenOut of the sideways trend that it was in since Mar 2022. Several attempts in the past to BreakOut of this trend has failed as indicated. The past two days, the stock was able to BreakOut as well as maintain it with huge volume. Short-term EMAs are in PCO state as well as a Golden Cross-over has formed few days back indicating bullishness.
If upside momentum continues then we may see 156 levels provided few resistances are breached. The stock may see 82
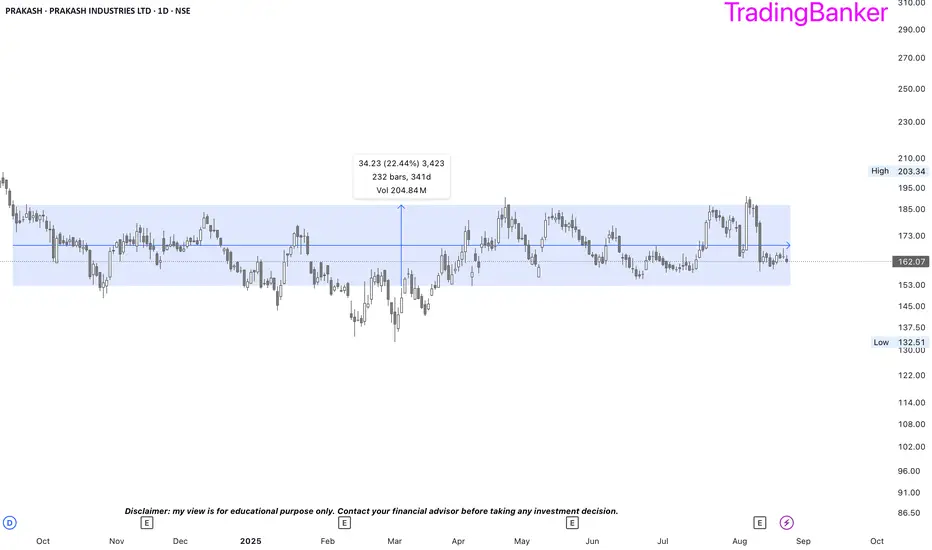
PRAKASH: range breakout soon?➡️script stuck in a range for almost a year and coiled up like a spring in the rectangle pattern.
➡️highest margins in last 5 years and an extremely low PE of 8 against the industry PE of 23.
➡️capex should bear fruit soon.
➡️highest promoter holding in last 6 years.
➡️not a matter of if, it’s a matter of when.
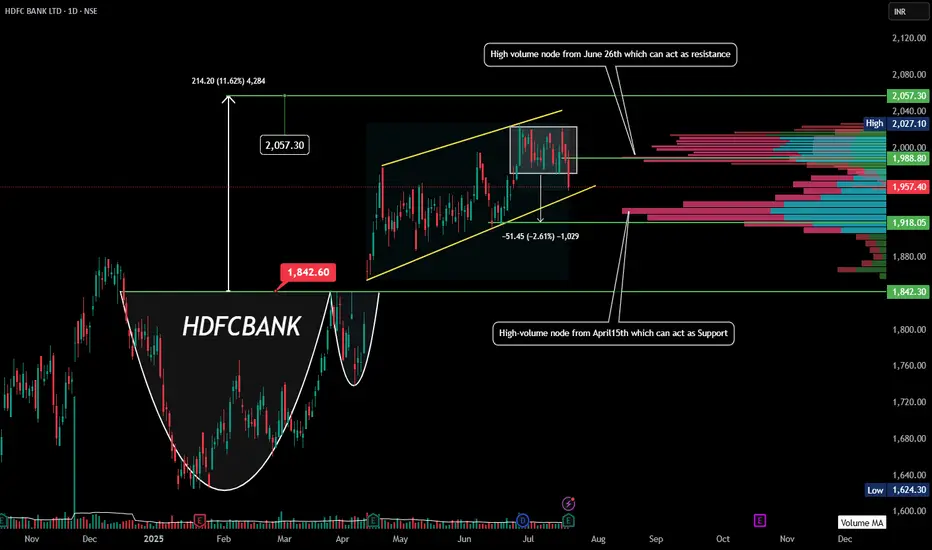
HDFCBANK | Result analysis |Support and resistance 🔍 Quick Summary: What’s Priced In?
Despite a solid PAT beat (₹18,160 Cr, +12% YoY), NII missed expectations (only +5% YoY) and margins fell. The profit beat was largely driven by non-core gains (₹9,130 Cr stake sale in HDB Financial). This signals:
Core operations slightly underwhelming
Market may not reward the PAT beat aggressively
Bonus + Dividend is already priced in (price rallied earlier)
📉 Technical & Derivatives Outlook:
🧱 Price Action:
Cup & handle breakout recently happened ✔️
Pri
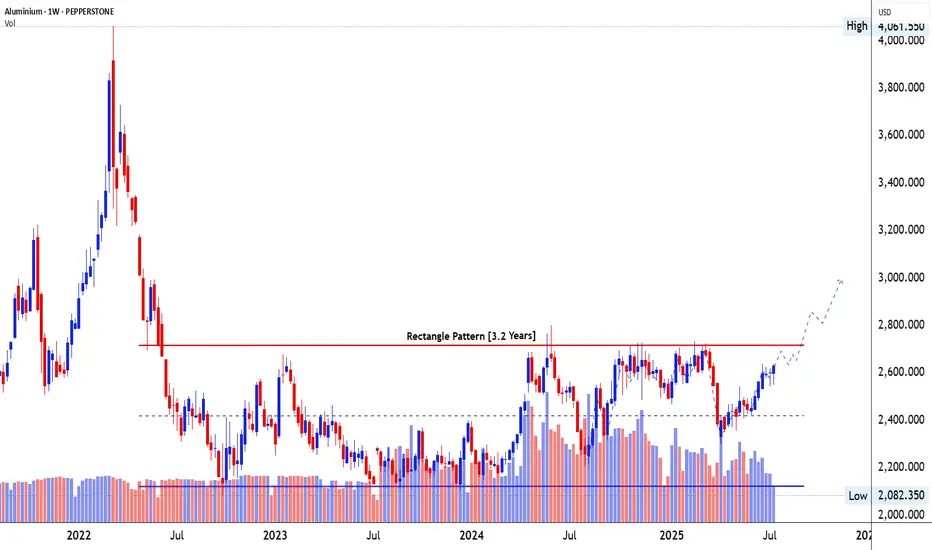
Big Breakout Soon in Commodity Chart similar to Silver Chart- 🚀 ALUMINIUM - $2631
Date: 18-07-2025
Price: $2,631.05
Volume: 37.12K
1⃣ Pattern Structure & Breakout Development 📈
📐 Pattern Identification: A Rectangle Pattern has been forming over 3.2 years, acting as a large-scale accumulation base. This is a continuation pattern typically seen in commodities post major corrections, where price builds energy for the next directional leg.
⏳ Time Taken in Formation: Over 166 weeks (~3.2 years), price has remained within a defined range. This extended time
DMART | ascending triangle -Consolidation Breakout**Avenue Supermarts Ltd. (D-Mart)**
> **D-Mart (NSE)** approaching breakout zone in ascending triangle 🧱📈
> Key level: ₹4,300.30 — clean structure since April
> RSI 58.95 → bullish momentum building
> Strong base between ₹3,267–₹3,340
> Rising wedge breakout earlier = trend confirmation
> Above ₹4,545.65, next leg toward ₹4,800–₹5,000+ in play
> #DMart #BreakoutStocks #TechnicalAnalysis #NSEIndia
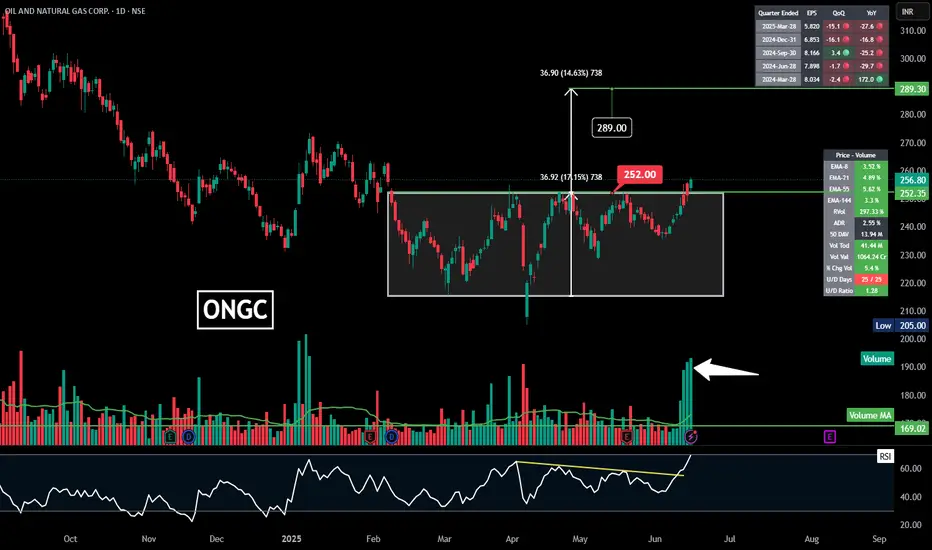
ONGC | Rectangle Range Breakout | Daily🔥 Another strong breakout — this time from **ONGC** — confirming a **Rectangle Range Breakout** pattern.
---
## 🛢️ **ONGC – Rectangle Range Breakout**
### 📍 **Pattern**:
* Consolidation in a **horizontal range** (Rectangle)
* Strong breakout above ₹252 with **massive volume spike**
* Target projected:
₹252 + ₹36.90 = **₹289**
---
### 📈 **Technical Highlights**
* ✅ Price broke out with highest volume spike in months
* ✅ RSI breakout above descending trendline
* ✅ EMA 8/21/55/144 all in b
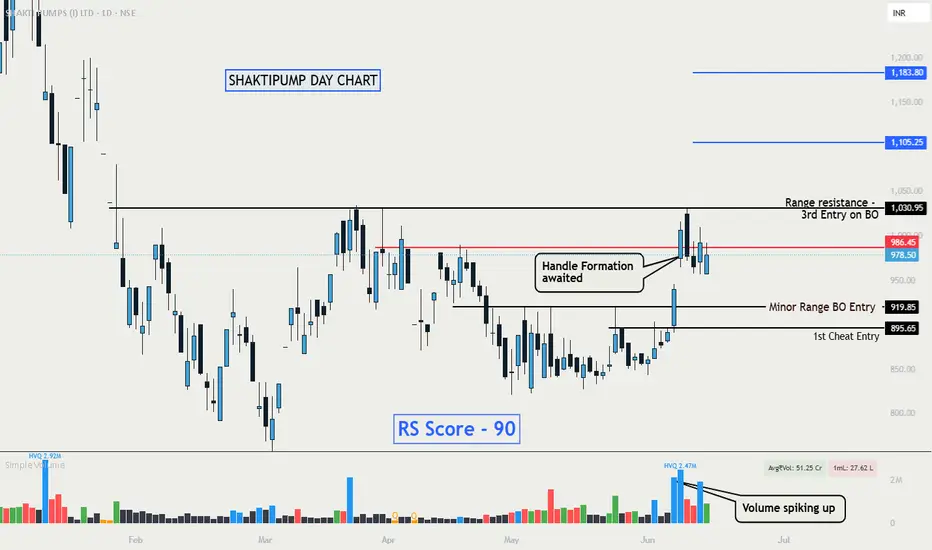
Breakout in SHAKTIPUMP - Spotted Smart money activityNSE:SHAKTIPUMP moved to priority list, Handle formation awaited as it has positioned well with a horizontal resistance of a larger range.
It will be a 3rd Entry Trigger - On breakout of 1030
Fundamentals Looks great - Strong EPS and Sales.
FPI - Increased stake by 3% in last quarter - making it 5.16% Total.
Volume Showing smart money jumping in.
Keep On Radar- 📈
Keep Learning, Happy Trading.
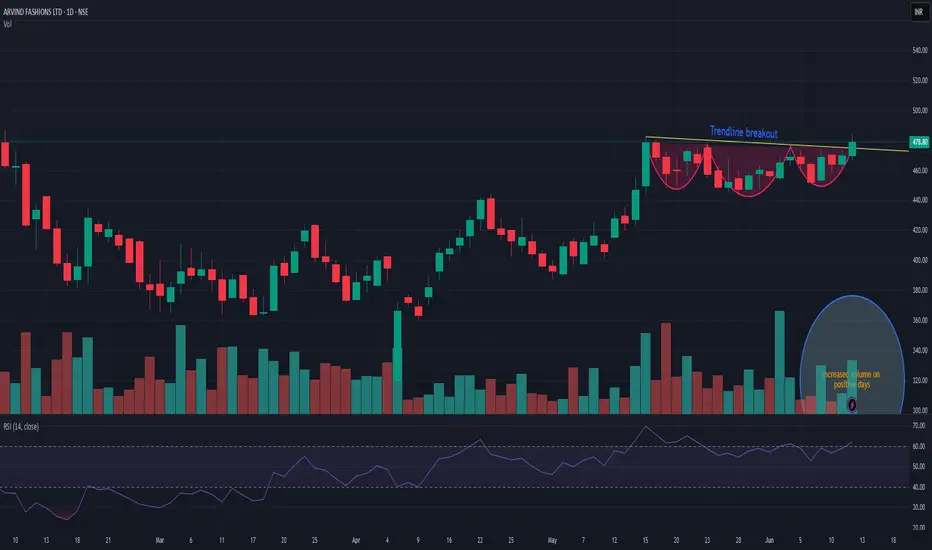
ARVINDFASNARVINDFASN showing very good strength on this negative days as well and currently trying to coming out of consolidation. As long as it is closing above 440 then dips are good to accumulate. Positive momentum may fetch the stock up to 600 in near term. And next trigger level can b above 485. Wait for the perfect entry point.
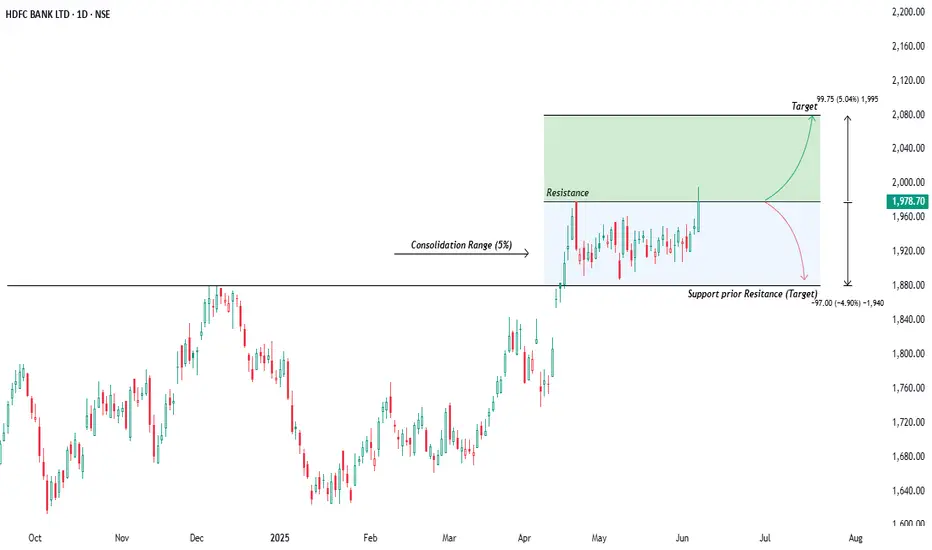
Hdfc Bank: Swing Trade IdeaHello Traders, Hope you're catching the right trends! so today we will discuss Hdfc bank on Daily chart as we can see that price formed a consolidation pattern following it's sharp uptrend in April. After a sustained rally, the share price paused and entered a sideways phase within a narrow 5% range, indicating temporary equilibrium between demand and supply. What makes this setup noteworthy is the position of the consolidation right above the prior resistance zone near 1880, which has now been