Maruti next target 6800Daily RSI is around 60 and Stock looks bullish. I would like to see 6800 before any correction.by Div_TraderUpdated 41
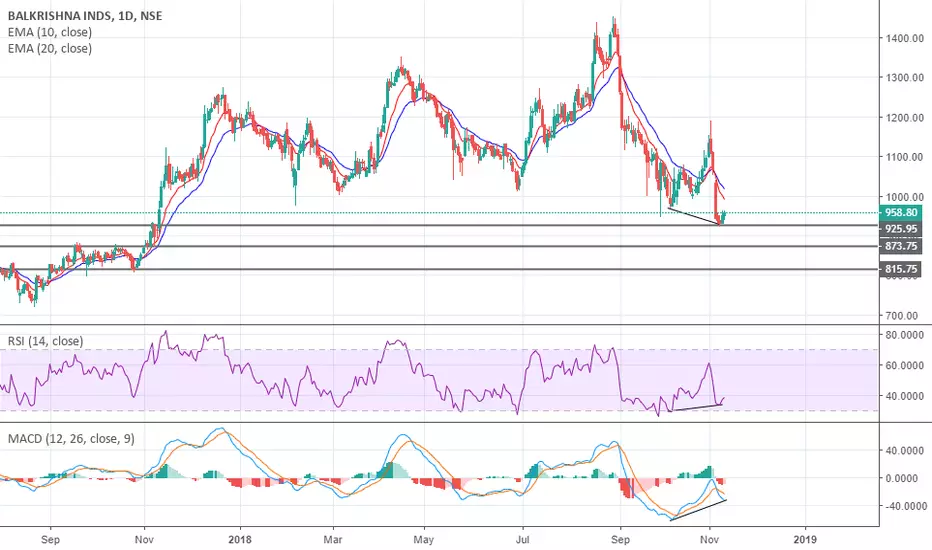
Balkrishna INDS Poised for a BounceThere is a Bullish RSI Divergence and MacD Divergence on Daily Chart. Stock is poised for positive movements for this week. 3 Support zones in the chart if setup fails to work.Longby Div_TraderUpdated 32
Double Bottome Reversal !Nicely formed double bottom pattern gave breakout and and trading decisively above the neckline. One can buy the stock now for a double bottom pattern target of approx 1900. which offers a reasonable Risk to Reward trade. RSI above 50 is also confirming the trade. Entry 1810 SL 1770 Target 1880 - 1900 Disclaimer : All ideas are my personnel view. Please take financial consultancy for trading decision. HLongby praveen.bhatiyaUpdated 2
Titan Bearish Divergence on 4h ChartTitan Chart shows Bearish Divergence on RSI, Stoch RSI and Momentum too. A pull Back is possible but overall Stock looks bullish for longer term. Bearish Divergence + Price approaching Resistance may bring the Price Down. If setup fails and breaks 910, Wait and buy the retest of 900 areas in next couple of days. Shortby Div_Trader3
PVR | RSI+RESISTENCE | EDUCATIONHere I used EMA , KAMA & RSI. at a 1450 level, a very strong resistance is there. We can see the RSI & chart pattern is complementing each other very well. it looks like the bullish trend is very strong so it can take some time to reverse. PEducationby harshit777Updated 10
i missed this divergence !i actually missed it n now just realised at 2 am that such a formation taken place in nifty Educationby pratik2358Updated 710
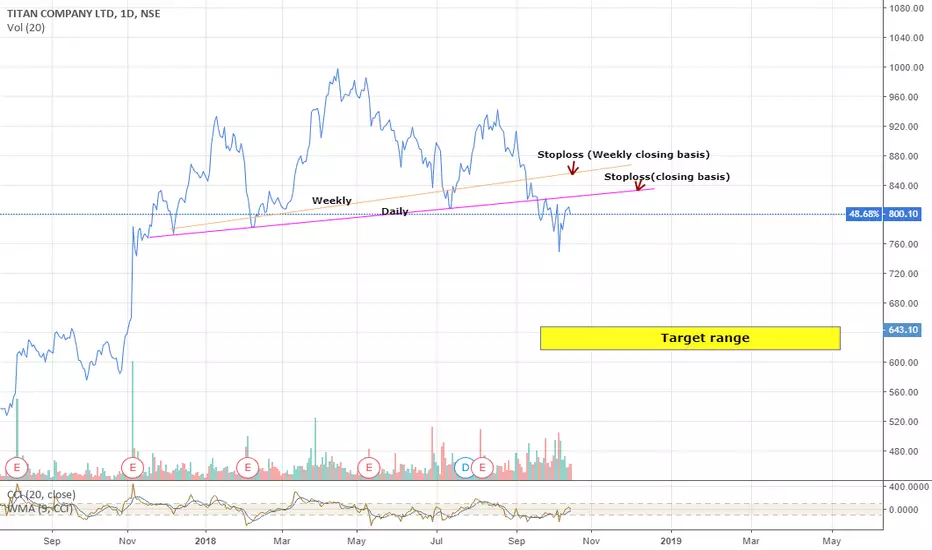
Titan mid term view- BearishTitan slowly turning to bearish mode as per weekly indicators. One can go short with minimum stoploss levels at this price. Vijayaraghavan.K, KovilpattiShortby Vijayaraghavan0
MRPL short term viewRefer chart for target and stoploss. It is setting for reversal in weekly chart. Buy@ 80.85- 82.5 Vijayaraghavan.K, Kovilpatti.Longby VijayaraghavanUpdated 1
Muthoot Fin Short term viewMost of the time I given my views before breakout, by viewing indicators and having confident on that, So safer traders, can initiate trade after breakout (on closing basis) and risky traders can buy from this level. Daily MACD cut,Weekly MACD crossover, ADX loosening the negative bias,RSI and CCI are in positive mode helps to breakout and reach the target on coming days. One hour chart also favorable to enter at CMP. Vijayaraghavan.K, Kovilpatti. Longby VijayaraghavanUpdated 2
ZEE1) Bearish divergence 2) Double bottom - buy at bounce back -- SL 490 3) Both SUN and ZEE has been posting strong ad revenue growth and good bottom line but stock has been under performing to squeeze out weak hands 4) Consumer companies have been performing well, which gives strong visibility of revenue growth for atleast 1 yearLongby NikunjPurohit2
RBL Bank - 1) Not able to break 580-- bearish divergence 2) Bank trade at 3.4x P/B and has been showing good performance 3) It is likely to show dip in price due to BANK NIFTY bearish view 4) Any dip should be used to buyby NikunjPurohit0
Big W Reversal with Bullish Divergence !Stock has formed big W reversal pattern and showing bullish divergence therefore it looks good for buying at this level. It has broken the short term trend line and RSI (14) is also healthy above 50. One can buy the stock now for a target of 4000 in due course by providing suitable SL. Disclaimer : All ideas are my personnel view. Please take financial consultancy for trading decision. Longby praveen.bhatiyaUpdated 210
Problem with RSI1. No Entry - Exit Pair As clearly seen, RSI shows 3 OverSold or Long Entry Regions but do not show even 1 OverBought - Long Exit Regions. Price falls after each Long Entry Regions 1 and 2. False Buy Regions. Most of the traders have no clue on when to sell, if they buy at Entry Regions. 2. Remains in OverSold or Long Entry Regions for so long and Price is falling continuously. As seen, entered into OverSold region @ Low of 2835 and finally came out of the region @ Low of 2808 Again, Most of Educationby mehul19747
READY TO FILL THE GAP!! mint millions will like to play this in OPTIONS by buying X strike (already bought ) for target of 1:5 ( loose 1 rs , gain 5 rs ) stop loss near 86 for 93 first tARGET !! & above 93 if susutains !! one way 104 ..Longby pratik2358Updated 13
Watch for trend change - EsterTechnical : RSI - Oversold MACD - Possible curve in coming days Current price far lower than 10/20/50 days SMA. Generally price trend to close gap with SMAs in certain period. Either SMAs should come down OR price should go up. I will better watch for price action and enter once I see MACD giving right signal. Company results are scheduled on tomorrow so also check for no bad news before entering. Longby nifty4moneyUpdated 0
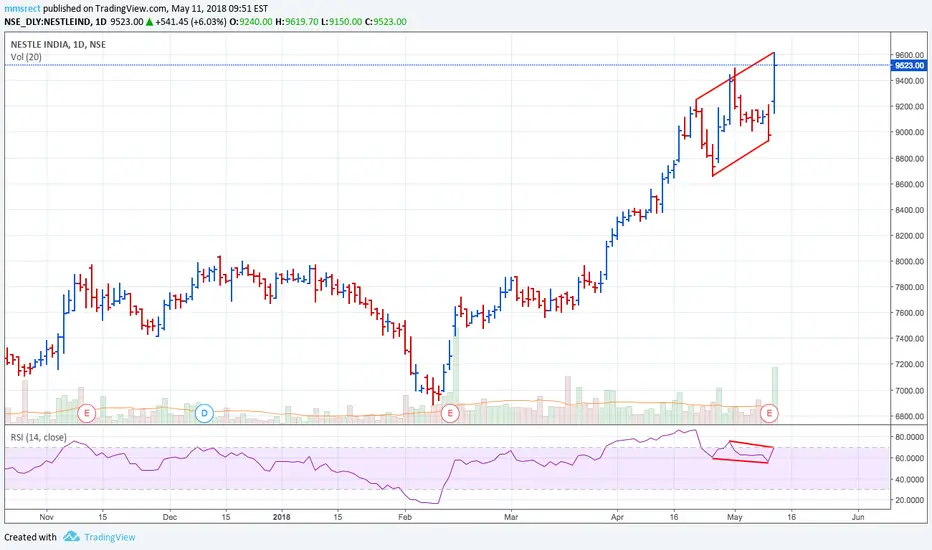
Could that be the end of the uptrend?Looks like a divergence where RSI is forming lower lows while prices form higher lows. Could that be the end of the uptrend?Shortby mmsrect13
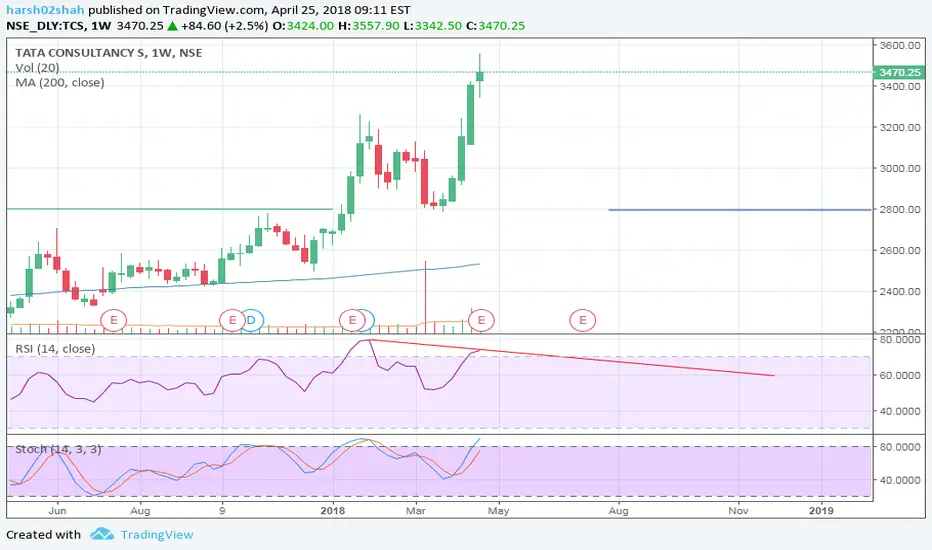
TCS WEEKLY RSI DIVERGENCETCS RSI Divergence on weekly chart. for target 3200. for Gap Fillby harsh02shah0
looks good !!! would like to accumulate .. WE AILL BE ARRANGING A FREE basic TECHNICAL ANALYSIS workshop from tomorrow (saturday) in case one has to attend canplease contact on my WHATSAPP NO . 823 7 555 768 so as i can provide the link to attend it online !Longby pratik2358Updated 7
NIFTY Showing DivergenceOn Daily Chart, Nifty 50 showing divergence with RSI. Will we see another rally from here?Longby shashankmanila14

 Long
 Short

 EducationShort
 Long
 Long
 Long
 Long

 Long
 Education

 Long
 Long
 Short

 LongLongLongShort