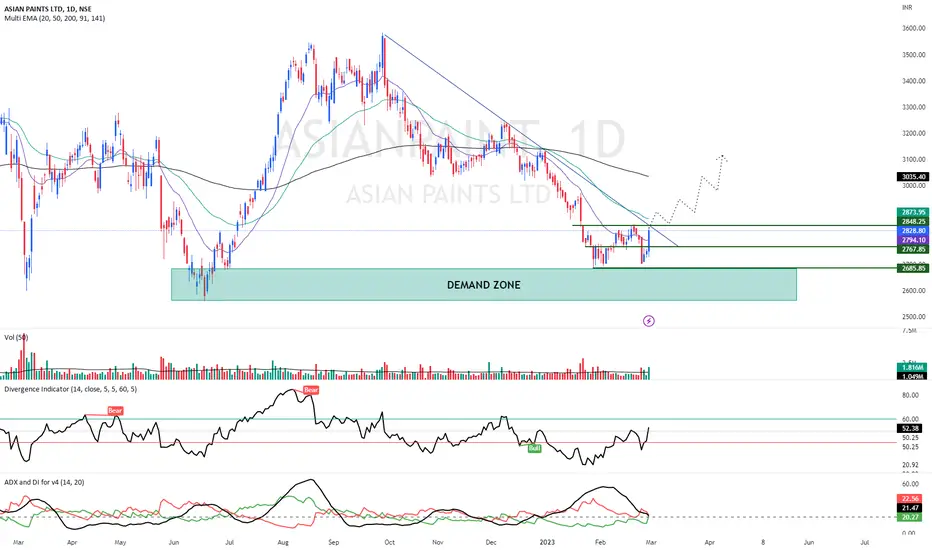
Asianpaints BullishAsianpaints Closing 2828.8 with stoploss 2770 then targets are 2890-3060-3150.
Buying Reason.
1 --> Price action is ready to break the #range.
2 --> #RSI is 52.38.
3 --> ADX is show the #Bullish move and +DMI is #RISE.
4 --> #Volume is also confirm the #Bullish move come in the some days.
5 --> Also On a #Monthly chart Price take #Support at #Bollinger #Band.
Relative Strength Index (RSI)
DEEPAKNTR BULLISHDEEPAKNTR closing 1812.05 with stoploss 1750 then targets are 1860-1900-1950+.
Buying Reason.
1 --> Price Bounce Back from the Strong Demand Zone.
2 --> RSI is also turn around from 40.
3 --> ADX is shwo the Bullish move and +DMI is rise.
4 --> 20 EMA is crossing then more up side open.
5 --> Volume is also show the Acclumation and there is the People Acclumate the Shares.
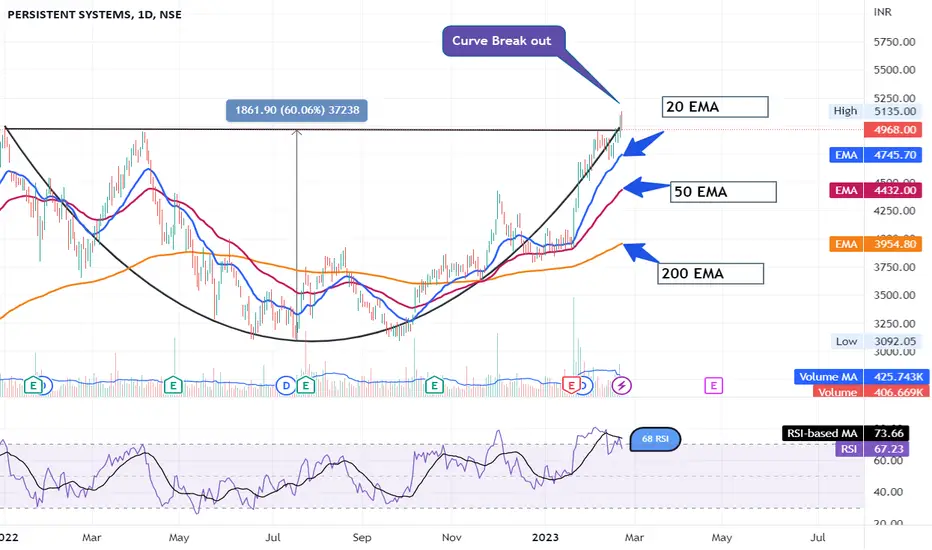
Persistant System - Bullish BreakoutKey Points:
- On daily chart strong Bullish breakout momentum seen with potential to rise from closing price of Rs. 4968
- 52 Week Resistance breakout @ 2873
- RSI near about 70
- Tech showing buy signals
- Price is above 20,50,200 EMA
Bhav is โ Bhagwan โ
Disclaimer :
I am not a SEBI registered Analyst.
Please do your own Analysis before taking any trade/investment.
The above view is just for educational purpose only.
Schaeffler India Ltd- Resistance BreakoutKey Points:
- On daily chart strong Bullish breakout momentum seen after down trend with potential of 12.50% rise from closing price of Rs. 2943
- Resistance breakout @ 2873
- RSI > 70
- Tech showing buy signals
- Price is above 20,50,200 EMA
- Volume is above VMA
Bhav is โ Bhagwan โ
Disclaimer :
I am not a SEBI registered Analyst.
Please do your own Analysis before taking any trade/investment.
The above view is just for educational purpose only
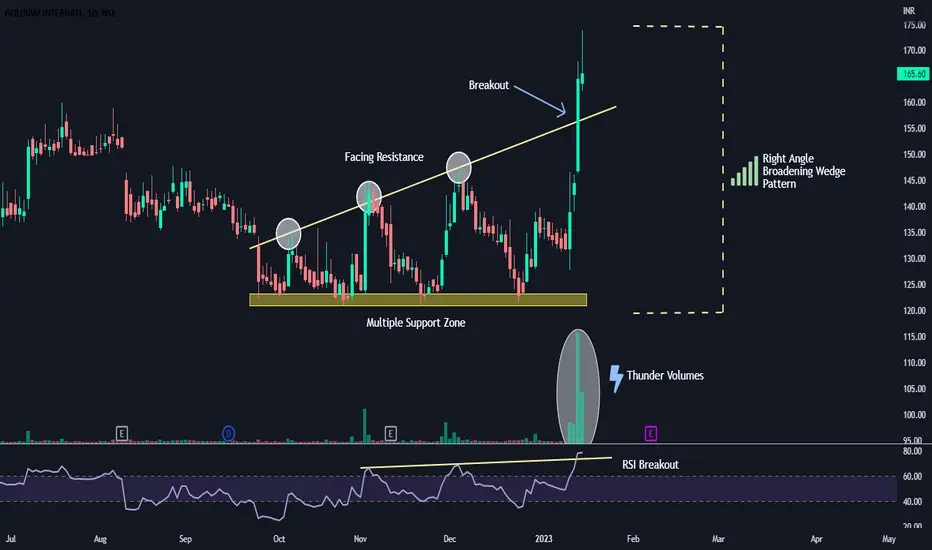
'GOLDIAM' ready to boom like 'GOLD' !!!We all have witnessed the bombastic rally of Gold & Silver, now it seems that companies
that are engaged in business related to gold & silver are going to buzz.
Let's have a detailed overview of the stock in prominent timeframes.
Daily Timeframe: -
Goldiam has shown a breakout from a right-angled broadening wedge pattern which
was under construction for the last 4 months.
Thunder Volumes supports the breakout. Also, there is an RSI breakout which indicates the strength
of the stock.
A
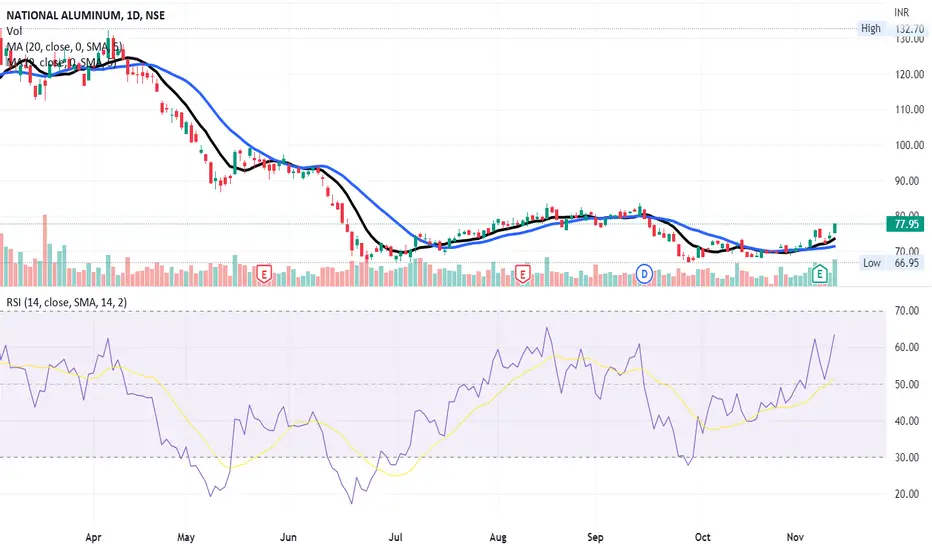
NATIONAL ALUMINIUM COMPANY LTD - SMA Crossover + Double Digit ๐ Script: NATIONALUM (NATIONAL ALUMINIUM COMPANY LIMITED)
๐ Nifty50 Stock: NO
๐ Sectoral Index: NIFTY 500 / NIFTY METAL / NIFTY MIDCAP
๐ Sector: Commodities - Metals & Mining
๐ Industry: Non - Ferrous Metals - Aluminium
Key highlights: ๐กโก
๐ Script is trading at upper band of Bollinger Bands (BB) and giving breakout of it.
๐ MACD is already giving crossover.
๐ Double Moving Averages also giving crossover.
๐ Volume is increasing along with price which is volume breakout.
๐ Current RSI is aroun
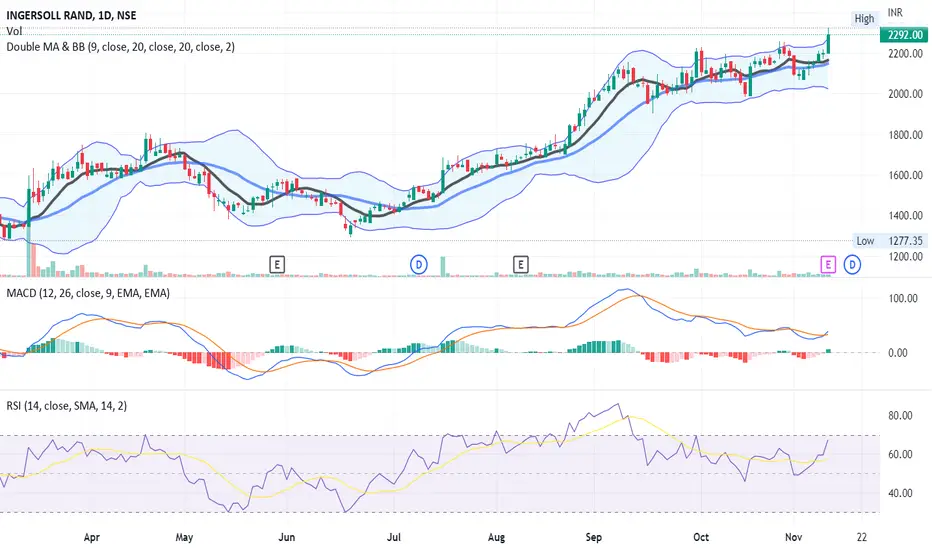
INGERSOLL RAND LTD - Multiple Indicator ๐ Script: INGERRAND (INGERSOLL RAND (INDIA) LIMITED)
๐ Nifty50 Stock: NO
๐ Sectoral Index: NIFTY INFRASTRUCTURE
๐ Sector: Industrials - Capital Goods
๐ Industry: Industrial Products - Compressors & Pumps
Key highlights: ๐กโก
I have used 4 indicators which is as follow:
1. Bollinger Bands (BB)
2. MACD
3. RSI
4. MOVING AVERAGE CROSSOVER
๐ Script is trading at upper band of Bollinger Bands (BB) and giving breakout of it.
๐ MACD is giving crossover.
๐ Double Moving Averages also giving crossove
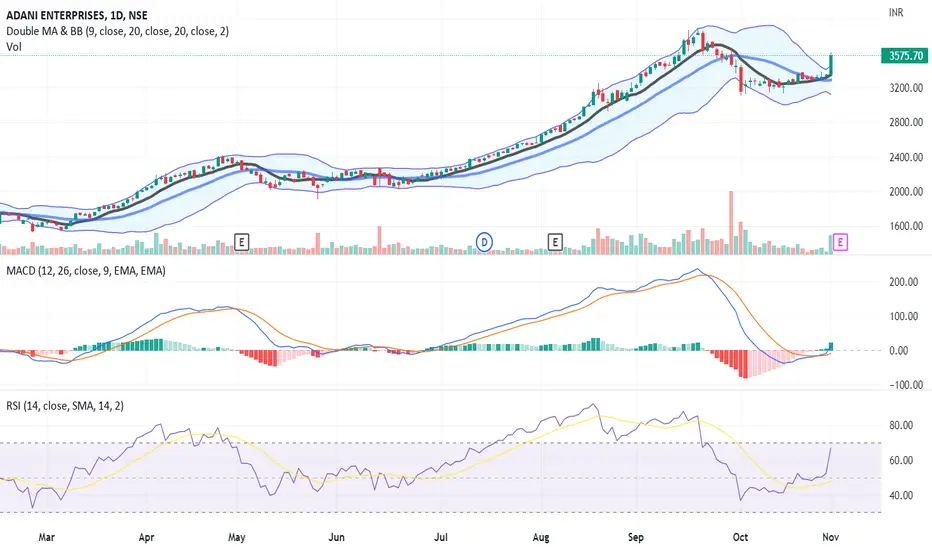
ADANI ENTERPRISES LIMITED - Volume Breakout + Bullish on Chart๐ Script: ADANIENT (ADANI ENTERPRISES LIMITED)
๐ Nifty50 Stock: NO
๐ Sectoral Index: NIFTY 500 / NIFTY METAL / NIFTY NEXT 50
๐ Sector: Commodities Metals & Mining
๐ Industry: Metals & Minerals Trading
Key highlights: ๐กโก
๐ Script is trading at upper band of Bollinger Bands (BB) and giving breakout of it.
๐ MACD is giving crossover.
๐ Double Moving Averages giving crossover.
๐ Volume is increasing along with price which is volume breakout.
๐ Current RSI is around 67.
๐ One can go for Swing Tr
Jubilant Pharmova Limited - Bullish on Chart๐ Script: JUBLPHARMA (JUBILANT PHARMOVA LIMITED)
๐ Nifty50 Stock: NO
๐ Sectoral Index: N/A
๐ Sector: Healthcare
๐ Industry: Pharmaceuticals
Key highlights: ๐กโก
๐ Script is trading at upper band of Bollinger Bands (BB) and giving breakout of it.
๐ MACD is giving crossover.
๐ Double Moving Averages also giving crossover.
๐ Volume is increasing along with price which is volume breakout.
๐ Current RSI is around 69.
๐ One can go for Swing Trade.
โฑ๏ธ C.M.P ๐๐ฐ- 370
๐ข Target ๐ฏ๐ - 450
โ ๏ธ Stoploss โ ๏ธ๐ซ
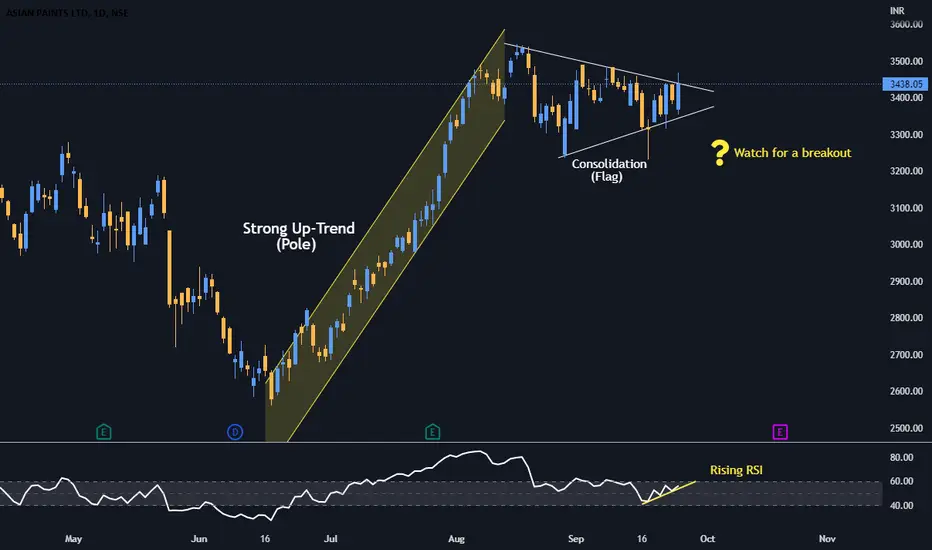
ASIAN 'PAINT' ready to break 'PENNANT' !!!ASIANPAINT is ready to breakout from a decent consolidation which was
under construction for more than 1 month.
It has formed a pennant pattern after a strong up move and now it seems that
the stock is ready to resume the up trend again.
The rising RSI further confirms the strength of the stock.
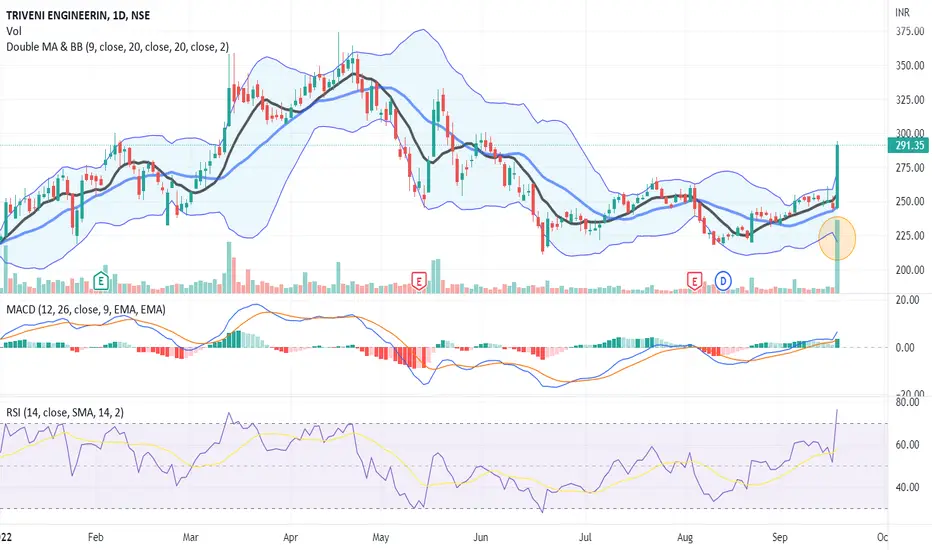
Triveni Engineering & Industries LTD - Multiple Indicators ๐ Script: TRIVENI (TRIVENI ENGINEERING & INDUSTRIES LIMITED)
๐ Nifty50 Stock: NO
๐ Sectoral Index: NIFTY500nif
๐ Sector: Fast Moving Consumer Goods
๐ Industry: Sugar / Agricultural Food & other Products
DAILY TIMEFRAME W PATTERN BREAKOUT
WEEKLY TIMEFRAME MACD CROSSOVER AND DOUBLE MOVING AVERAGE CROSSOVER SOON
Key highlights: ๐กโก
This stock pick is according to my study. I have use few indicator that is
BOLLINGER BAND
MACD
RSI
DOUBLE MOVING AVERAGE
VOLUME
๐ Script is trading at