The Market Broke The RuleFor years, traders have been taught a simple relationship: rising yields are bad for equities. Higher borrowing costs increase the discount rate applied to future earnings, financial conditions become tighter, and expensive growth assets can come under pressure. The relationship is real, but treating it as a mechanical rule is where the analysis starts to break down.
The recent market reaction provides a useful case study. U.S. Treasury yields moved sharply higher as inflation concerns, rising oil prices and changing expectations around monetary policy pushed the 10-year yield close to the 5% level. Yet equities were still able to rally rather than simply following the textbook relationship. That apparent contradiction is where the more interesting market analysis begins.
The Market Doesn't Trade One Variable in Isolation.
A higher yield can create pressure on equities, but the market is constantly weighing that pressure against everything else happening at the same time. Inflation expectations, economic growth, earnings expectations, oil prices, liquidity, positioning and expectations for central-bank policy can all influence the final reaction.
In this case, the inflation data did not deliver the kind of upside surprise investors had feared. Treasury yields pulled back from their highs, while equities responded positively as some of the immediate policy concerns eased. The important point is not that yields suddenly stopped mattering. It is that the market was responding to the entire change in expectations rather than simply reacting to the direction of one chart.
This Is Why Correlations Are Not Rules.
A relationship between two assets can be statistically meaningful without producing the same reaction every single time. When the dominant driver changes, the relationship can weaken, reverse or temporarily disappear.
If yields rise because growth expectations are improving, the market may interpret that very differently from a rise caused by accelerating inflation or fiscal concerns. The same percentage-point move in yields can therefore carry a completely different message depending on what is driving it.
Context Changes the Meaning of Price.
This is one of the most important distinctions between watching markets and actually analysing them. A trader who only sees “yields up” may immediately expect stocks to fall. A trader looking at the broader picture asks why yields are rising, what the market expected beforehand, what is happening to inflation, how oil is behaving, and whether equity earnings expectations are changing at the same time.
The direction of a variable matters. But the reason behind that direction often matters more.
The Rule Wasn't Really Broken.
The mistake was treating a relationship as a law.
Markets are interconnected, but they are not mechanical. The same input can produce different outcomes when the surrounding conditions change. That is why experienced market analysis focuses less on memorising relationships and more on understanding the forces competing to move price.
The next time you see a familiar correlation appear to fail, don't immediately assume the market is irrational. Start with a better question: what changed in the information the market is pricing?
Sometimes the market isn't breaking the rule.
We're just looking at the wrong rule.  Education
POLYCAB | Rectangle Breakout→Rising Wedge→Breakdown in ProgressOverview
POLYCAB has completed a textbook three-phase technical sequence on the Daily chart — a long-term Rectangle base, followed by a powerful breakout rally, and now a Rising Wedge breakdown that appears to be unfolding in real time.
Phase 1 — Rectangle Base (May 2024 to October 2025)
For approximately 17 months, POLYCAB consolidated inside a well-defined Rectangle pattern between roughly ₹4,500 and ₹7,700. Price tested both boundaries multiple times — classic accumulation behaviour with neither buyers nor sellers in full control.
Phase 2 — Rectangle Breakout & Rally
In October 2025, price broke out of the upper boundary of the Rectangle decisively. This triggered a powerful rally from the ₹7,700 breakout zone all the way to a high of ₹10,126 — a move of approximately 2,400 points or 31% from the breakout level.
During this rally phase, a Rising Wedge formed — two upward-sloping converging lines compressing price into a tightening structure.
Phase 3 — Rising Wedge Breakdown (Now)
The Rising Wedge is a bearish reversal pattern. Price tagged the wedge high at ₹10,126 and has since reversed sharply, breaking below the lower wedge boundary. Current price at ₹9,531 confirms the breakdown is in progress.
This is the most critical phase to watch right now.
Key Support Levels to Watch
🟢 Top Support — 9,294
🟢 Second Support — 8,794
🟢 Third Support — 8,294
🟢 Bottom Support — 7,737 (Rectangle breakout retest zone)
Each level represents a potential area where buyers may step in. The most important is ₹7,737 — the original rectangle breakout level. If price reaches here and holds, it would be a classic breakout retest — a strong buy zone for long-term traders.
Two Scenarios Going Forward
🔴 Scenario A — Wedge Breakdown Continues
Price continues declining through support levels toward ₹8,794 and ₹8,294. Watch for volume confirmation on each break. Ultimate target of the wedge breakdown measured from the wedge height points toward the ₹7,737 breakout zone.
🟢 Scenario B — Support Hold & Recovery
Price finds support at ₹9,294 and reclaims the wedge lower boundary. This would invalidate the breakdown and signal buyers are defending the structure. A close back above ₹9,750 would be the first confirmation.
What This Setup Teaches
After a strong breakout from a long base, markets often form a secondary pattern during the rally phase. A Rising Wedge within a bullish trend is a warning sign — it shows momentum weakening even as price makes higher highs.
The lesson: breakouts don't always go straight up. Patterns within the rally phase deserve equal attention.
Conclusion
POLYCAB has delivered a complete three-phase technical sequence. The Rectangle base gave the foundation. The breakout gave the rally. The Rising Wedge is now signalling a potential correction phase.
Watch the support levels closely — each one tells the next chapter of this story.
For educational purposes only. Not financial advice. Always manage your risk.  Short
Short
NIFTY Sellers Take Control After the Doji, Testing the 50 (W)EMAOverview
Nifty closed the week at 24,366, down 204.65 points or 0.83%. This follows directly from last week's doji at resistance, and the answer to "which side wins" has come in: sellers took control this week, with price rejecting from a high of 24,620.95 and closing near the Weekly 50 EMA (24,358.08).
Follow-up on Last Week's View
Last week we flagged a doji forming right at the resistance zone (24,601–24,989), a classic sign of indecision after a multi-week rally, with the next 1-2 candles expected to confirm direction. That confirmation has now arrived. Price failed to clear last week's high (24,774.30), and this week's red candle closed well below it, right on top of the Weekly 50 EMA. The Rising Wedge structure we've been tracking remains intact, and this week's price action leans toward the bearish resolution of that pattern.
Pattern Explanation
Nifty is now sitting almost exactly on the Weekly 50 EMA (24,358), a genuine make-or-break zone. Below this, the rising trendline support and Support 1 (23,817.80) are the next levels in line. The falling wedge resistance line above continues to cap every rally attempt, reinforcing the cautious read from last week.
Key Levels
Resistance Zone: 24,601.70–24,989.35
Weekly 50 EMA (current test zone): 24,358.08
Support 1: 23,817.80
Support 2 (Trendline): 23,611.00
Major Support: 23,070.15
Weekly 200 EMA: 22,291.99 (long-term trend remains up)
Scenarios
If Nifty closes next week below the 50 EMA (24,358), it would confirm sellers are in control, and price could slide toward the rising trendline support and 23,817–23,611 zone.
If Nifty reclaims 24,620 (this week's high) with strength, it would suggest the pullback was shallow, and buyers could make another attempt at the 24,774–24,989 resistance zone.
Beginner's Lesson
A doji at resistance is a warning sign, not a guarantee, and this week is a good example of why we wait for the next candle rather than acting on the doji alone. Once the follow-through candle closes clearly in one direction, especially a strong red candle like this week's, it adds real weight to the case that sellers have taken the upper hand, at least for now. The 50 EMA test that follows is the next confirmation point to watch.
Conclusion
Nifty's doji hesitation resolved bearish this week, with price now testing the Weekly 50 EMA directly. A close below this zone would tilt the bias toward the rising trendline support near 23,817–23,611. A recovery back above 24,620 would keep the broader uptrend structure alive. This remains a level-to-level market, with the current test at the 50 EMA the key thing to watch into next week.
This is for educational purposes only and not investment advice. Please do your own research or consult a financial advisor before making any trading decisions. NIFTY Weekly View — Weekly Support Holds at 24,025Overview
Nifty closed the week at 24,252.00, down 114 points or 0.47%, extending last week's bearish follow-through. Price dipped to test Weekly Support near 24,025 and closed well above it by week's end.
Follow-up on Last Week's View
Last week we flagged sellers taking control after the doji at resistance, with price testing the Weekly 50 EMA (24,358) as the key level. That test resolved bearish, price closed below the 50 EMA this week, confirming sellers had the upper hand. This week, that follow-through carried price down to test the next major support level.
Pattern Explanation
This week's low of 24,025.65 tested the Weekly Support level (24,025) almost exactly, and price recovered to close at 24,252, well above the low. The Rising Wedge structure we've been tracking remains intact, with the falling dotted resistance line above continuing to cap rallies. Resistance 1 (24,360, near the Weekly 50 EMA) and Resistance 2 (24,601.70) remain the levels to reclaim for any bullish case to build. The rising Trendline Support below is also gradually approaching current price levels and will be an important zone to watch in the coming weeks.
Key Levels
Resistance 2: 24,601.70
Resistance 1 / Weekly 50 EMA: 24,360 / 24,353.66
Weekly Support: 24,025
Support 2: 23,818.00
Support 3 (Trendline): 23,611.00
Major Support: 23,070.15
Scenarios
Bullish: If Nifty holds above Weekly Support (24,025) and reclaims 24,360 (Resistance 1 / 50 EMA) with strength, it would suggest the pullback is done, opening the door for another attempt at 24,601 and the wedge resistance above.
Bearish: If Nifty comes back down and closes below 24,025, it would be a meaningful break, and price could slide toward Support 2 (23,818) and Support 3 (23,611).
Beginner's Lesson
A well-established support level, like the one tested this week, often holds on its first few tests, especially if it's been respected before. Price dipping into a support zone and closing back above it by the end of the week is a healthy sign, it shows buyers stepped in exactly where expected. Watching whether this level continues to hold on future tests, especially as other levels like trendlines converge nearby, gives a clearer picture of how strong the support really is.
Conclusion
Nifty tested and held Weekly Support at 24,025 this week. Holding this zone with a reclaim of 24,360 would favor buyers again. A future close below 24,025 would tilt the bias bearish toward 23,818 and 23,611. This remains a level-to-level market, with this week's successful support test being an encouraging sign for the bulls, at least for now.
This is for educational purposes only and not investment advice. Please do your own research or consult a financial advisor before making any trading decisions. Gold Under Hyper-Contraction Just Before a Major ExpansionProbable Scenario Analysis:
⏺ Present Scenario:
Presently, Gold TVC:GOLD is in a hyper-contraction phase. There are two visible contraction chart patterns observable in the chart. The first pattern is a head-and-shoulder (H&S) pattern. The second pattern is a rising parallel channel. Technically, gold is flat and making too random moves. There is no trend confirmation yet.
🟢 Bullish Scenario
There is no bullish scenario. Doubt every upmove. However, if the price decisively sustains above 4425, then a bullish setup might emerge. The probable bullish target above 4425 would be - 4450.
🔴 Bearish Scenario
Gold has entered into the shorting zone. If we look at the rising parallel channel, we can see that the price is trading within the lower control limit (LCL) of the channel. It is a sign of weakness. Also, there is a probable formation of an H&S pattern. Stay bearish below 4400. The probable targets below 4400 would be - 4375, 4350, 4325, and 4300.
🟡 No Trading Zone: (4425 - 4400).
● Intraday, Weekly, and Monthly Bias
Establish bias with respect to the opening price (of the particular session - Intraday, Weekly, and Monthly). If the price sustains above the opening price, then don't think of shorting. Look for bullish trades only. On the contrary, if the price sustains below the opening price, then don't think of going long. Look for bearish trades in that case.
● Disclaimer + End Note
- All the analyses would fail in the case of a major gap up, gap down, or price structure anomaly. Thus, practice PRAGMATISM in the live session.
- Trade only if there is a set-up. Remember, not trading is an extension of the trading activity.
- Mark your points. Trade your points. Price is GOD. Anything can happen in the markets. Thus, trade what you see, not what you believe.
- Always PRACTICE RISK MANAGEMENT. Always PROTECT YOUR CAPITAL. Be RESPONSIBLE.
- Be Strategic. Be Courageous. Be Patient. Be Wise.
- Every day is a new day. Thus, do not carry the baggage of past successes or failures. Leave the gardens of winning and losing. Establish yourself in equanimity. Always think from a new perspective.
- Let the joy of trading drive your effectiveness, not greed or fear. Believe in Possibilities.
Happy Trading! TVSMOTOR Rising Wedge Recovery Strong Q1 FY27 Earnings📊 TVS Motor Company: Daily Technical Snapshot – Rising Wedge Recovery & Strong Q1 FY27 Earnings
📊 STWP Technical Analysis
________________________________________
MARKET STRUCTURE SNAPSHOT | NSE: TVSMOTOR | DAILY
Closing Price: 3,792.00 (+201.80 | +5.62%)
Core Trend: Strong Uptrend
Market State: Recovery Within Uptrend
Price Structure: Price has rebounded strongly after forming a Bullish Engulfing near the rising support trendline and is now attempting to break above the descending resistance of a Rising Wedge consolidation. The recovery is supported by improving momentum, healthy volume participation and strong quarterly earnings.
________________________________________
OPERATIONAL PRICE GRID & KEY REFERENCE LEVELS
Model Reference Level: 3,810.00
Hard Invalidation Level: 3,260.70
Structural Risk: 549.30 (14.42%)
Resistance Levels: R1 3,875.73 | R2 3,959.47 | R3 4,108.93
Support Levels: S1 3,642.53 | S2 3,493.07 | S3 3,409.33
Range Structure: Low 3,260.70 | High 4,108.93
Higher Timeframe Observation Zones: 3,960 | 4,109 | 4,250
________________________________________
🏢 BUSINESS & FUNDAMENTAL UPDATE
TVS Motor reported a strong Q1 FY27 performance, exceeding market expectations across revenue, profitability and margins. Standalone revenue increased 38% YoY to 13,896 crore, while net profit rose 51% YoY to a record 1,174 crore. EBITDA grew 41%, with margins expanding to 12.8%, despite concerns over rising input costs and a higher EV mix. The company also recorded its highest-ever quarterly vehicle sales of 1.63 million units, driven by robust growth across motorcycles, scooters, exports and electric vehicles, with EV sales surging 86% YoY. The Board also declared plans to raise up to 1,000 crore through debt instruments. The stronger-than-expected earnings, improving margins and record sales provided a positive fundamental backdrop to the stock's ongoing technical recovery and trendline breakout attempt.
________________________________________
⚠️ MOMENTUM, PARTICIPATION & CPR DATA
Volume Profile: 2.39 Million Shares
Volume Character: Strong Relative Participation
RSI: 65.36 (Strong Momentum Zone)
ADX: 18.85 (Trend Strength Improving)
ROC: +2.14%
MACD Status: Fresh Bullish Crossover
CCI: +127.60 (Positive Momentum)
Stochastic Reading: 93.64 (Extended Momentum Zone)
Current Bias: BUY ON PULLBACKS AFTER BREAKOUT CONFIRMATION
CPR State: Bullish Zone | CPR Moving Down (Narrow)
Today's CPR: Pivot 3,586.70 | Top 3,588.40 | Base 3,584.90
Tomorrow's CPR (Projected): Pivot 3,726.30 | Top 3,759.10 | Base 3,693.40
________________________________________
📚 EDUCATIONAL OBSERVATION
TVS Motor has staged a strong recovery after forming a Bullish Engulfing candlestick near the lower boundary of its rising support trendline. The stock is now testing the upper boundary of a Rising Wedge consolidation, signalling that buyers have regained control following a brief corrective phase. The recent price action indicates that selling pressure has gradually weakened while demand has improved near key support levels. The strong bullish candle, combined with improving momentum indicators, reflects renewed buying interest. However, the trendline breakout is still in progress, and confirmation would require sustained trading above the wedge resistance, preferably supported by stronger-than-average trading volume.
Momentum indicators continue to improve. The RSI at 65.36 reflects healthy bullish momentum without entering an extreme overbought zone. MACD has generated a fresh bullish crossover, suggesting strengthening upside momentum, while the ROC of +2.14% indicates improving price acceleration. The CCI reading of +127.60 confirms positive buying momentum, and the Stochastic reading of 93.64 highlights sustained participation. While momentum remains constructive, elevated readings may also result in short-term consolidations after a sharp advance. The projected Central Pivot Range (CPR) for the next trading session has shifted higher, with the projected Pivot at 3,726.30. A higher CPR reflects improving market acceptance of higher prices and supports the prevailing bullish structure as long as prices remain above key support levels. Immediate attention remains focused on the resistance zone between 3,876 and 3,959, which also coincides with the upper boundary of the Rising Wedge. A decisive close above this region, supported by improving participation, would confirm the breakout and could shift attention towards the higher-timeframe observation zones near 4,109 and 4,250. On the downside, 3,643 remains the first important support, while the structural invalidation level is positioned near 3,261.
________________________________________
📖 Educational Note
The combination of strong quarterly earnings, record vehicle sales, margin expansion, and a technical recovery within a Rising Wedge provides a constructive backdrop for the stock. However, from a technical perspective, the current setup will be considered fully confirmed only if price sustains above the wedge resistance with continued participation. Support and resistance levels should be treated as observation zones rather than predictive targets. Technical analysis and financial results are educational tools that help investors evaluate market structure and business performance within a disciplined risk-management framework.
________________________________________
Disclaimer
This analysis is provided strictly for educational and informational purposes.
It does not constitute financial, investment or trading advice and should not be interpreted as a recommendation to buy or sell any security. Investments in the stock market are subject to market risks, including the possible loss of capital. Historical performance, financial results, chart patterns and technical indicators do not guarantee future outcomes. Please conduct your own research and consult a SEBI-registered investment adviser before making investment decisions. STWP assumes no responsibility or liability for any financial loss arising directly or indirectly from the use of this analysis.
 Long
Long
 Short
Short
 Short
Short
 Short
Short
 Short
Short
 Long
Long
Bank nifty Rising wedge pattern.Pattern Analysis
Rising Wedge Pattern:
A bearish pattern typically seen near tops. It shows narrowing price movement with higher highs but declining momentum.
Breakdown confirmed as price has fallen below the lower wedge support trendline.
Confirms selling pressure and rejection from the top near 57,300–57,500 zone.
🕯️ Candlestick Signals
Dark Cloud Cover:
A bearish reversal pattern indicating sellers have taken control after a bullish phase.
Big Red Candle + ‘M’ Pattern:
Bearish engulfing at resistance – strong indication of a top formation.
3 Inside Down Candlestick Pattern at Resistance:
Recent red candles have higher volume, confirming institutional selling activity.
As anticipated in our previous analysis, Bank Nifty corrected from the 57,000 level to 56,056, validating the bearish setup.
It is also expected to short here 56,550 add on any rise up to 57,700-57,950 for target mentioned on chart.
Alternative Scenario: Be aware that the rising wedge could potentially break upwards. If the price breaks decisively above the resistance trendline with strong volume, the bearish outlook would be invalidated.
Short 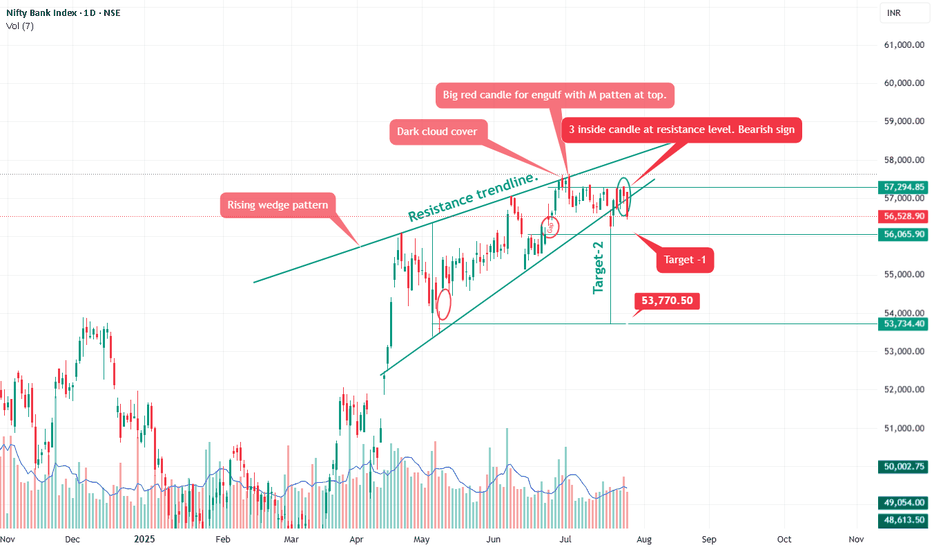
 Short
Short
M&M _ Rising Wedge Formation📊 M&M – Technical & Educational Snapshot
Ticker: NSE: M&M | Sector: 🚙 Auto
CMP: ₹2,7XX (as of 16 Aug 2025)
Rating (for learning purpose): ⭐⭐⭐⭐
Pattern Observed: 📉 Rising Wedge Formation (Bearish Reversal Case Study)
🔑 Key Reference Levels (For Learning)
Support / Breakdown Zone: Lower wedge trendline
Resistance / Rejection Zone: Upper wedge trendline
Bearish Projection (Case Study): ~₹2,410
Bullish Continuation (Alternative View): ~₹3,300
📌 Pattern Observations
✅ Price forming higher highs & higher lows but within converging trendlines
✅ Momentum slowing → smaller swings inside wedge
✅ Typical bearish reversal structure (confirmation needed)
✅ Volume + RSI divergence can add conviction
📝 STWP Trade Analysis (Educational Illustration Only)
1️⃣ Bearish Breakdown (Primary Scenario)
Observation: Breakdown below wedge support often studied as bearish signal
Stop Loss (Learning Reference): Above upper wedge / recent swing high
Downside potential: ₹2,410 (measured move projection)
2️⃣ Bullish Breakout (Alternative Scenario)
Observation: Breakout above wedge resistance may lead to continuation
Stop Loss (Learning Reference): Below wedge / recent swing low
Upside potential: ₹3,300
📊 Risk Management & Confirmation
Traders typically wait for daily close outside wedge boundaries
Volume confirmation is key → spikes above average strengthen the move
RSI divergence often adds confidence to the setup
📌 Summary (Learning View Only)
The M&M Rising Wedge is a classic reversal study.
Key lesson: A wedge pattern teaches how slowing momentum can shift market control — but confirmation with volume + price close is essential before validating either direction.
⚠️ Disclaimer – Please Read Carefully
The information shared here is meant purely for learning and awareness. It is not a buy or sell recommendation and should not be taken as investment advice. I am not a SEBI-registered investment advisor, and all views expressed are based on personal study, chart patterns, and publicly available market data.
Trading — whether in stocks or options — carries risk. Markets can move unexpectedly, and losses can sometimes be larger than the money you have invested. Past performance or past setups do not guarantee future results.
If you are a beginner, treat this as a guide to understand how the market works — practice on paper trades before risking real money. If you are an experienced trader, remember to assess your own risk, position sizing, and strategy suitability before entering any trade.
Consult a SEBI-registered financial advisor before making any real trading decision.
By reading, watching, or engaging with this content, you acknowledge that you take full responsibility for your own trades and investments.
________________________________________
💬 Found this useful?
🔼 Give this post a Boost to help more traders discover clean, structured learning.
✍️ Drop your thoughts, questions, or setups in the comments — let’s grow together!
🔁 Share with fellow traders and beginners to spread awareness.
✅ Follow simpletradewithpatience for beginner-friendly setups, price action insights & disciplined trading content.
🚀 Stay Calm. Stay Clean. Trade With Patience.
Trade Smart | Learn Zones | Be Self-Reliant 📊  Short
Short
Rising Wedge Breakdown — 54,252 in Sight?#BankNifty View:
CMP: 56,528
BankNifty has broken down from a Rising Wedge pattern — a bearish signal. After a brief retest of the breakdown level, price has resumed its downward move. Daily close below 56,205 will gather fresh momentum.
🔑 A daily close below 56,205 could trigger fresh downside momentum.
🔻 Support Zones:
• 56,283 – 56,080
• 55,580 – 55,530
• 🔑 Key Supports: 54,470 – 54,375 & 53,600 – 53,580
🔺 Resistance Zone:
• 57,312 – 57,365
🎯 Pattern Target: 54,252
This aligns with the key support zone at 54,470 – 54,375 , strengthening its significance.
📌 Disclaimer: This analysis is shared for educational purposes only. It is not a buy/sell recommendation. Please do your own research before making any trading decisions.
#TechnicalAnalysis | #PriceAction | #RisingWedge | #ChartPatterns Short 
 Short
Short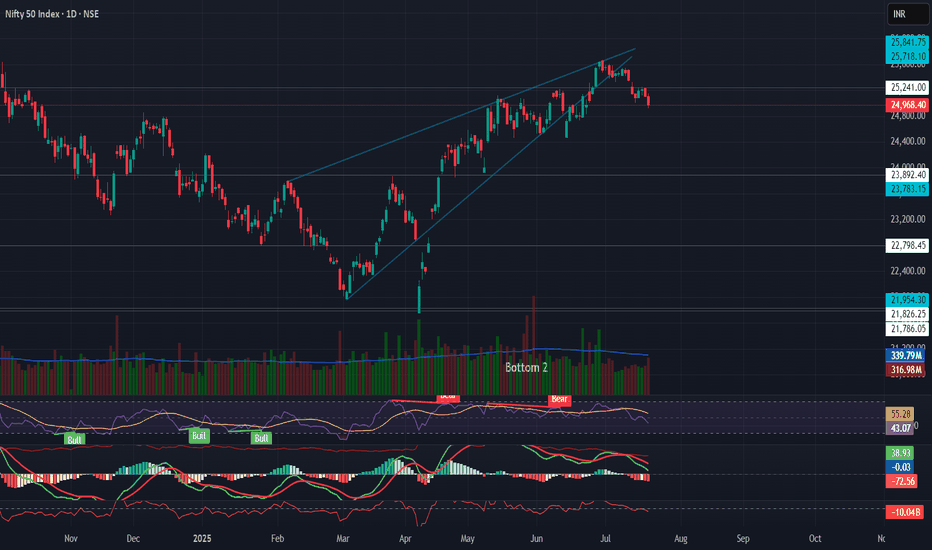
Bank nifty correction start now?Bank Nifty
Current Price: 56,791.95 (Spot)
Bank Nifty has reversed lower from the resistance trendline, confirming selling pressure near higher levels.
A Dark Cloud Cover candlestick pattern combined with an emerging M-top formation indicates potential short-term bearish sentiment.
It can short here or any bounce use as shorting opportunity for target 56,056
Major resistance is 57,400-57,700
The index is forming a rising wedge pattern, a bearish structure suggesting potential for deeper correction if key support levels are breached.
Key Support Levels:
Immediate support is identified at 56,056 (trendline support).
A decisive close below 56,056 may accelerate selling pressure, opening downside targets toward: 55,342 , 53,908
Short 
CAMS – Rising Wedge in Focus ________________________________________________________________________________
📈 CAMS – Rising Wedge in Focus
🕒 Chart Type: Daily
________________________________________________________________________________
What’s Catching Our Eye:
CAMS is forming a Rising Wedge, a technical structure that often leads to strong directional moves. The price is nearing the upper boundary of the wedge, indicating possible breakout or reversal. This contraction in range is typically followed by expansion — and smart traders are watching closely.
________________________________________________________________________________
What We’re Watching For:
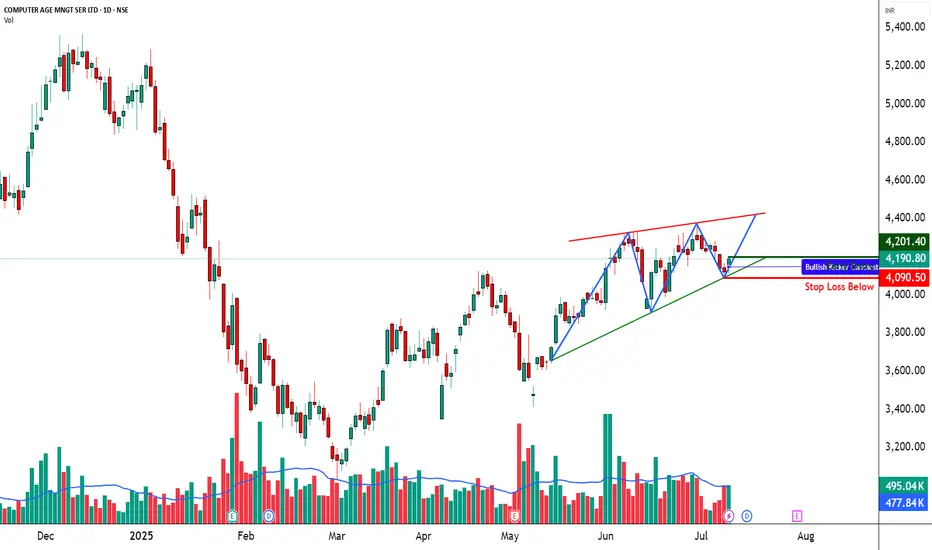
Price holding above ₹4201.40 could trigger interest from early participants. On the flip side, a breakdown below ₹4090.50 may signal failure of the wedge structure. For more confirmation-driven entries, one may wait for a proper breakout or breakdown candle with volume.
________________________________________________________________________________
Volume Footprint Analysis:
As expected in wedge formations, volume has compressed. A breakout supported by volume expansion could validate the move and offer confidence in continuation. Volume is the key trigger to watch once the wedge resolves.
________________________________________________________________________________ Option Structure Insight:
For educational purposes, one could observe a neutral hedge approach using options:
– Buy 4200 CE
– Buy 4100 PE
This can potentially help capture a sharp move in either direction. Once the move confirms, the opposite leg can be exited to ride the trend with managed risk.
Price Action Logic:
Rising wedge formations typically form after a directional up-move and narrow into a tightening range. This is often followed by an impulsive expansion phase. CAMS is showing that exact setup. The price is sandwiched between key resistance at ₹4200+ and demand near ₹3880.
________________________________________________________________________________
💼 Sector Tailwinds:
CAMS, operating within the mutual fund RTA space, benefits from India's rising retail participation and SIP growth. The digitalisation of mutual fund flows, compliance demand, and data-based services lend long-term support to this sector. These factors offer fundamental strength to this technical setup.
________________________________________________________________________________
⚠️ Risks to Watch:
– A close below ₹4085 could invalidate the bullish wedge setup
– Current price behavior reflects compression, but indicators like Stochastic may suggest near-term overbought conditions
– Avoid chasing — wait for confirmation via breakout + volume or a proper retest candle
– Do not over-leverage in a low-volume wedge structure — focus on proper R:R and sizing
________________________________________________________________________________
🔮 What to Expect Next:
If the wedge breaks upward and sustains above ₹4201.40 with volume, price expansion may be observed toward ₹4330–₹4450 zone. On the downside, a breakdown below ₹4090.50 may trigger a move toward the ₹3950–₹3880 support cluster. Watch for confirmation in the next 2–3 sessions before taking directional exposure.
________________________________________________________________________________
🧠 How to Trade CAMS (For Educational Use Only):
🔹 Breakout Trade Plan
• Entry: Above ₹4201.40
• Stop Loss: Below ₹4090.50 (closing basis preferred)
• Pullback Entry: If price returns to ₹4095–₹4105 zone and shows bounce confirmation
• Risk-Reward: Start with 1:1, trail for 1:2+
• Position Sizing: Based on risk, never overexpose in a wedge
🔹 Options Strategy (Educational View)
• Buy CAMS 4200 CE
• Buy CAMS 4100 PE
• Exit the losing leg once direction confirms with price + volume breakout
________________________________________________________________________________
📍 Levels to Keep an Eye On:
The first key level to observe is ₹4201.40 — a break above this may attract early interest from aggressive participants as it represents the upper boundary of the rising wedge. On the downside, ₹4090.50 acts as the breakdown level; if breached, it could suggest structural weakness and a potential shift in trend.
In case of an upward breakout, we are closely monitoring the ₹4330–₹4450 zone as a possible price expansion area. If the breakdown plays out instead, the ₹3950–₹3880 zone becomes important as a potential reaction area or demand test.
Historically, the ₹3880–₹3950 range has shown signs of buyer interest and may act as a demand zone if retested. On the upside, ₹4320–₹4400 has acted as supply in the past and could present resistance if the price extends higher.
A close below ₹4085 would invalidate the bullish wedge structure and may require a reassessment of directional bias.
________________________________________________________________________________
⚠️ Disclaimer (Please Read):
• This chart is shared for educational purposes only and is not investment advice.
• I am not a SEBI-registered advisor.
• The information provided here is based on personal market observation.
• No buy/sell recommendations are being made.
• Please do your own research or consult a registered financial advisor before making any trading decisions.
• Trading involves risk. Always use proper risk management.
________________________________________________________________________________
💬 Found this helpful?
How would you prefer to approach this — breakout entry or pullback into zone?
Drop your thoughts or questions in the comments below ⬇️
🔁 Share this post with your trading community.
✅ Follow @SimpleTradeWithPatience for price-action backed technical setups.
🚀 Let’s trade with patience, logic, and clarity!
Be Self-Reliant | Trade with Patience | Learn with Logic
________________________________________________________________________________ Short 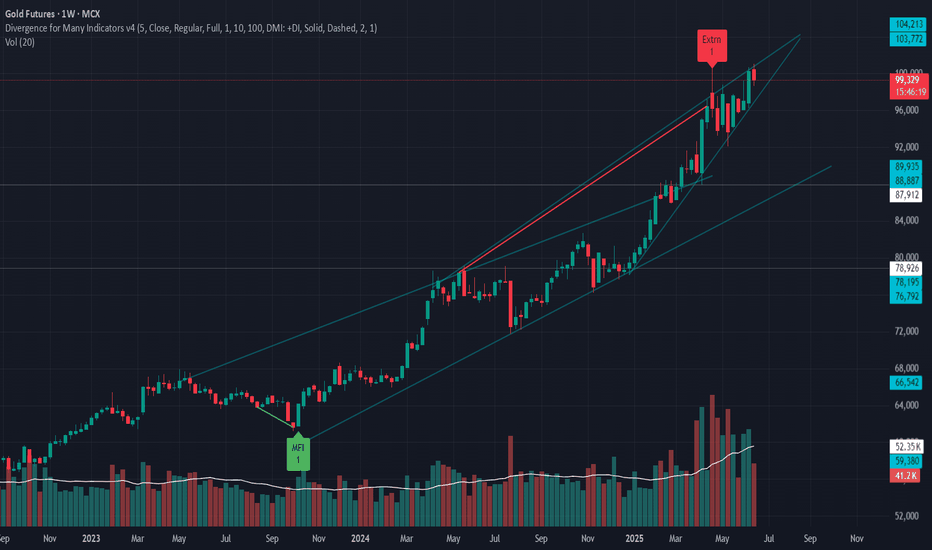
MGL: Rising Wedge Breakout Sets Stage for Explosive RallyNSE:MGL : Rising Wedge Breakout Sets Stage for Explosive Rally after management guidance of double-digit volume growth for the next three to four years.
Price Action Analysis:
• Stock has formed a classic Rising Wedge pattern from November 2024 lows around 1,075 to current levels near 1,433
• The wedge shows converging trendlines with higher highs and higher lows, typical of consolidation before a breakout
• Recent breakout above the upper trendline around 1,400 levels confirms bullish momentum
• Price has rallied 33% from the wedge base, indicating strong underlying demand
Volume Spread Analysis:
• Volume spikes are visible during key breakout moments, particularly in recent sessions
• Higher volume on up days compared to down days suggests institutional accumulation
• Volume expansion during the wedge breakout confirms genuine buying interest
• Recent green volume bars indicate sustained buying pressure supporting the uptrend
Key Technical Levels:
Support Levels:
• Immediate support at 1,380-1,400 (previous resistance turned support)
• Secondary support at 1,300 (middle of the rising wedge)
• Major support at 1,200-1,250 (lower trendline of the wedge)
• Critical support at 1,075 (November 2024 lows)
Resistance Levels:
• Immediate resistance at 1,450-1,470 (psychological levels)
• Next resistance at 1,500 (round number resistance)
• Extended target at 1,600-1,650 based on wedge height projection
• 52-Week high resistance around 1,988 (historical peak)
Technical Patterns:
• Rising Wedge pattern near to completion with successful breakout
• Multiple higher highs and higher lows confirming uptrend structure
• Potential cup and handle formation on longer timeframes
• Bullish flag consolidation patterns within the broader uptrend
Trade Setup:
Entry Strategy:
• Primary entry on pullback to 1,400-1,420 levels (retest of breakout zone)
• Aggressive entry at the current market price of around 1,433 for momentum players
• Scale-in approach: 50% at 1,420, 25% at 1,380, 25% at 1,350
Exit Levels:
• First target: 1,500 (16% upside from current levels)
• Second target: 1,600 (22% upside potential)
• Extended target: 1,700-1,750 for long-term holders
• Trailing stop-loss strategy recommended above 1,500 levels
Stop-Loss Placement:
• Conservative stop-loss: 1,320 (below wedge support)
• Aggressive stop-loss: 1,380 (below immediate support)
• Risk-reward ratio of 1:2 to 1:3 depending on entry and exit points
Position Sizing and Risk Management:
• Allocate a maximum of 2-3% of the portfolio to a single position
• Use a 1% risk per trade rule based on stop-loss distance
• Consider partial profit booking at 1,500 levels
• Maintain position size discipline to avoid overexposure
Sectoral and Fundamental Backdrop:
Sector Analysis:
• City Gas Distribution (CGD) sector showing resilience amid energy transition
• The government push for clean fuel adoption, supporting the natural gas demand
• Infrastructure expansion in tier-2 and tier-3 cities benefiting CGD companies
• Regulatory environment remains supportive with steady tariff mechanisms
Fundamental Strengths:
• NSE:MGL operates in prime Mumbai and adjoining areas with stable demand
• Strong cash flows from residential and industrial customer base
• Consistent dividend-paying track record with healthy payout ratios
• Robust balance sheet with minimal debt and strong return on equity
• Expanding PNG and CNG network, providing growth visibility
Key Catalysts:
• Increasing vehicle conversion to CNG, supporting volume growth
• Industrial demand recovery post-pandemic is driving commercial sales
• Government policies favouring cleaner fuel alternatives
• Potential for geographical expansion into new license areas
Risk Factors:
• Crude oil price volatility is affecting input costs
• Competition from electric vehicles in the transportation segment
• Regulatory changes in gas pricing mechanisms
• Economic slowdown impacting industrial demand
My Take:
The technical setup suggests NSE:MGL is well-positioned for continued upward momentum following the rising wedge breakout. The combination of strong fundamentals, supportive sector dynamics, and bullish technical patterns creates an attractive risk-reward proposition for both swing and positional traders. However, traders should remain disciplined with position sizing and risk management given the stock's premium valuation at current levels.
Keep in the Watchlist.
NO RECO. For Buy/Sell.
📌Thank you for exploring my idea! I hope you found it valuable.
🙏FOLLOW for more
👍BOOST if you found it useful.
✍️COMMENT below with your views.
Meanwhile, check out my other stock ideas on the right side until this trade is activated. I would love your feedback.
Disclaimer: "I am not a SEBI REGISTERED RESEARCH ANALYST AND INVESTMENT ADVISER."
This analysis is intended solely for informational and educational purposes and should not be interpreted as financial advice. It is advisable to consult a qualified financial advisor or conduct thorough research before making investment decisions.  Long
Long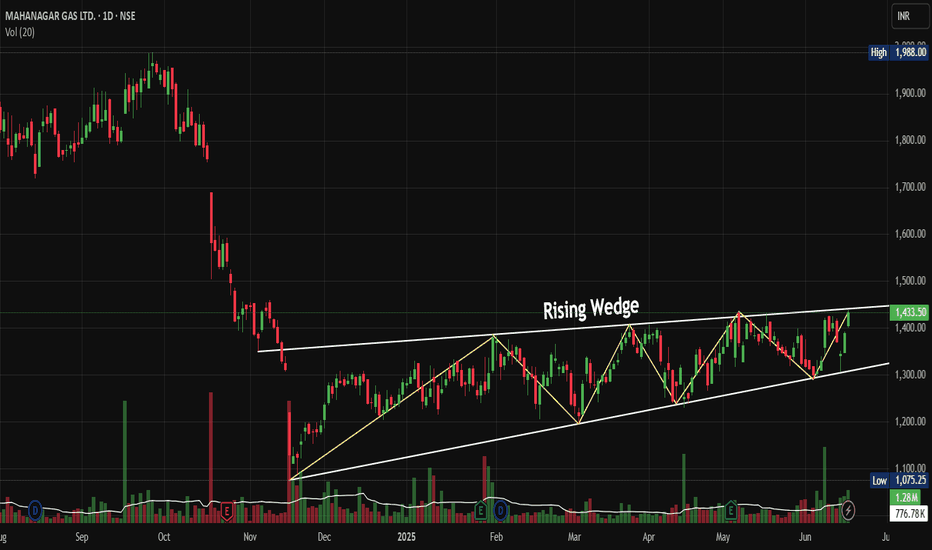
Emudhra Watchlist StockEmudhra's Triangle Breakout Drama: Why This Digital Security Stock Could Rally 15% from Current Levels
Price Action:
Looking at Emudhra's daily chart, we're witnessing a textbook technical setup that could offer substantial rewards for patient traders. The stock has been consolidating in a well-defined triangle pattern since late April, with price action compressed between converging trend lines around 720-780 levels.
The current price action shows Emudhra testing the upper boundary of this Wedge formation at approximately 775-780 resistance zone. What's particularly interesting is how the stock has maintained its position above the key psychological level of 750, suggesting underlying strength despite the recent market volatility.
Volume Action:
From a volume perspective, we've seen relatively subdued activity during this consolidation phase, which is typical behaviour within triangle patterns. However, any breakout above 780 with accompanying volume surge would validate the bullish continuation thesis.
The base formation here spans roughly 6-8 weeks, providing sufficient time for weak hands to exit and strong accumulation to occur. Support levels are clearly defined at 720 (triangle lower boundary) and 700 (psychological support), while immediate resistance sits at 780, followed by the major level at 880.
The triangle pattern, combined with the stock's position above key moving averages, suggests a potential measured move target of around 850-870 levels, representing approximately 10-15% upside from current levels.
Trade Setup:
Entry: 782-785 on breakout with volume confirmation
Target 1: 820 (initial resistance)
Target 2: 850-870 (measured move target)
Stop Loss: 750 (below triangle support)
Risk-Reward Ratio: Approximately 1:2.5
Risk management is crucial here - the stop loss at 750 provides a reasonable buffer while maintaining favourable risk-reward dynamics. Traders should wait for a decisive breakout above 780 with at least 50% higher than average volume to confirm the pattern completion.
Sectoral Backdrop:
The digital security and cybersecurity sector has been gaining traction globally, with increasing digitization post-pandemic driving demand for authentication and security solutions. Emudhra operates in the digital trust space, providing digital signature solutions and PKI services, which positions it well for the ongoing digital transformation wave.
Fundamental Backdrop:
While technical analysis drives this setup, Emudhra's business fundamentals appear supportive, with the company's focus on digital identity solutions aligning with government initiatives like Digital India. The increasing adoption of digital signatures across various sectors provides a favourable operating environment for sustained growth.
Risk Factors:
Technical Risks:
- False breakout possibility if volume doesn't support the move
- A broader market correction could invalidate the pattern
- Failure to hold 750 support would signal a pattern failure
Fundamental Risks:
- Intense competition in the digital security space
- Regulatory changes affecting the business model
- Economic slowdown impacting enterprise spending
- Technology disruption in authentication methods
My Take:
The key catalyst to watch would be any major contract announcements or regulatory developments that could trigger the breakout. Given the tight consolidation and technical setup, this stock deserves a spot on active traders' watchlists for the coming weeks.
Keep in the Watchlist.
NO RECO. For Buy/Sell.
📌Thank you for exploring my idea! I hope you found it valuable.
🙏FOLLOW for more
👍BOOST if you found it useful.
✍️COMMENT below with your views.
Meanwhile, check out my other stock ideas on the right side until this trade is activated. I would love your feedback.
Disclaimer: "I am not a SEBI REGISTERED RESEARCH ANALYST AND INVESTMENT ADVISER."
This analysis is intended solely for informational and educational purposes and should not be interpreted as financial advice. It is advisable to consult a qualified financial advisor or conduct thorough research before making investment decisions.