
Rising Wedge
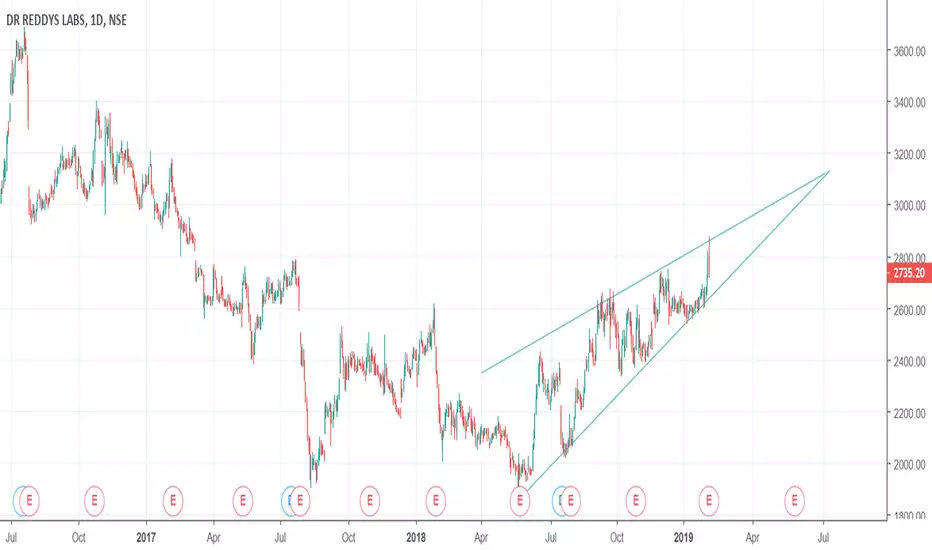
Formation of a rising wegeA rising wedge can be observed in the chart look for breakout on the downside.
Education
WATCHOUT FOR THE BREAKOUTDR reddy has formed a rising wedge on daily chart and there is expectation of an upside breakout.
Look for long opportunities.
Education
Banknifty - At confluence of ResistancesAs mentioned in the chart, looking at the level at which Banknifty currently is, there is at long term trendline resistance,a rising wedge which seems to have come to an end and a possible Head and Shoulders pattern in the making.
Would look for shorting opportunities here with a stop few points above 27900 for a target around 26400 and 25600 levels.
Disclaimer: Views expressed here are my own, and should not be interpreted as an Investment Advice. Please consult your Financial Advisor for in
 Short
Short
eursgdis there a head and shoulder? or a libra? a rising wedge for sure! let see. trying a short position just under the neck line.

 Short
Short
E
KLong

Rising Wedge Breakout - As a Continuation Pattern - RR 1 : 3.90MGL sell Below 834.60
Stoploss - 855
Target - 756
Risk - 2.42% & Reward 9.42%
RR Ratio 1 : 3.90
Reversal or Continuation Pattern
Rising Wedge
Prices are moving upward, forming higher highs and higher lows, but the price is confined within two lines which get closer together to create a pattern. This indicates a slowing of momentum and it usually precedes a reversal to the downside. This means that you can look for potential selling opportunities.
 Short
Short
Rising Wedge Breakout - Continuation Pattern - Risk Reward 1: 3Short Bajajfinsv Below 5550
Stop-loss: 5745
Target 1: 5160
Target 2: 4955
Risk 3.50% & Reward 10.75 %
RR Ratio - 1: 3
RR is Calculated on 2nd Target.
Reversal or Continuation Pattern
Rising Wedge
Prices are moving upward, forming higher highs and higher lows, but the price is confined within two lines which get closer together to create a pattern. This indicates a slowing of momentum and it usually precedes a reversal to the downside. This means that you can look for potential selling oppor
 Short
Short
RISING WEDGE PATTERN ( REVERSAL OR CONTINUATION )Reversal or Continuation Pattern
Rising Wedge
Prices are moving upward, forming higher highs and higher lows, but the price is confined within two lines which get closer together to create a pattern. This indicates a slowing of momentum and it usually precedes a reversal to the downside. This means that you can look for potential selling opportunities.
IDENTIFICATION GUIDELINES
1. The Shape of The Rising wedge – Two price trendlines both sloping upwards, the upper one following higher hig
 Education
INFOSYS SHORTINFOSYS IS SELL FOR TARGETS OF 590-550.
REASONS:
1. IT IS AT A UPPER DIAGONAL OF A RISING WEDGE (BEARISH PATTERN).
2. 5TH WAVE OF DOMINANT WAVE IS COMPLETED. NOW CORRECTIVE WAVES WILL START.
STOPLOSS: "ABOVE SWING HIGH OR AS PER RISK BEARING CAPACITY"
 Short
Short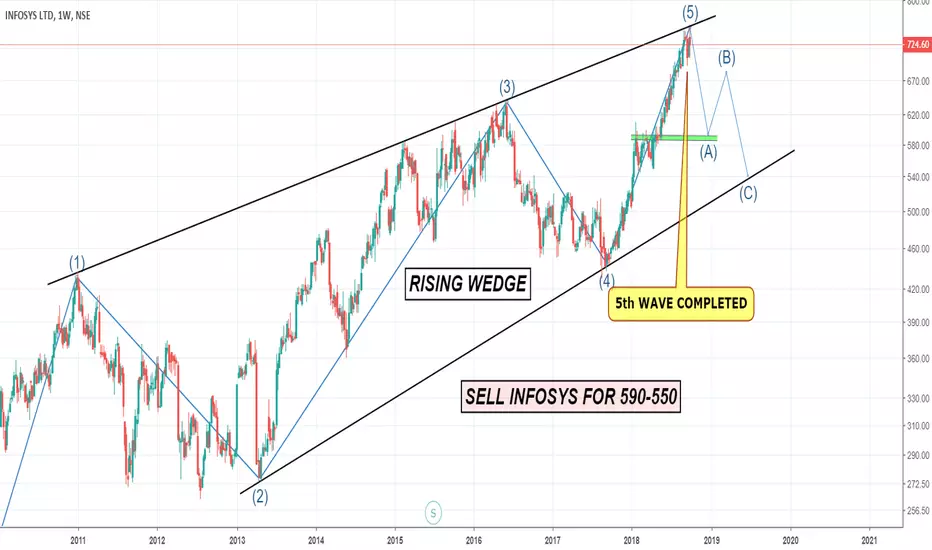

Sterlite Tech Rising Wedge: Target 250 levels; SL:345
Disclaimer: I am a novice in the markets, so please don't construe your trade basis this chart. I post it to see if my views holds true.
SShort
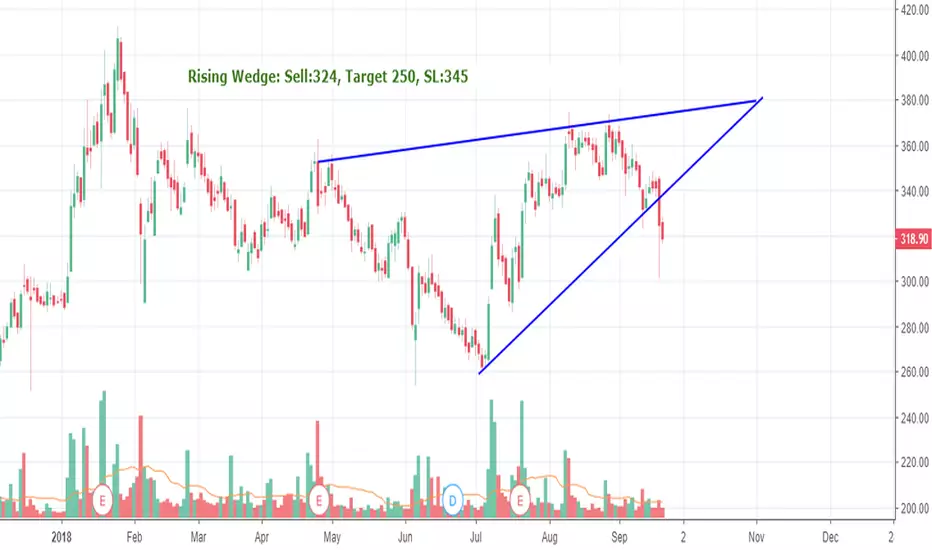
Sterlite techAccording to the double top formation, the target is 312, which is yet to be achieved.
In case that is achieved that would mark as a breakdown for the rising wedge thereby indicating more downtrend. As per the Rising wedge target: 265
Disclaimer: I am a novice in the markets, so please don't construe your trade basis this chart. I post it to see if my views holds true.
SShort

 Short
Short
Bearish move - short Ether is currently trading in a well formed rising wedge. This is an indication of a bearish move and there are possibilities it may breach the bottom trend line (orange). If it breaches it then it will find support at fib level 0.618 (~$693). 2nd support could be found at fib level 0.5 (~$676).
These support levels could be possible reversal zones for Eth (The zones are marked in Blue in the graph). So, watch out.
Please feel free to revert with your feedback. Thank you!
 Short
Short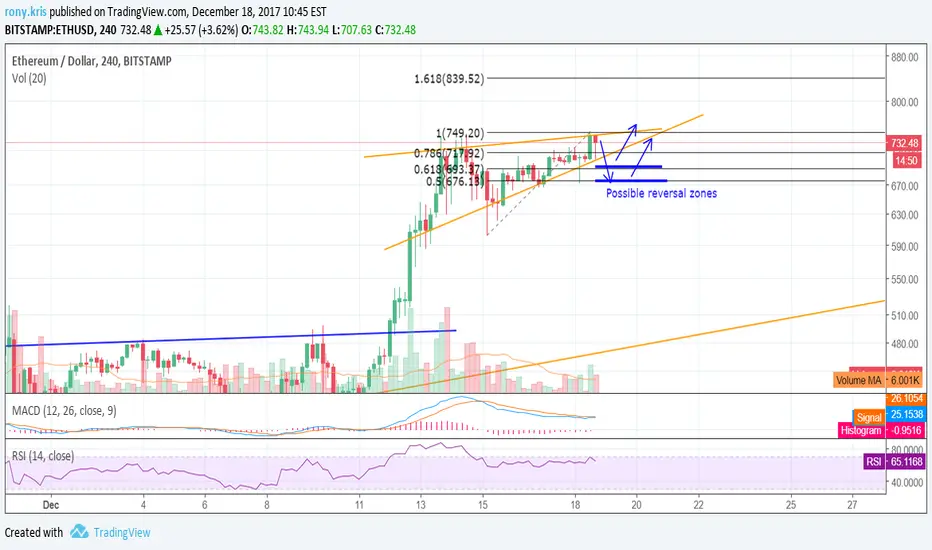
SHORT Wedge Pattern & DivergenceThe stock has formed Rising Wedge and showing continuous divergence. One can short the stock with small SL of high of today for a target of 440 which offers a decent Risk to Reward ratio. Wishing all the mates Happy and prosperous Diwali..
 Short
Short
GANN, ELLIOT and THE TOPPING PATTERNSI always love to trade such a chart but on 5 min. time frame :) Not possible ?? Yes, its possible.. but we will discuss on this topic later in some other post.
CORRECTIONS and the ELLIOT COUNT:
In this chart I can see three major correction. Each one having a different topping pattern. The first correction has a Rising Wedge; the second has Triple Top and the third one has Gramophone pattern at the top.
The first correction eroded more than 61.8% of the last bull market. I consider this

Rising Wedge on Granules IndiaRising Wedge pattern on Granules India and the price will fall after taken out the pattern....
Trade:
Short - 132
Target 1 - 120
Target 2 - 106
Stop loss - 145
 Short
Short
Rising Wedge on DHFLRising Wedge pattern on DHFL and the price will fall after the breakout of pattern.
Trade:
Short below - 442
Target 1 - 427
Target 2 - 410
Stop loss - 461
DShort

Rising Wedge on Indian BankRising Wedge pattern on Indian Bank and if the price break the pattern, it leads to hit 295.
Trade:
Short - 309
Target - 295
Stop loss - 317
Reward Points - 14
Risk Points - 8
 Short
Short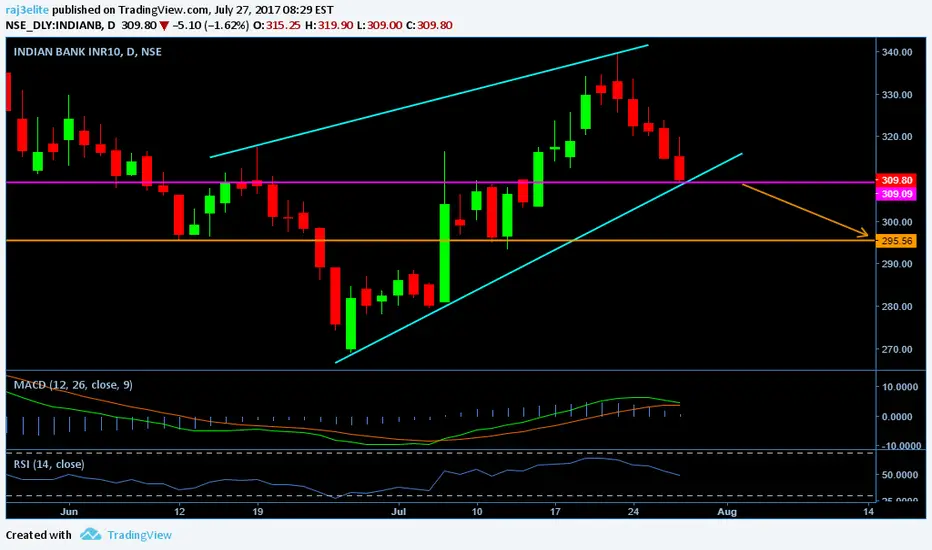
Rising Wedge on Nifty Rising Wedge pattern on Nifty and if breakout happens, then it leads to fall.
Trade:
Short level - 9904
Level 1 - 9886
Level 2 - 9865
Stop loss - 9920
Short
TATAELXSI - BREAKOUT OF RISING WEDGE It is been observed on the daily chart that the price action is breaking out from a rising wedge indicating a further bearishness and weakness ahead.
Target 1: 1500
Target 2: 1480
Stoploss: 1560
 Short
Short
Mahindra Finance : Results are catalyst ( BSwing - 1)Enter the direction of breakout , usually rising wedges breakout to downside, but lets see. The advantage of anyside breakout trader and not guessing direction is , you can make money on anyside even if one side ( false break ) happens.

