Bank Nifty - Is this A Rising Wedge from 47898 As discussed early morning .... 49000 was our key & psychological level ... Index dropped & came close to 48500-48600 zone
Falling From 49000 Level
Support Zone 48500-48600
Makar Sankranti marks the Sun's transition into Capricorn and the beginning of an auspicious period. Historically, equity markets turn optimistic post-Makar Sankranti, driven by cultural sentiment and Budget expectations. Will Budget 2025 keep the trend alive? 🌞
This comes after a 26-day fall in major benchmark
Rising Wedge
BTC.D Breakdown Signals Start of Altcoin SeasonBTC.D has broken its rising wedge support and retested the lower wedge support, which is now acting as resistance. Additionally, the MA 50 and MA 200 have formed a bearish cross, signaling a potential decline of CRYPTOCAP:BTC.D at least 10%. This scenario could trigger altcoin rallies, potentially delivering returns of 5x to 25x, marking the start of the altcoin season.
Real Success Rates of the "Rising Wedge" in TradingReal Success Rates of the Rising Wedge in Trading
Introduction
The rising wedge, also known as the "rising wedge" in English, is a chart pattern that has a remarkable success rate in trading. This analysis details its performance, reliability and complementary indicators to optimize its use.
Success Rate and Performance
-Key Statistics
Overall success rate: 81% in bull markets
Average potential profit: 38% in an existing uptrend
-Breakout Direction
Bearish: 60% of cases
Bullish: 40% of cases
AsianPaints | Wyckoff Events & Phases Explained !!Wyckoff developed a price action market theory which is still a leading principle in today's trading practice.
The Wyckoff method states that the price cycle of a traded instrument consists of 4 stages – Accumulation, Markup, Distribution, and MarkDown.
👉TEXTBOOK EXAMPLE Accumulation Schematic: Wyckoff Events and Phases
Price Action Analysis
And this is the accumulation stage -
1) PS— Preliminary Support, where substantial buying begins to provide pronounced support after a continued dow
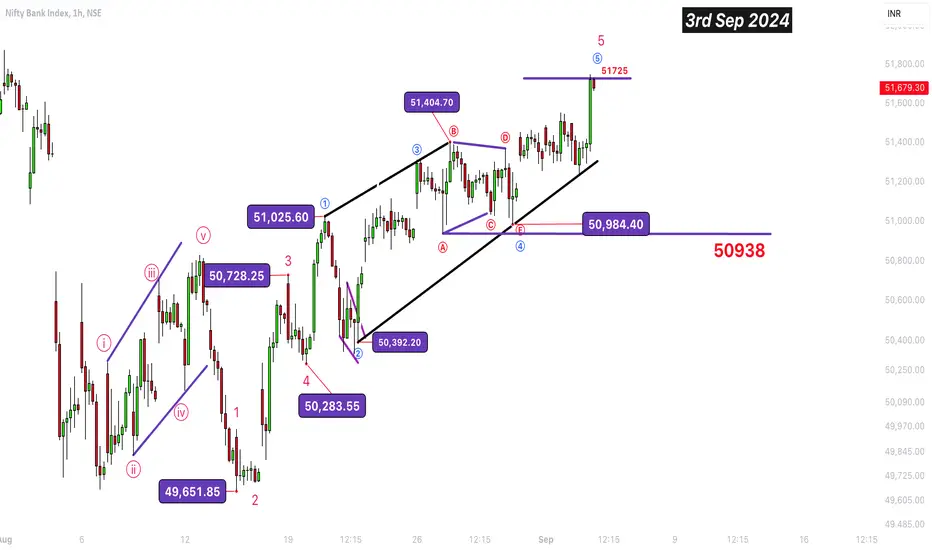
BankNifty ( Elliott Wave) - Will 51700+ Be The Short Term TopDisclaimer:
This is not a solicitation to buy or sell any financial instruments. Please consult your financial advisor.
Explore the latest Bank Nifty analysis with WaveTalks. Will 51700+ be the short-term top? Discover insights and potential market moves as we decode the whispers of the market. Stay informed with WaveTalks - Market Whispers!
Let's Jump In ...
As discussed in the last idea published on 29th August, it was suggested that holding the 50938 / 50939 critical level, Inde
BITCOIN: Bearish - Double TOP + Rising WedgeBITCOIN: Bearish – Double TOP + Rising Wedge
The market could go back down to around $58 000.
In addition, detection of a possible double top on Bitcoin which would bring the price down to around $48 000
Watch for the 50 and 200 exponential moving averages, as well as the Ichimoku levels, and RSI.
be careful
DRREDDY - PRICE REENTERING RISING WEDGE CHANNELHi All,
This idea is about Dr Reddys Lab
Fundamentals
Mkt Cap - 106810 Cr
Stock PE - 19.2
ROE - 21%
ROCE - 27%
Mkt Cap/Sales - 3.8
OPM - 28%
Technicals
Price was pushed back to follow the rising wedge pattern & if it sustains above the marked (white line) resistance, can further show an upside of 8-10% to reach the upper channel of rising wedge
Happy Trading,
Thanks,
Stock-n-Shine
BankNifty - Is this An Ending Diagonal at Tops 51404WaveTalks ...Market Whispers! ...Can You Hear Them?
Disclaimer:
This commentary is not a solicitation to buy or sell. Please consult your financial advisor
As discussed this morning......catching the wave 4 bottoms & watching 5 unfolding in back to back ups & downs with a minor halt at 51251 have we unfolded an ending diagonal at the tops of 51404
Wave 4 Bottoms this morning close to 51000 as discussed
Wave 5 - Is this an ending diagonal unfolded at the current high of 51404
Nifty at a Glance: This Week's Market MomentumNifty Outlook: A Pivotal Week Ahead
Nifty remains weak as we enter a crucial week. The index faces stiff resistance at 24,450. A close above this level could open the door to 24,725, but failure to hold it may trigger a drop. Key support lies at 24,150; breaching this could lead to a decline towards 23,850.
Adding to the bearish tone, Nifty has broken down from a Rising Wedge pattern, with a potential target around 21,300. This week is critical—watch these levels closely as the market navigate
DOGECOIN: Rising wedge + R.O.C DivergenceDOGECOIN: Rising wedge + R.O.C Divergence
The Wolf of Zurich has detected an ascending wedge + A nice divergence on the R.O.C = Rate Of Change, which indicates the variation of the Momentum of the underlying.
To watch the 50 and 200 exponential moving averages
The Fibonacci and ICHIMOKU levels
Consolidation breakout is on the cards!Vguard has been consolidating from 2018 in a rising wedge pattern.
Today, the stock has given a breakout of its ATH and is currently looking bullish.
However, the best entry for the stock is 255-260 with a SL of below 235 DCB for minimum target of 300.
The stock can give multibagger after a upward breakout of the pattern.
Idea is shared for educational purposes and should not be considered as a recommendation.
BankNifty Rising Wedge Resistance - Breakout OR Breakdown?Bank Nifty: on the monthly timeframe, the 53,000 level stands out as a crucial resistance line. The market's next significant move is contingent upon a decisive close above this barrier in the lower timeframe. The current pattern resembles a rising wedge.
SENCO - POST 20% CORRECTION, PA MIGHT REVERSE FRM BOTTOM CHANNELHi All,
This idea is about Senco Gold Ltd
The stock has corrected over 20% in this month alone & now have reached the lower channel of rising wedge formation. Volumes have dried up indicating the supply may have exhausted & Price action might soon reverse from this point
Stock can be bought if it gives a closing above 980 for further targets of T1 1010, T2 1070, T3 1150.
If the stock shows further downside then the support levels are S1 916, S2 864
The correction is due to poor quaterly re
Nifty Reaches 24,500 Target: Elliott Wave Analysis Disclaimer:
------------------------
Trading in financial markets involves substantial risks. Consult your financial advisor before making decisions. This commentary is not a solicitation to buy or sell.
WaveTalks - Market Whispers: Can you hear them?
----------------------------------------------------------------------------------------------
General Election 2024: Impact on Nifty
The 2024 General Election resulted in a clear victory for the existing NDA government, with Prime Minis
SUNDARAM FINANCE - RISING WEDGE SINCE AN YR Hi All,
This idea is about Sundaram Finance Holding
Fundamentals
Market Cap - 6k Cr
Mkt Cap/Sales - 20.9
ROE - 12%
P/BV - 1.27
Div Yield - 2.81%
Technicals
Price action has been in a rising wedge pattern since Jul 23 & currently consolidating at the bottom of channel for past few days. It can give a upmove of nearly 25% in very short term.
Traders can take positional trades to capture the move.
There is a small resistance for which traders need to be careful. Price reverted twice from
SLong
Great Shorting opportunity in ABBABB is around the Long Term Resistance
ABB is up almost 1200% in last 4 years !
Which is very extraordinary.
If we analyse Monthly timeframe analysis then we can clearly see Stock is around the long term channel Resistance.
Resistance is coming around 9200-9300
Also to confirm the same resistance, on a Daily timeframe we can see Rising channel which is seems working and stock is around the resistance.
Right now stock is around 9200-9100 and if stock falls from the highs then we can ex
Endurance-A good auto ancillary stock for long termCurrently, stock has given breakout from resistance and can be taken as a quick swing trade for 2300 target.
Stock has a strong trendline supply zone which is around 2300.
If this level breaks out, we can see huge rally in the stock and can be held for long term.
Stock has good fundamentals and only around 2% is public holding. Good bet in EV sector theme.
CRUDE is ready to go up from long term SupportCrude oil will blast upside if Support is held !!
Crude Oil (MCX) is around 6200
Its long term Support or Law of Polarity is around 5900-6000
These channels are working since 2015 in Crude Linear chart
Price action & RSI is indicating that Crude to take support around these levels.
Thank You !!
ETH : 3 important patterns detectedETH : 3 important patterns detected
On the decline :
1- Rising Wedge The price can go lower to 56 000$
_______________________________
On the rise :
2- Falling Wedge : The price can rise to 4 144 $
3- Bullish Pennnat : The price can reach 4 892 $
_________________________________
To monitor :
- EMA.50 and EMA.200
- ICHIMOKU levels : Tenkan and Kijun
LODHA Infra will correct from hereLodha is trading around the resistance
This is linear chart of LODHA in weekly timeframe
Stock is trading in a rising channel
Currently stock is around the resistance of Rising channel which is coming around 1450-1500
Fresh Buy could be very risky around these levels
And if anyone is holding then Trailing Stop Loss would help them to grab maximum profits.
Thank You !!
Nifty - Pre Exit Poll Outlook: Bulls Above 22,400 Disclaimer:
Trading in financial markets involves substantial risks. Consult your financial advisor before making decisions. This commentary is not a solicitation to buy or sell.
WaveTalks - Market Whispers: Can you hear them?
-----------------------------------------------------------------------------------------------
Key Levels to Watch:
- Immediate Resistance: 23,000
What Unfolded Last Week:
The index retraced 600 points, making a low of 22,417 as expected pause below 23000 in
Nifty Explosive (Part 3): From 22,000 to 23,000 in Record Time!
Disclaimer:
Trading in financial markets involves substantial risks. Consult your financial advisor before making decisions. This commentary is not a solicitation to buy or sell.
WaveTalks - Market Whispers: Can you hear them?
-----------------------------------------------------------------------------------------------
Nifty Index Outlook - May 24, 2024
Overview
In our last analysis, we emphasized the importance of having both a primary plan (Plan A) and an alternative plan