Crompton is going with momentum for More upsideCrompton has reversed from Long term Support !!
Stock always corretcs between 35-50% from highs
And give upside of 130-180%
So this time also from the lows that is from 270 levels we can expects stock to perform atleast 130-150%
Right now stock is in momentum and one can wait for correction and accumulate from lows.
Rising Wedge
Auropharma - Can You Catch Wave Top ,Recognise This Pattern ? Elliott Wave is a such an amazing scientific method, if you apply them & be humble & open to what market tells you, you are going to be rewarded like catching all the waves.
Disclaimer:
Trading in financial markets involves substantial risks. Consult your financial advisor before making decisions. This commentary is not a solicitation to buy or sell.
WaveTalks - Market Whispers: Can you hear them?
From WaveTalks
Abhishek
ICICI BANK : Bearish - Rising Wedge detected, and Double TOP ?!ICICI BANK : Bearish - Rising Wedge detected, and Double TOP possible.
To monitor:
The exponential moving averages 50 (in pink) around 991 ,
and the exponential moving average 200(in white) around 793.
A possible Double Top is detected.
+ there are divergences with the RSI and the ROC ( Rate Of Change), which gives the speed of the variation of the momentum of an underlying!
So a bearish return is possible
Be safe!
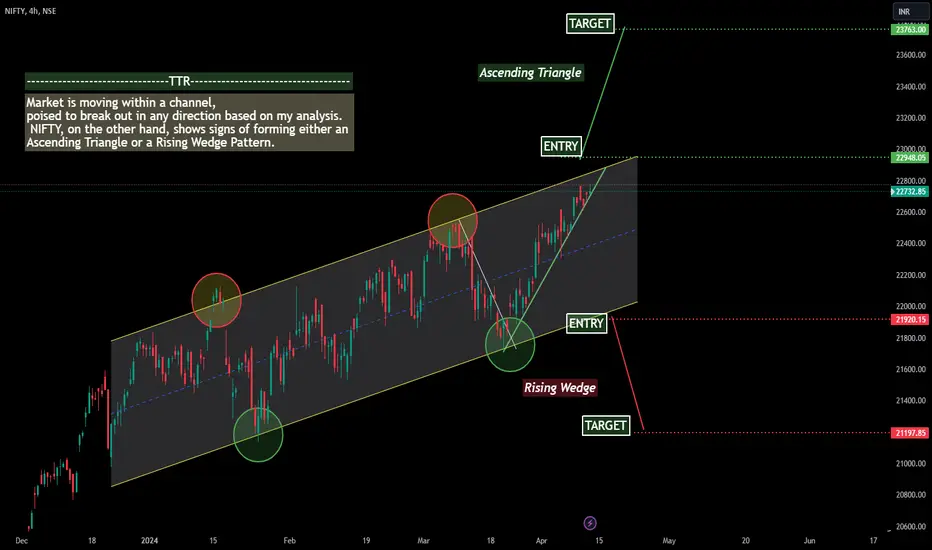
NIFTY April/MAY Direction | Ascending Triangle or Rising Wedge ?Hello Traders/Investors,
After analyzing NIFTY, it appears that a breakout is imminent, either on the upside or the downside.
Patterns:
1. Ascending Triangle | Probability: 70%
2. Rising Wedge | Probability: 30%
Analysis:
1. Ascending Triangle | Upside Potential:
- Condition 1: If NIFTY breaches 22,950 by next week and maintains its position, there's a likelihood of a rally towards 23,760. However, any impact on prices, aside from election results, seems unlikely before then.
- Condition 2
EURUSD Fall - Classic Equality Count in Play | C = A WaveDisclaimer:
Trading in financial markets involves substantial risks. Consult your financial advisor before making decisions. This commentary is not a solicitation to buy or sell.
WaveTalks - Market Whispers!, can you hear them
13th Jan 2024 - B: Wave completed at the tops of 1.11393
Long Term Outlook
From its low at 0.95358, we're seeing a leading diagonal wave signaling a potential long-term uptrend. As previously discussed, big gains might be ahead. Once short term complete
SBI : PSU Bank solid Bearish setup ?? Alert! Bearish Pattern Spotted! ๐ป
๐ Pattern: Rising Channel
๐ Symbol/Asset: SBIN
๐ Description: Stock is in Rising channel.
and now Stock is around the resistance of the rising channel.
We can see downside of 18-20% if 730 levels are intact !!
Huge shorting opportunity !!
๐ Disclosure: We are not SEBI registered analysts, this is not a buy or sell recommendation.
POLYCAB : Bottoming out very soon Exciting Bullish Pattern Alert! ๐
๐ Pattern: Rising Channel
๐ Symbol/Asset: POLYCAB
๐ Description: Stock is around the support of Rising Channel.
Stock also completed its bearish target around 3700-3800
We can see stock bottming out near 3700- 3800
๐ Disclosure: We are not SEBI registered analysts, this is not a buy or sell recommendation.
INDIGO : Best swing shorting OpportunityAlert! Bearish Pattern Spotted! ๐ป
๐ Pattern: Rising Channel
๐ Symbol/Asset: INDIGO
๐ Description: Stock is rising and now making rising channel.
Which is bearish pattern.
We can see downside from hereon.
๐ Disclosure: We are not SEBI registered analysts, this is not a buy or sell recommendation.
NIFTY METAL Sector Analysis (1W TF) - 16th December 2023#NIFTYMETAL Sector Analysis (1W TF)
PATTERN: RISING WEDGE BREAKOUT
- The Metal sector has shown a fabulous up move since beginning of 2023
- Wait for Breakout of the Resistance Zone OR Reversal !
#stocks #swingtrade #chartanalysis #priceaction #traderyte #india #indiagdp #StockMarketindia
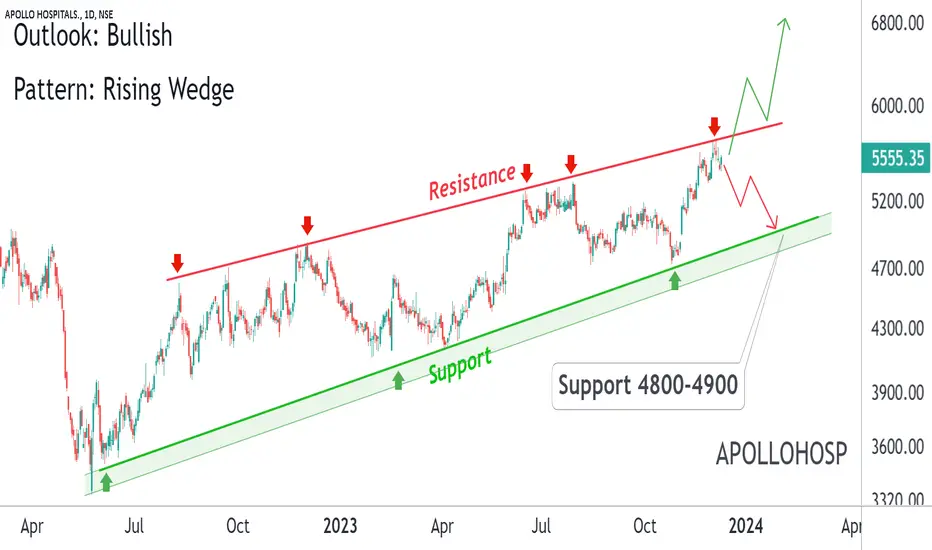
Apollo Hospital : Very Bullish Pattern Exciting Bullish Pattern Alert!
๐ Pattern: Rising Wedge
๐ Symbol/Asset: APOLLOHOSP
๐ Description: Stock is in a rising wedge. We can see downside if resistance is intact. And stock can come towards 4800-4900
Or If stock gives breakout then we see huge momentum on the upside.
๐ Disclosure: We are not SEBI registered analysts, this is not a buy or sell recommendation.
BALRAMCHIN : Exciting Bullish Pattern AlertExciting Bullish Pattern Alert!
๐ Pattern: Rising Channel
๐ Symbol/Asset: BALRAMCHIN
๐ Description: Stock is around the support.
We can see huge momentum if support is intact.
๐ Disclosure: We are not SEBI registered analysts, this is not a buy or sell recommendation.
๐ Alert! Bearish Pattern Spotted! ๐ป๐ Alert! Bearish Pattern Spotted! ๐ป
๐ Pattern: Rising Wedge
๐ Symbol/Asset: TATAMOTORS
๐ Description: Stock is around the resistance of rising wedge. We can see downside hereon.
๐ Disclosure: We are not SEBI registered analysts, this is not a buy or sell recommendation.
BankNifty - Rising Wedge Drama Unfolding (Careful at Tops 46310)Hello WaveTalkers
As we approach the close of this trading week, we're spotting some intriguing patterns in the BankNifty Index.
Wedge Drama Unfolding?
- Without giving away too much, there seems to be a rising wedge forming at the current highs.
- This might hint at a potential move towards a 45299 downside target.
Trading Strategy
Once Index falls below 46000 - It will confirm the downside bias but careful as it is weekend & consult your financial advisor before taking
BankNifty-Selling The Tops with Wedge: The Precise Peak 44650Hello All,
Our tiny heroes reached a majestic peak at 44669 as per last idea published yesterday, just as we imagined in our dreams! This peak was not just a high point, it was a place where they could see the entire playground sprawling below. But as we all know, after reaching the top, there's a thrilling slide waiting! Our numbers decided to swoosh down, and guess where they are heading? Yes, you got it right, towards the fun zone of 44300, our lower band of support we chatted about yesterd
Rising wedge pattern reversal in SIEMENS INDIA LTDSIEMENS INDIA LTD
Key highlights: ๐กโก
๐On 1Day Time Frame Stock Showing Reversal of Rising wedge Pattern .
๐ It can give movement upto the Reversal Final target of above 3882+.
๐There have chances of breakout of Resistance level too.
๐ After breakout of Resistance level this stock can gives strong upside rally upto above 4420+.
๐ Can Go short in this stock by placing a stop loss below 720-.
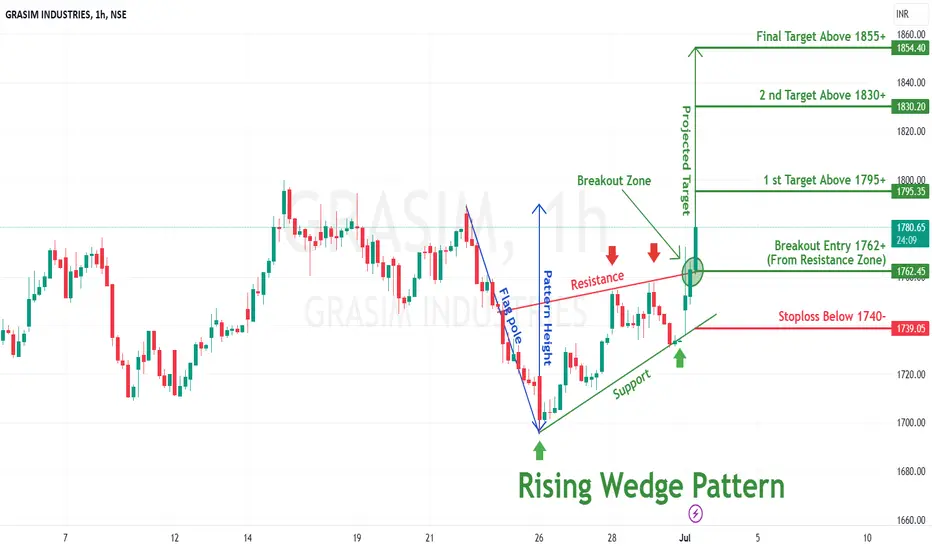
Rising Wedge Pattern Breakout in GRASIM INDUGRASIM INDUSTRIES
Key highlights: ๐กโก
โ
On 1Hour Time Frame Stock Showing Breakout of Rising wedge Pattern .
โ
Strong Bullish Candlestick Form on this timeframe.
โ
It can give movement up to the Breakout target of 1855+.
โ
Can Go Long in this stock by placing a stop loss below 1740-.
Rising Wedge Pattern Breakout in ULTRATECHCEMENTULTRATECH CEMENT
Key highlights: ๐กโก
โ
On 1 Week Time Frame Stock Showing Breakout of Rising wedge Pattern .
โ
Strong Bullish Candlestick Form on this timeframe.
โ
It can give movement up to the Breakout target of 9660+.
โ
Can Go Long in this stock by placing a stop loss below 7350-.