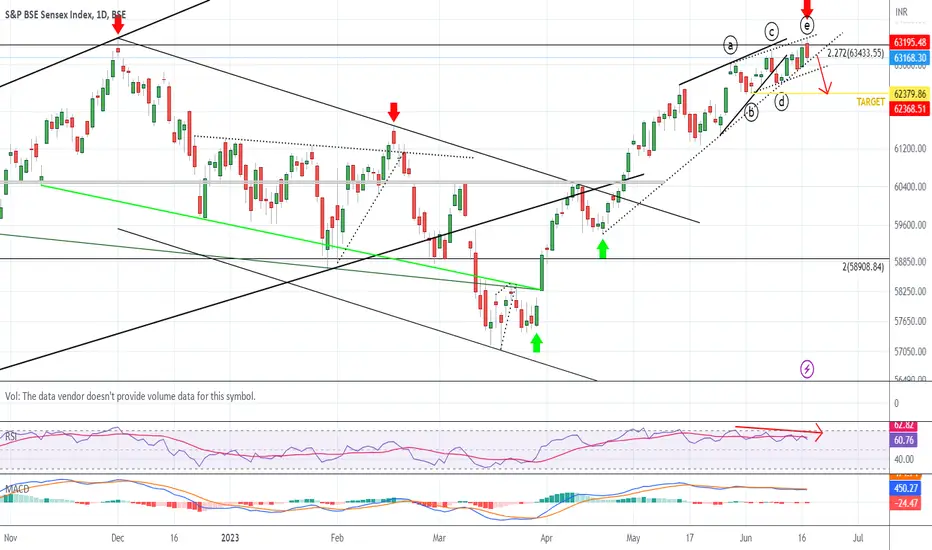
BSE Sensex Ending Diagonal CAUTION!Attached: Sensex Daily Chart as of 19th June 2023
The Ending Diagonal is more evident and clean in BSE Sensex rather than NSE Nifty 50 (although you can observe in Nifty as well), which is why I have chosen to share the Sensex Chart
Observe:
- A well defined trend line with multiple touch points
- Presence of a Bearish RSI Divergence
- Daily MACD already in Sell mode
All that is needed is break of Today's Low and a Close below it (which would also give the Trend Line breakdown simultaneously)
Rising Wedge
BITCOIN at Rising Wedge in BearishZoneBITCOIN 1-hr. Chart Analysis
As per present Scenario in BTC, its moving perfectly into Rising Wedge Pattern. So, it will be try once again a Uptrend cycle up to $31,950 and reverse back very fast into Downtrend cycle up to next 48 hrs. maximum.
While, as per FIB extension, BTC chart displays every retracement of down cycle towards FWB:27K
Always #DYOR before invest in Crypto
Trader's always use #StopLoss at this situation
Must, LIKE & SHARE
GLENMARKGLENMARK:- Stock has given breakout, if you want to plan something then let the price come back to 620 then 621, do it after that, till then keep an eye on the stock
Hello traders,
As always, simple and neat charts so everyone can understand and not make it too complicated.
rest details mentioned in the chart.
will be posting more such ideas like this. Until that, like share and follow :)
check my other ideas to get to know about all the successful trades based on price action.
Thanks,
Ajay.
Bharat Petroleum, BullishThe stock has been in sustained downtrend since 2021, forming rounding bottom pattern.
The correction in the stock price after dividend payout got extended further upto 298 levels.
There is also small rounding bottom pattern inside the major one along with rising wedge
pattern which is likely to breakout soon. The levels are shown on the chart, for educational
purpose only and are not any trade recommendation.
#SIEMENS Rising wedge & hanging man formation Siemens on weekly timeframe is forming a rising wedge formation.
It is also formed at the top of the rising channel in which Siemens has been trading from quite some time, generally such formation are formed as ED formation in EW and can be a signal of truncated 5th in its impulsive wave upmove.
Although, this post doesn't deal in great detail with EW wave marking but an indicative wave counts are marked as well.
Weekly chart is also showing a negative divergence and longs need to be cautiou
BankNifty - Unveiling the Magic of Wave Analysis Near ATH-44151Introduction
In the world of financial markets, technical analysis plays a crucial role in understanding market trends and making informed investment decisions. One powerful tool in this domain is wave analysis, which has proven its accuracy time and again. In a recent BankNifty analysis, wave analysis beautifully predicted the index's movements, providing traders with valuable insights. This article will delve into the fascinating details of this analysis, its striking coincidence with the ac
BankNifty Tidal Wave- Ride or Crash? 15th May 2023Welcome back to another episode of Wave Talks. Bank Nifty's Tidal Wave -Ride or Crash: Index can face a significant shift with the unfolding ending diagonal. Will you ride the wave to profit or crash on the shore? Unfolding wedge pattern
It's time to reconsider Bank Nifty's pattern as it poses a risk. Let us discuss in details price objective & outlook for next few weeks with key & critical levels for better risk management.
Last Idea - BankNifty's Danger -Is this a rising wedge
BankNifty's- Danger: Is this A Rising Wedge?– Time to RethinkEarlier in The Day - When Magical Level of 43350 Holds
Ending diagonal
Also known as an ending wedge, is a term used in the field of technical analysis to describe a specific chart pattern that signals the end of a trend or price movement. This pattern is characterized by converging trendlines that form a wedge shape and typically consists of five waves, with the third and fifth waves being smaller than the first and second waves.
Rising wedges are bearish reversal patterns that ofte
BANKNIFTY 15 min TF - Monthly Expiry - Rising WedgeLooking at the structure, I personally don't trust any further upmove for going long until it show some dip whether small or big. Especially when it has major resistances so close while moving upside
Lets see it this affect NIFTY or not, because NIFTY also has 17900 and 18000 as major resistances
trade with proper plan and risk management.
Feel free to comment or message for any feedback on this chart or any other charts shared by me.
thanks
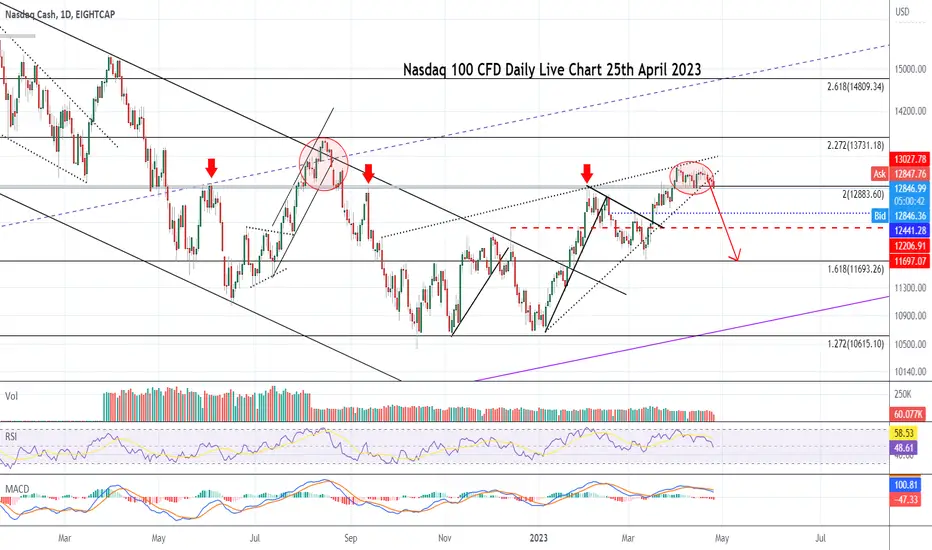
Nasdaq 100- Rising Wedge BREAKDOWN!Attached: Nasdaq 100 CFD Daily Live Chart as of 25th April 2023
Was waiting for a quite a while for this to play out and it finally has today in the Nasdaq
Price formed a Distribution Pattern and today we are finally getting the Breakdown
MACD also in Sell Mode
13k Level is Lost and below 12800 it is a Confirmed Breakdown. This has BEARISH Implications, a Top in Place to say!
Cummins - Rising Wedge & Evening Star - Weekly OverviewNSE:CUMMINSIND making rising wedge on weekly charts and also has formed a evening star candlestick pattern. With a SL of 1666, one can short for T1 of 1552 and T2 of 1518.
Let's see how the story develops. Best wishes!
Disclaimer -
- The opinions expressed here are my own. This is for my own records as well as what I see on charts.
- If you are referring to this, please keep in mind that it is only for educational and research purposes.
- Past performance is no guarantee of future results.
Rising wedge pattern reversal in Pidilite Industries Pidilite Industries
Key highlights: 💡
✅On 1 week Time Frame Stock Showing Reversal of Rising wedge Pattern .
✅It can give movement upto the Reversal target of above 3000+(Up to resistance level).
✅Can Go Long in this stock by placing a stop loss below 2298-.
MPS - Short and Long Term
The Higher Time frames look solid.
Multi-year Breakout Contender.
On the Lower Time frame an inverted Head and Shoulder was spotted.
A breakout happened and followed it up with a retest.
Stock is moving in a Rising Wedge.
I expect an upward rally from here on to the top end of the wedge.
Rising wedge in EURINREuro to Indian Rupee pair (EURINR ) has been forming rising wedge for some time on the Daily time frame. This is also supported by fall in momentum as shown in the RSI.
The pair has rejected bulls for last few days. Conditions look ripe for a fall in price toward wedge target zone of 86.8 on the EURINR spot pair. SL may be kept above previous high, around 89.30.
Banknifty Analayis Banknifty after a extreme bullish view posted way back (link in related idea section) has achieved most of the upside targets. The current weekly candle is not looking promising which has also formed on the top line of pitchfork which I had drawn long back, On weekly charts it has made a rising wedge kind of pattern and it has also not retested the previous ATH breakout as such (41800). This level is also around 38% fibo retracement of current swing from Sept low to latest high.
Some cool off
Rising Wedge in JPYINRJapanese Yen to Indian Rupee pair (JPYINR) has been forming rising wedge for some time on the Daily time frame. This is also supported by fall in momentum as shown in the RSI.
The pair has rejected bulls for last few days. Conditions look ripe for a fall in price toward wedge target zone of 0.6140 on the JPYINR spot pair. SL may be kept above Friday high, around 0.64.
HDFC Bullish RejectionThe weekly chart of HDFC is exhibiting rejection of the bulls for the last five weeks. This can also be seen in the rising wedge which is forming on the Daily chart.
Further, this type of price action is also forming at the completion of 61.8 AB=CD harmonic pattern.
The thesis is bearish with target of point B of the harmonic pattern at 2507.
HShort