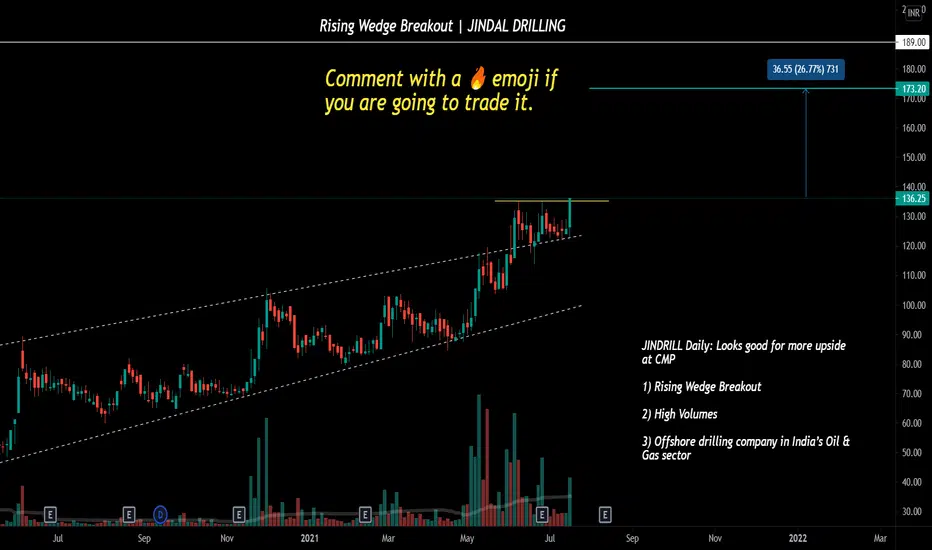
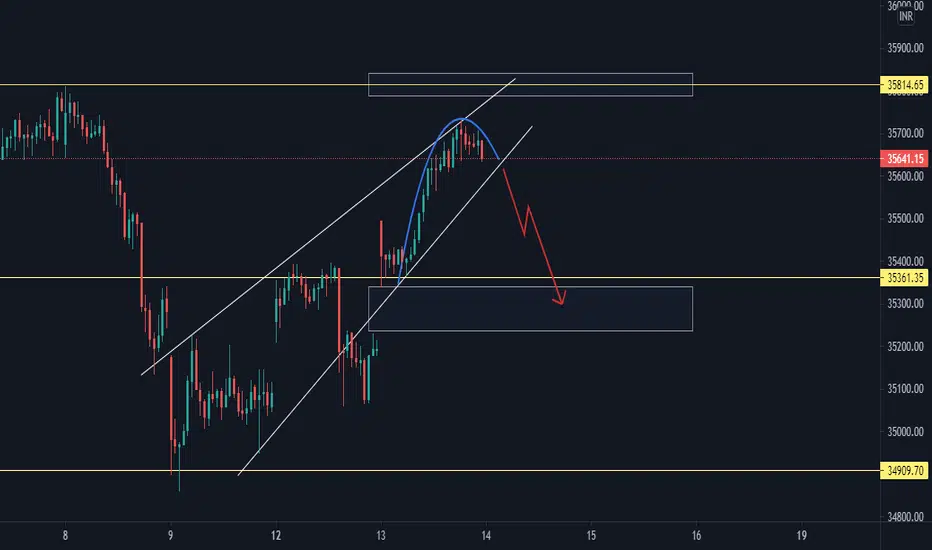
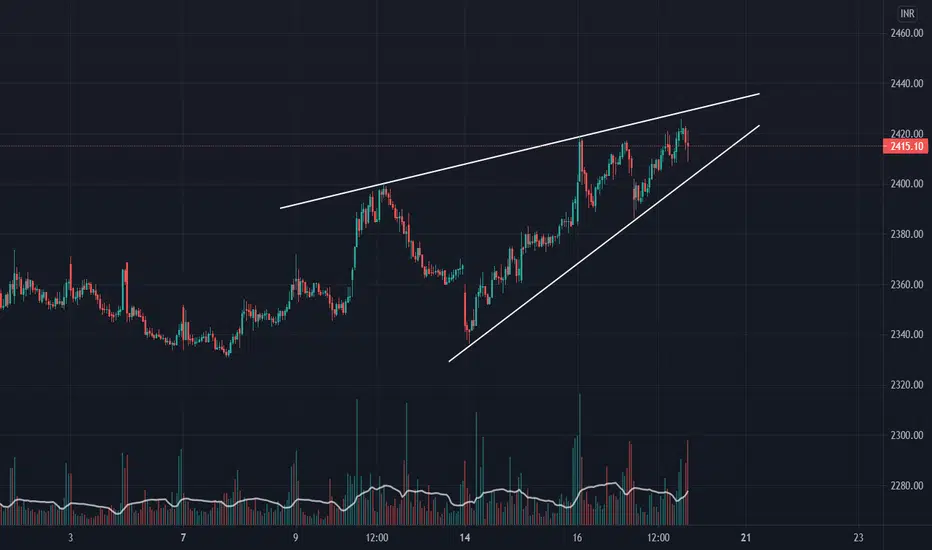
NZDUSD confirms rising wedge on strong NZ employment dataWith the firmer Q2 jobs report, the RBNZ is all set to become the first developed nation central bank to announce a rate hike in 2021. The bullish consensus spread like a wildfire among the top-tier banks following the data, fueling the NZDUSD prices beyond a key hurdle from mid-June, which in turn confirmed a bullish formation suggesting a theoretical jump towards revising the May month’s low near 0.7315. During the run-up, tops marked during July and June, respectively near 0.7100 and 0.7240 m
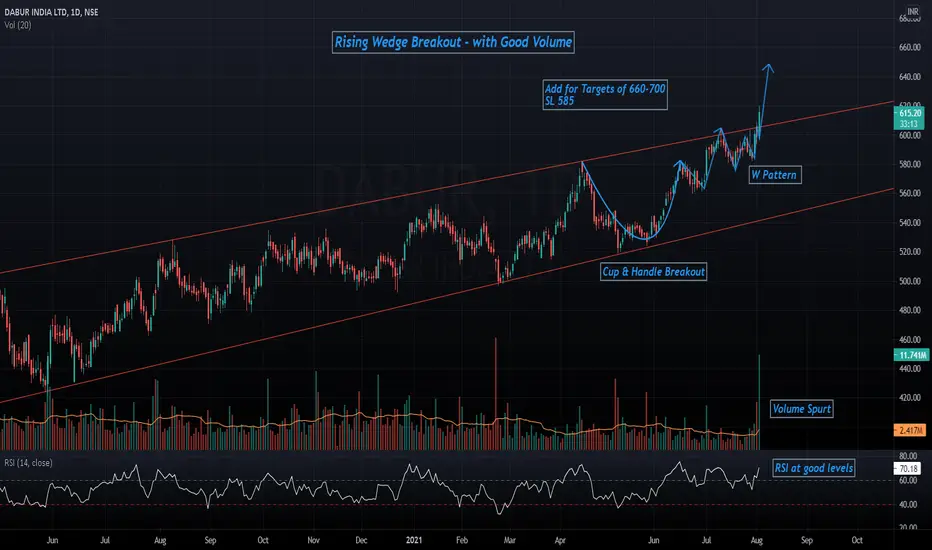
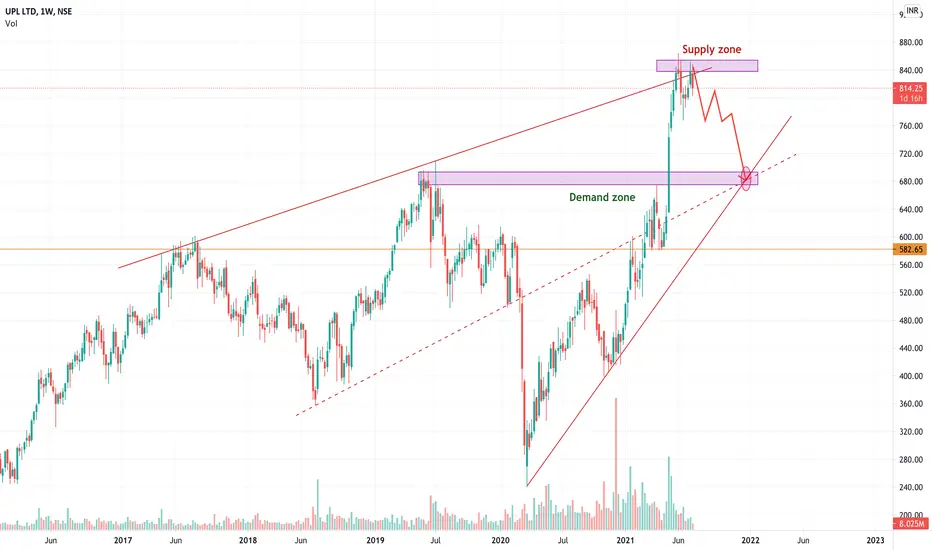
Rising Wedge
TCS: Rising wedge breakdown?A decently medium term upward trendline originating from November 2020 has recently been broken by TCS. In fact, it seems to have started respecting recently formed downward trendline. After the recent pullback to the trendline and the averages, it is seeing the beginning of another bearish leg downwards.
_____________________________________________________________________________________________________________________________________________________
The pattern which has formed resembles a r
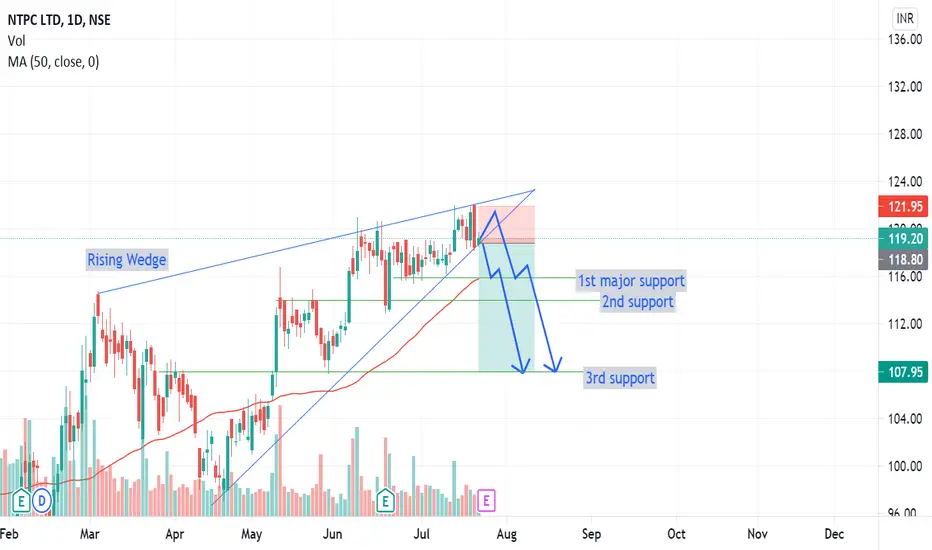
NTPC Rising WedgeThe pattern we see is an 'Rising Wedge' pattern. This usually occurs when a security’s price has been rising over time, but it can also occur in the midst of a downward trend as well. (Information via Investopedia)
The declining volumes indicate lower volatility and an imminent power move (long/short), ATR confirms the same.
Considering the bullish green candle with a short body indicates weak buying trend.
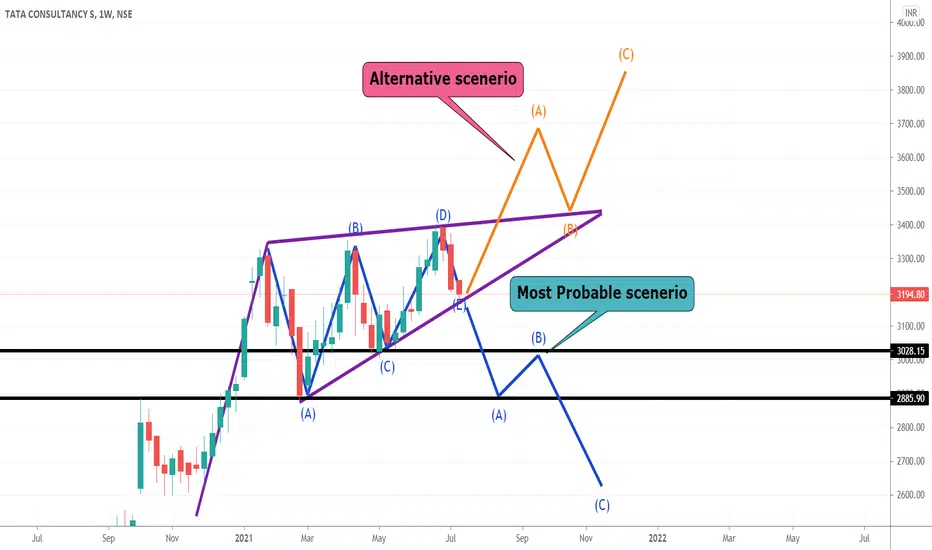
Rising Wedge pattern in weekly chart of TCSProbable scenario:- The rising wedge pattern is a probable sign of a strong bearish movement. In the case of TCS, if the price doesn't hold the support line it might go bearish . If the price doesn't find immediate support while retracing it might go for a strong bearish move.
Alternate Scenario:- If the price breakouts the resistance level and holds that position for some period then the strong bullish trend might continue which is less probable to happen.
Probable scenario: Alterna
Natural Gas - 250 or 320 next week ??Natural gas is at crucial levels.
Rising wedge formation can be seen on weekly TF.
2 Doji weekly candles can be seen at resistance levels, if breaks 284 on daily candle close then can expect more upside, else looks probable to come down to 250 levels
P.S. Wait for Daily candle close breaching 260(downside) or 284(upside)
NIFTY - Ascending Triangle Breakout ?Overall Nifty is in a Rising Wedge.
The way it is shaping up after a cup breakout and now 3 VCP in an ascending triangle, it seems the short term correction will be over soon, unless something drastic happens and the ascending triangle is breached on the downside.
MACD also looks bullish for now.
Story of Happiest Minds - 100% return 🔥🔥 👑 Drop a follow here: @Averoy_Apoorv_Analysis 👑 ----------------------- 🔥🔥 Target: 1000 Followers 🔥🔥
📌 Just analysis or you can say backtesting my patterns and price actions :) no potential trade on these levels + on monthly TF it has moved a lot already which is 100%+ so it might get volatile for a while :) just all the possible trades that could have been traded
⌛ Motivational and psychological area ⌛
✣Trade only if you are in the right mindset, if you have been emotionally weak for som
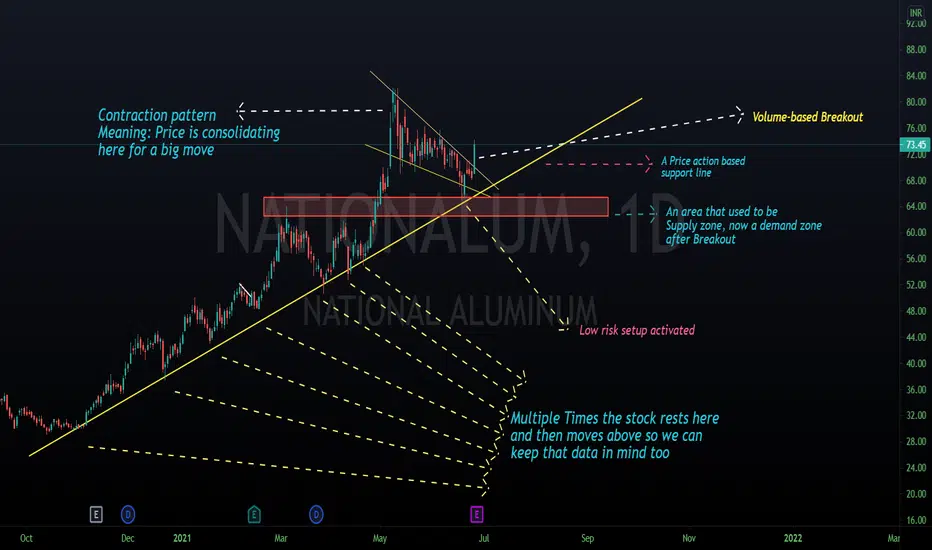
Read chart like a PRO - NATIONALALUM Stock is taken for example and a possible long trade with 8% risk : National Alum
✺----------------Drop a follow here: @Averoy_Apoorv_Analysis ✺
Chart Type: Self Explanatory :)
✺--------------------------- Motivational and psychological area ✺
✣Trade only if you are in the right mindset, if you have been emotionally weak for some time, take your time and don't trade, trade with a happy and + mindset only.
✣If you want to make money, firstly be prepared to lose it, only that much which you c