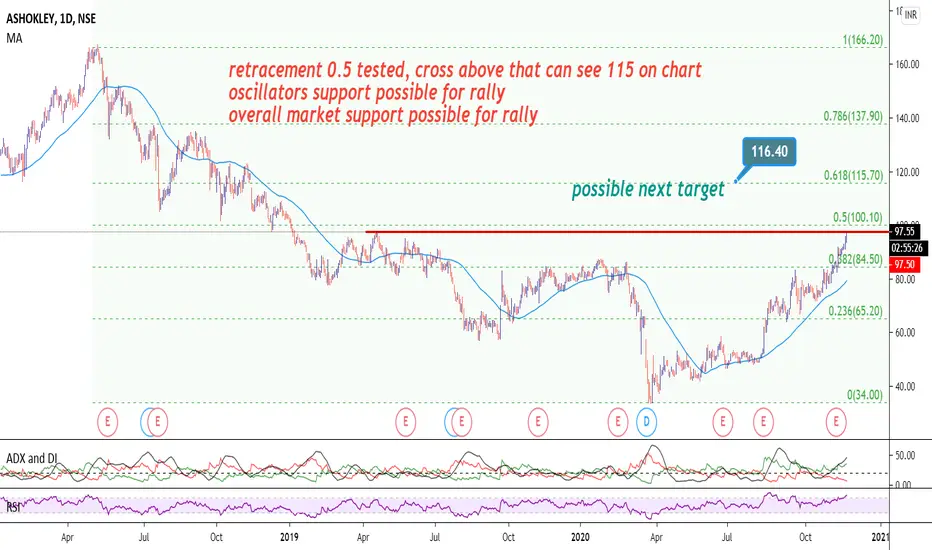
Long
Long
 Long
Long
 Long
Long
 Long
Long
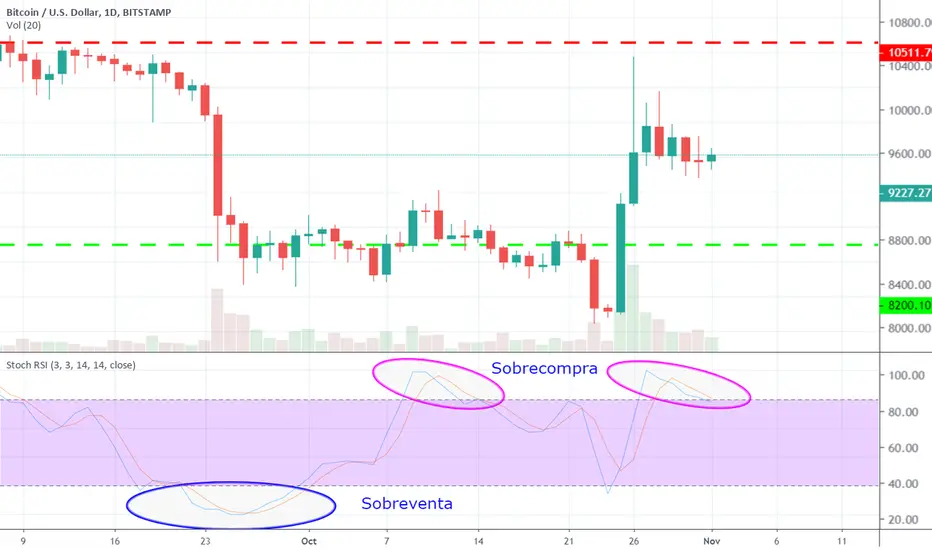
BTCUSD to see an uptrend bias | Moving Averages indicating buyMarket in last 24hrs
-BTCUSD moved sideways, price above 11k
-Price volatility was high. Market moved ~3.02%, between $11.2k and $10.86k
Today’s Trend analysis
-Low volatility ahead with a bullish bias
-Price at time of publishing: $11,050
-BTC’s market cap: $203 Billion
-Oscillator indicators are mostly neutral. RSI at 73
-Moving average indicators are biased towards uptrend. Ichimoku Cloud is neutral
-Volume indicators are indicating a low volatility ahead. Very low volumes observed in recent candles, volumes were less than 20 candles moving average.
Price expected to move upwards, low volatility due to low volumes. Most of the Oscillator indicators are neutral. MACD is positive around 360, histogram size decreasing in last few candles about to cross down zero, indicating a bearish sign. RSI at 73, still in the overbought region indicating bearish opportunity. CCI is above 70, and in neutral region signaling a sideways movement. Another interesting point to notice here is that the candles are making higher lows which indicates a buying pressure.
----------------------------------------------------------------------------------------
The analysis is based on signals from 28 technical indicators, out of which 17 are moving averages and remaining 11 are oscillators. These indicator values are calculated using 4 hr candles.
DM to get details of the above analysis and list of indicator & their values used to arrive at the above conclusion.
Note: Above analysis would hold true if we do not encounter sudden jump in trade volume .
----------------------------------------------------------------------------------------
If you find the analysis useful, please like and share our ideas with the community!
- Mudrex  Long
Long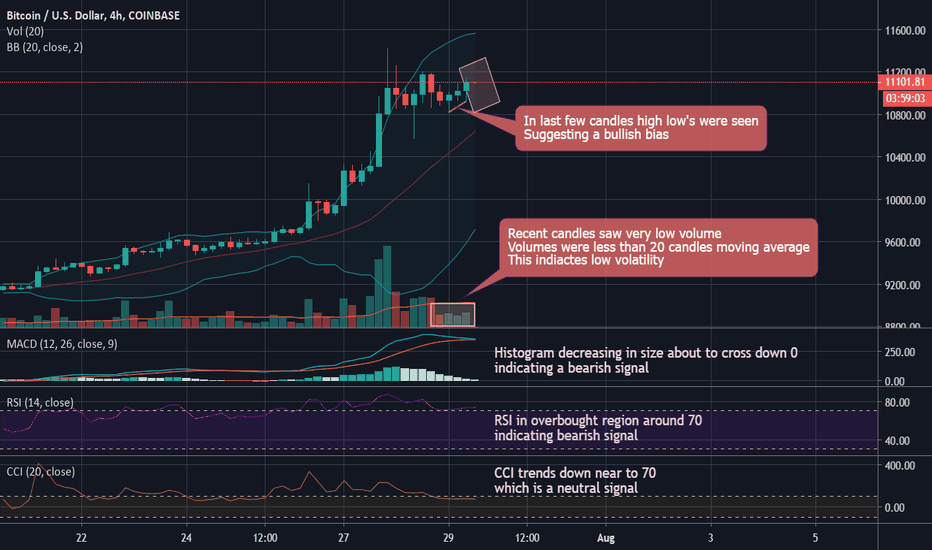
 Long
Long
Boom Hunter Pro - An Oscillator for the AgesWant to monitor the best entry and exit points in the stock market? Momentum oscillators are an excellent tool for doing so.
Due to its precise stock market monitoring, which indicates potential entry and exit locations, the Boom Hunter Pro indicator has drawn significant interest.
What is Boom Hunter Pro?
With the Boom hunter pro indicator, traders can easily monitor the market, including long and short entries. The Boom hunter pro indicator monitors the market using the Early Onset Trend (EOT) developed by John Ehler.
The Boom Hunter Pro uses the Center of Gravity Oscillator (COG) and some smoothing and roofing filter options to give customized indications.
The indicator shows oscillations for the desired entries and uses different tools to signal a variety of market trends. Below are some tools used by the Boom Hunter Pro indicator.
Understanding the Boom Hunter Pro Indicator
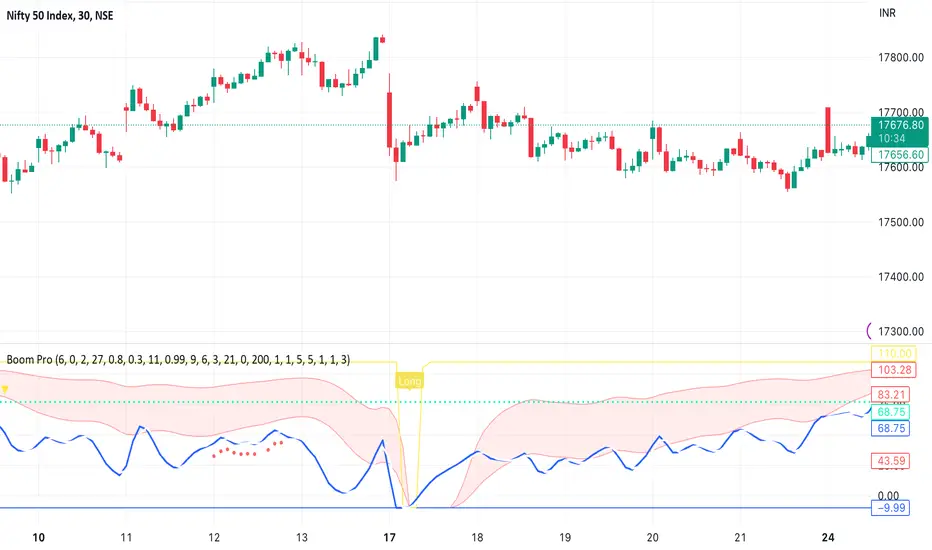
Colored Bars: The colored bars in the indicator can be specifically used to help you find a particular entry. The lime color indicates a crossover, and orange and red lines show when a stock is overbought.
Fibonacci Lines: The Fibonacci lines of the indicators keep track of the price fluctuations for particularly long or short entries or exits.
Time Frames: The Boom Hunter Pro indicator is initially set for one-hour monitoring of entries, although you can use it in any time frame at your convenience.
Relative Strength Index: The Boom Hunter Pro indicator uses the RSI analysis technique to measure the momentum of the price movement. This helps to give accurate information about the price fluctuation of a particular asset. The RSI usually fluctuates between a range of 30 to 70. When above 70, it is considered overbought, whereas below 30 is considered to be oversold.
How To Use Boom Hunter Pro Indicator
To use the boom Hunter Pro indicator, you will need to install it on your TradingView chart. Here are the steps to use this awesome indicator for your benefit.
Visit the official Boom Hunter website and download the boom hunter pro indicator code on your local system.
Next, open your TradingView charts for the stock you want to monitor.
Once the code is installed, open the search bar on your trading view chart and search for "Boom Hunter Pro."
The indicator will start appearing on your TradingView chart at the bottom.
Select the desired time frame in which you want to trade. You can choose the 15 min time frame which is the best-suited one.
Now monitor your stocks with the red, orange, and lime-colored signals shown by the indicator; that's it.
Make decisions based on the indications shown by Boom Hunter Pro and trade stocks to make high-profit returns.
The Boom Hunter Pro indicator's finest entry and exit locations for your preferred trades are now available in this simple manner.
Conclusion
The Boom Hunter Pro Indicator is a long and short-entry monitoring oscillator used by traders worldwide. Since it uses the entire concept of the Center of Gravity (COG) oscillator, traders can easily understand and use it.
However, the indications shown by the Boom Hunter Pro Indicator may only stand out to be true sometimes. Along with this, the forecasting accuracy of the indicator is not 100%. It only gives the possible entry or exit points.
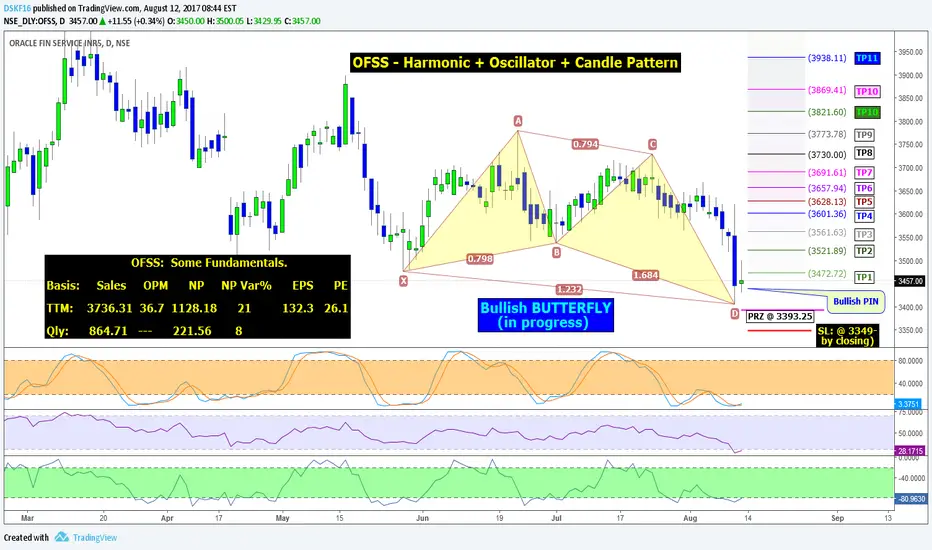
We hope you found this information about the Boom Hunter Pro Indicator useful. Use it in your investment journey to yield high-profit returns from the stock market. Happy Trading! OFSS: Reversal supported by Harmonic, Oscillator, Candle PatternOFSS - Reversal Supported by Harmonic + Oscillator + Candle Pattern,
Candle Pattern: Bullish PIN.
Harmonics: Bullish BUTTERFLY.
Oscillators & Indicators: RSI, Stoch-RSI, W%R (on Chart) & some others oversold.
....more on chart.
Go LONG: @ LTP +0.5% to -0.5%
Target for Swing / Intraday: on Snapshot.
Target for Short term: Plotted on Chart
For FnO Traders
Intraday / Swing trade levels for next trading day on-wards.
TARGET / Res: @ 3494, @ 3503, @ 3516, - @ 3525 (HZ), @ 3551
More Accumulation / SUP.: @ 3468, @ @ 3460, @ 3446 - @ 3436 (BZ), @ 3410.
Disclaimer: Only For STUDY. For Taking Trade Decision Consult Financial Advisor.
LIKE / Comment /Share, If useful & enriched your knowledge.  Long
Long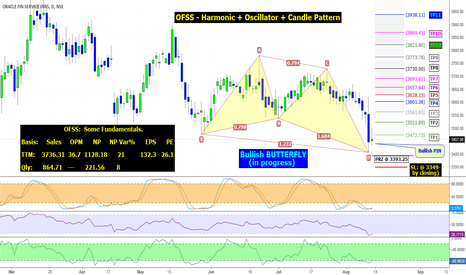
PSP Projects Ltd. (NSE: PSPPROJECT)Current Market Price (CMP): ₹836.05 (Up 8.23% in the latest session).
Following a prolonged corrective phase from its 52-week high (also ATH) of ₹1,029.90 down to a key structural low of ₹569.20, PSP Projects Ltd. has entered a decisive bullish reversal phase.
It has shown a strong recovery from its March–April 2026 lows, with the stock now trading near ₹836 after reclaiming key moving averages and witnessing improving momentum indicators. The current structure suggests a medium-term bullish continuation attempt, although some oscillators indicate short-term consolidation before the next directional move.
The trend structure currently resembles:
Accumulation → Breakout → Retest → Continuation
The stock has demonstrated:
Strong reversal from the ₹570–600 support zone
Higher highs and higher lows over recent weeks
Rising volume participation during breakout phases
Momentum improvement across RSI, MACD, and trend indicators
Chart Structural Patterns & Price Action & Technical Indicators
1. The Rounded Accumulation Base (Rounding Bottom)
The stock found structural demand between ₹570 and ₹600. The price action from Feb 2026 through May 2026 has formed a well-defined Rounding Bottom / Rounded Accumulation Base, forming a Cup and Handle pattern.
The Breakout: The recent move past the ₹780-800 milestone marks a decisive breakout from this accumulation curve.
EMA: Trading above all short, medium and long term moving averages. Recently 20EMA crossed above 50EMA, confirming bullish setup. This crossover is generally considered, a medium-confidence buy signal.
RSI: The RSI appears to be trading around the 60-63 zone after cooling off from overbought territory near 70 in early May.
MACD: The MACD indicator recently generated a bullish crossover and remains above the zero line.
ADX: The ADX has bottomed out and is beginning to curl upward beyond 20.
Bull Case: The bullish outlook confirms as long as:
Price sustains above ₹800
RSI remains above 50
MACD stays positive
Conservative traders can buy on daily close above ₹868-870; risk traders can buy now.
Potential Upside Targets
Target 1 (easier): ₹900-930 (strong resistance zone)
Target 2 (medium): ₹1,000-1,030 (will meet ATH)
Target 3 (risky): ₹1,080 only possible if momentum continues beyond ATH and breakout sustains.
Stop Loss: Daily closing below EMA support zone (around ₹760–₹770) and would invalidates this breakout setup.
Bear Case: The structure weakens if:
Price falls below ₹760
EMA bullish crossover fails (20EMA & 50EMA)
RSI breaks below 45
This could trigger, deeper correction toward ₹680–700
Happy Trading
Disclaimer: This article is for informational and educational purposes only and does not constitute financial advice or a recommendation to buy or sell any stock. Technical analysis, including the study of RSI, SMA study, MACD patterns, is based on publicly available information and on historical data, which does not guarantee future results. I am not a SEBI-registered financial advisor, and Investors should conduct their own research or consult with a SEBI-registered financial advisor before making any investment decisions. Investments in the securities market are subject to market risks; read all the related documents carefully before investing.  Long
Long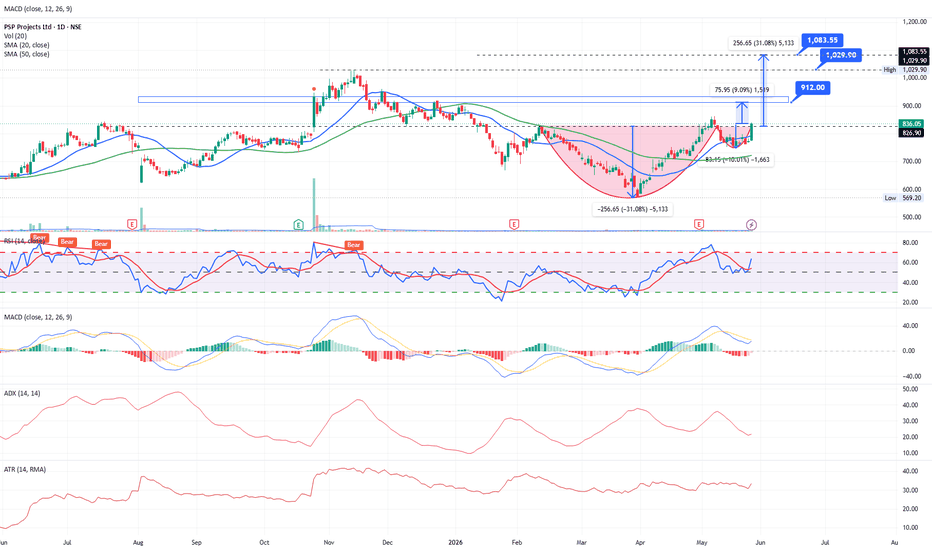
 Long
Long
 Long
Long
 Long
Long
 Long
Long
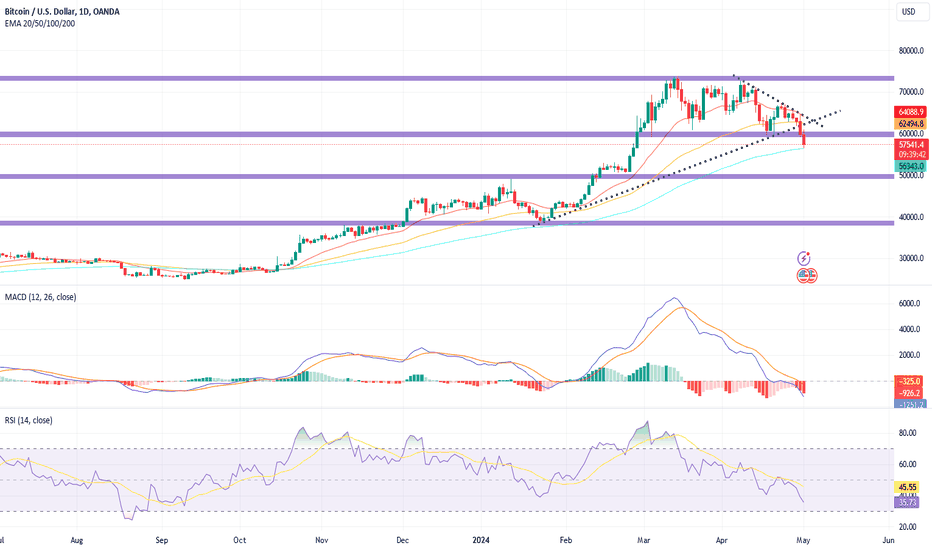
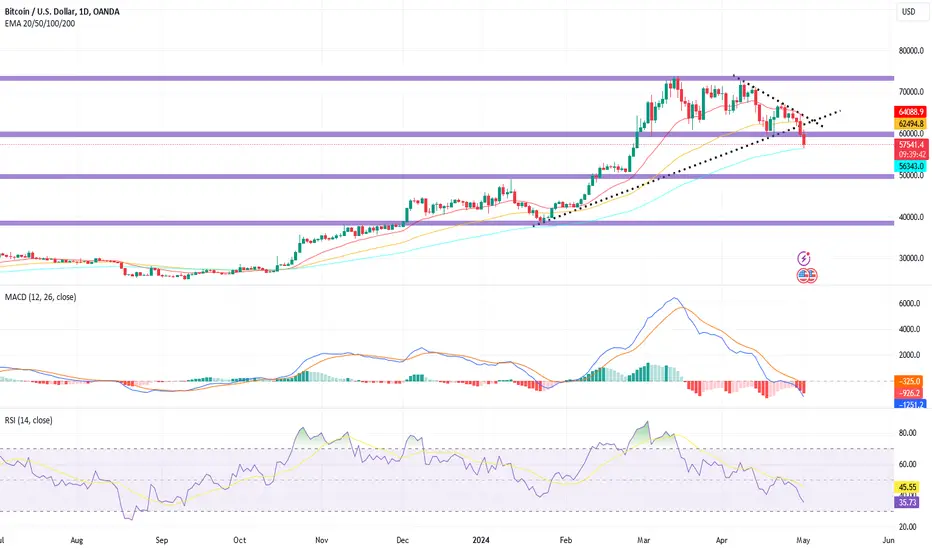
Bitcoin Price Prediction And Oscillators EvaluationIn particular, Bitcoin has successfully surpassed the $60,000 mark, which had served as significant psychological and technical support during the 2024 bull market. Nevertheless, the ascending trendline was broken and started to decrease due to the 20-day and 50-day EMA's dyynamic push from upside. This deterioration has heightened the pessimism in the market.
The chart shows Bitcoin dropped 3.72% in intraday to about $57,580 (At press time), with the 100-day Exponential Moving Average (EMA) very nearby. Schiff also cautions that if the price remains consistently below this moving average in the coming sessions, it would confirm the bearish trend and could bring an end to the current rally, possibly ending the bull market for the foreseeable future.
Bitcoin Price Prediction And Oscillators Evaluation
If Bitcoin is unable to reach the $60,000 mark again from a technical perspective, the next significant level of support is at $51,950. This signifies a notable decrease from recent peaks, and dropping to this point could spur more selling.
However, a bounce back from the present levels needs to surpass the $60,000 resistance to dispel the negative outlook. If Bitcoin manages to surpass this level, it may try to break through resistance levels around $64,000 and $66,000, bringing some hope to bullish investors.
According to the oscillators, the BTC asset is displaying bearish characteristics as MACD has sloped below zero line, which is at -1250.4. Meanwhile, the RSI is falling smoothly taking rejection from 14-SMA, which is robustly implying that the BTC asset is losing momentum and can achieve lower level. Short