Zigzag in Play- Can Wave C deliver the goods for ESCORTS KUBOTA?ESCORTS KUBOTA – A Zigzag Taking Shape
Structure Summary:
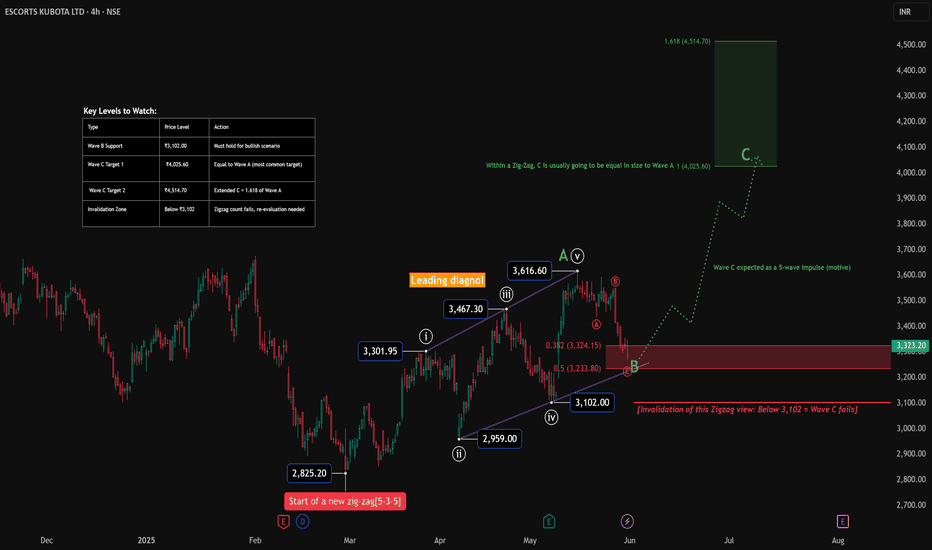
ESCORTS may be unfolding a classic Zigzag correction (5–3–5) from the low at ₹2,825.20. Wave A formed a clean leading diagonal. Wave B is currently developing and is expected to end near the 0.382–0.5 retracement of Wave A.
If this structure holds, we could soon see a powerful Wave C impulse aiming for the 4,000+ zone.
Elliott Wave View:
Wave A : Leading diagonal from ₹2,825.20 to ₹3,616.60
Wave B : Still developing – may complete near ₹3,233.80 (0.5 retracement)
Wave C : Expected to be a 5-wave impulse targeting:
₹4,025.60 (1.0 × Wave A)
₹4,514.70 (1.618 × Wave A)
Key Levels to Watch:
Wave B Support Zone: ₹3,233–₹3,102
Target 1: ₹4,025.60 (equal to Wave A)
Target 2: ₹4,514.70 (1.618 × Wave A)
Invalidation : Below ₹3,102 → Zigzag scenario fails, alternate count required
Note:
Wave C, if it triggers, should develop as a 5-wave impulse. Price action around the retracement zone will decide whether bulls still have control.
Disclaimer:
This is part of the educational WaveTracker series. It is not a trading recommendation.
Always DYOR and manage risk wisely.
Search in ideas for "zigzag"
zigzag correction in BANKNIFTY ELLIOTT WAVE ANALYSIS:-
View-1:-
It seems that a zigzag wave has completed.
A bounce back looks like connecting correction wave B is forming, a little bounce back may happen to form a connecting waves in a correction form.
View-2:-
It seems that a zigzag wave has completed.
An impulse wave was emerged and an impulse 1st wave was completed and a corrective 2nd wave was completed it seems to be an emerging of impulse 3rd wave .
Expected a reasonable bounce back if the 43600 level sustains. If the level break and go down then there will be another zig zag formation may take place.
T1=44439
T2= 44586
T3=44957
T4=45274-45615
For View 2 stop loss will be 43600.
For wave 1 there will be no stop loss.
i'm not a SEBI registered advisor. Before taking a trade do your own analysis or consult a financial advisor.
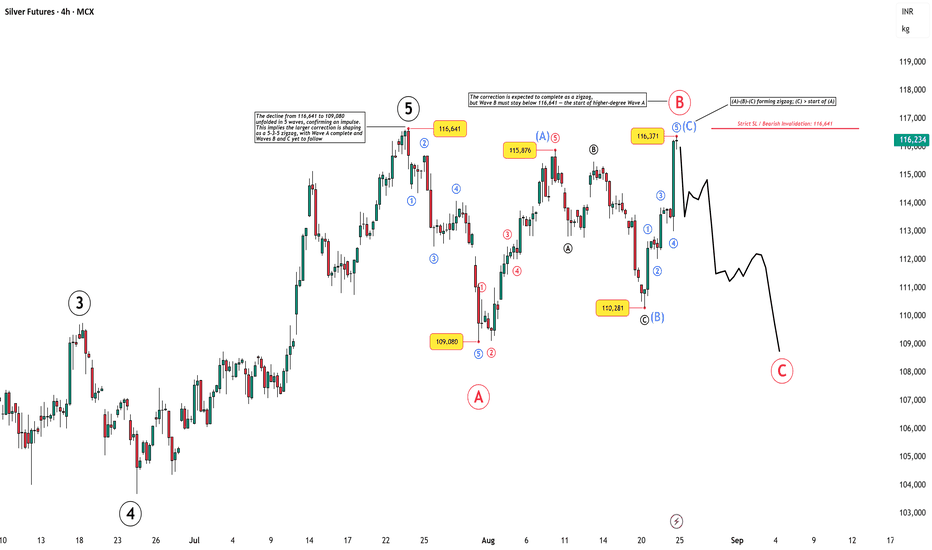
Silver Futures (4H) – Zigzag Correction in ProgressThe decline from 116,641 → 109,080 unfolded in 5 waves, confirming an impulse. This sets the stage for a 5-3-5 zigzag correction . With Wave A complete, the market is now advancing in Wave B, expected to resolve as a zigzag.
A strict bearish invalidation level is marked at 116,641 . As long as prices remain below this level, the expectation is for Wave C down to follow and complete the zigzag sequence.
📌 Key Levels:
Invalidation (SL): 116,641
Wave B unfolding as zigzag
Wave C down expected next
Disclaimer: This analysis is for educational purposes only and does not constitute investment advice. Please do your own research (DYOR) before making any trading decisions.
Reliance Industries – Short-Term Bounce, Bigger Zigzag UnfoldingWave Structure
The decline from the all-time high at 1608.80 to 1114.85 unfolded in a clean 5-wave impulse. Rather than a completed W–X–Y correction, this is best viewed as Wave A of a higher-degree zigzag (5-3-5).
The subsequent rally into 1551 was a clear 3-wave move, marking Wave B . With this structure, the larger Wave C is now favored to be unfolding to the downside.
Current Setup
The drop from 1551 is impulsive, not corrective, which supports the case that Wave C is already in progress.
Price is testing the MA200 and printed bullish RSI divergence (higher lows on RSI vs. lower lows on price), suggesting near-term exhaustion.
This favors a short-term Wave 2 bounce before further downside unfolds.
Outlook
Short-term (bullish): Relief rally toward 1390–1420 possible as Wave 2 plays out.
Medium-to-long term (bearish): Once Wave 2 completes, downside is expected in Wave 3–4–5 of C, with potential targets revisiting 1100 or lower.
Invalidation: A sustained break above 1551 negates the bearish outlook and would suggest the correction has already ended.
Summary
Short-term: Bounce likely.
Big picture: Bearish zigzag not yet complete.
Disclaimer: This analysis is for educational purposes only and does not constitute investment advice. Please do your own research (DYOR) before making any trading decisions.
Bandhan Bank Low Risk High Reward Tripple ZigzagDISCLAIMER:There is no guarantee of profits or no exceptions from losses. The investment study provided is solely the personal views of my research. You are advised to rely on your judgment while investing/Trading decisions. Past performance is not an indicator of future returns. Investment is subject to market risks. Seek help of your financial advisors before investing/trading.
I may or may not trade this analysis
--------------------------(((((LIKE)))))-------------------------------
I am holding this stock so my analysis could be biased. So do your own study or ask your financial advisors before investing.
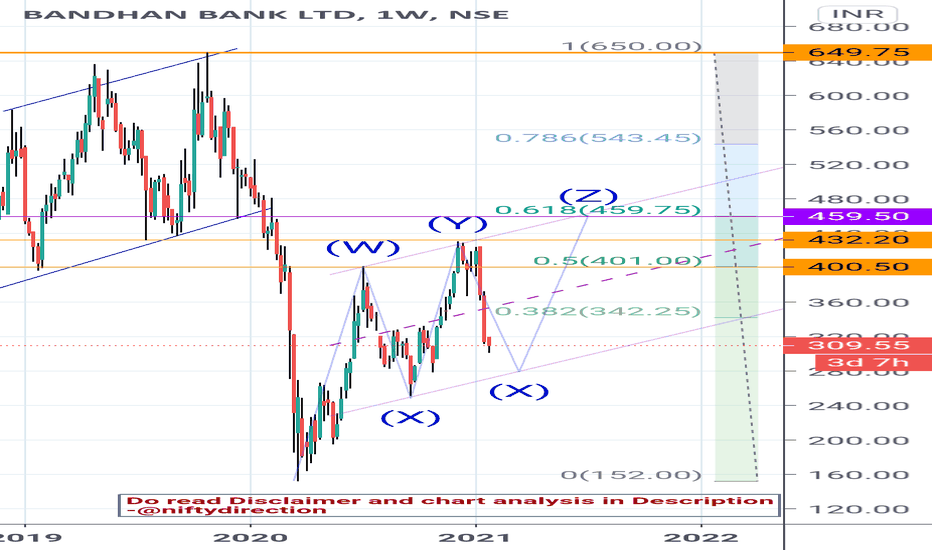
Bandhan Bank in parallel channel right and making Tripple Zigzag pattern, now looks in longer consolidation zones, it will take time to come out of it.
Long can be initiated near 280 Stop loss 250 for targets 450-480.
After that another dip can be seen then it would give breakout of channel.
zigzag wave ccurrent structure: zigzag 5-3-5
current leg:wave c sub wave 5 sub wave 2(this should form an ending diagonal)
typical target zone for zigzag wave c is between 100-123.6% extention
over here internal structure is supporting zigzag correction pattern but wave b has retraced wave a by 80%, where in a zigzag pattern wave b will not retrace wave a by more 61.8%,hence over here target for wave c can be taken between 61.8-100% extention level of wave a,also channel support is coming at 61.8% extention level.
one should look to enter at 61.8% extention level that to partially once additional reversal sign are seen in that zone.Until then avoid getting long.
DISCLAIMER:There is no guarantee of profits or no exceptions from losses. The study provided is solely the personal views of my research. You are advised to rely on your judgment while investing/Trading decisions. Past performance is not an indicator of future returns. Investment is subject to market risks. Seek help of your financial advisors before investing/trading.
I may or may not trade this analysis
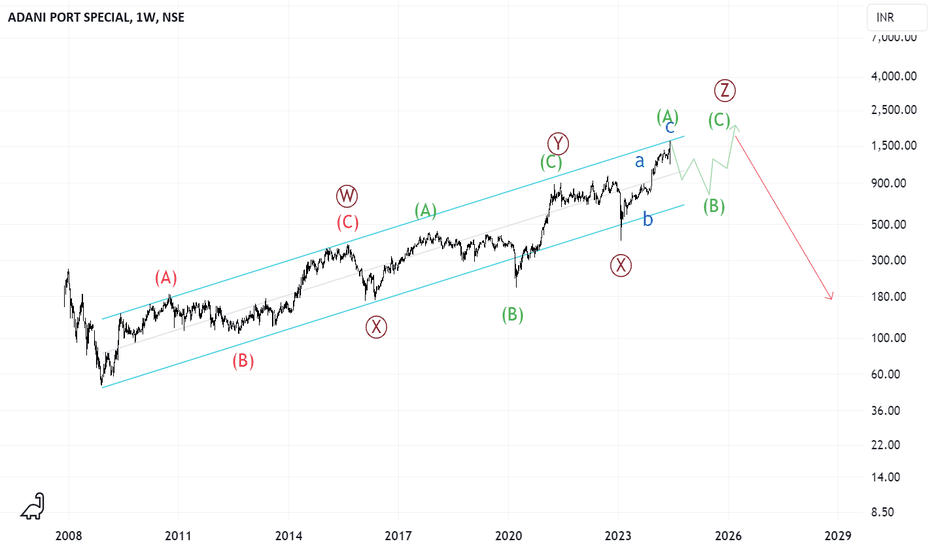
Shalby - Double Zigzag WXY Pattern
Stock completed its first Primary Degree wave on 24 Jan 2024 and has been undergoing correction ever for nearly 2.5 years .
The correction is a double zigzag which results in deep correction. Double zigzags are numbered WXY. W represents the first zigzag, X being a counter wave and Y being second zigzag.
Stock completed its first zigzag during mid June 2025 (i.e. Wave W) and counter wave on 22 Sep 25 (i.e. Wave X).
It appears that stock has completed only Wave A of Wave Y as given in the chart.
Wave 1 was a 5-wave sequence
Wave 3 was an Sub-wave 1 extension and formed at 1.414x of Wave 1
Wave 5 formed at 50% of the length of Wave (1-3).
Further, it appears that Stock has completed Wave B of Wave Y during early June 2026. If this is the case, then stock must form a lower low or an equal low and complete Wave C, i.e. one may expect the stock to complete wave C at about 126 levels or lower.
Hindustan Zinc (1H): Clean Zigzag – Bounce Incoming?From 732.70 to 543.55 as blue (A):
Clear sharp fall. Strong selling. RSI went deep into oversold zone. Looks like a completed higher-degree wave (A).
From 543.55 to 643.20 as black (a):
The bounce from the lows moved in a proper five-wave structure. It did not look random. Structure supports it being wave (a).
From 643.20 to 582.60 as black (b):
This correction unfolded as a clean zigzag. Inside this, red wave c matched almost 100% of red wave a measured from red wave b. That kind of symmetry is typical in zigzags and strengthens the count.
As long as 583.30 holds, black wave (c) can move higher, possibly towards the 660–665 zone. That area is the 0.618 retracement of the entire blue (A) fall.
But this upside, if it comes, may still be corrective before a larger blue (C) move down.
583.30 is important support.
Disclaimer: This analysis is for educational purposes only and does not constitute investment advice. Please do your own research (DYOR) before making any trading decisions.
BITCOIN: Elliott Wave & ChannelGreetings, everyone.😉
I would like to present a scenario for your consideration, grounded in "Elliott Wave Theory" .
✔️ Wave initiated from the 15K level: Classified as a "Double Zigzag"
✔️ Current wave in development: Y-c-3
✔️ Projected upward range: 93K ~ 101K
The rationale behind this analysis is as follows:
Zigzag patterns typically move within a parallel channel.
The first zigzag wave, which started from the 15K level, adhered precisely to this parallel channel.
As a result, the likelihood of a complex correction occurring is considerably high.
Based on these observations, I have constructed this particular scenario. It is an illustrative representation of potential market behavior, grounded in established technical principles.
Wishing you all the best of luck🍀
This is not a buy or sell recommendation.
It is a personal perspective and should be used for reference only.
All decisions and responsibilities lie with you.
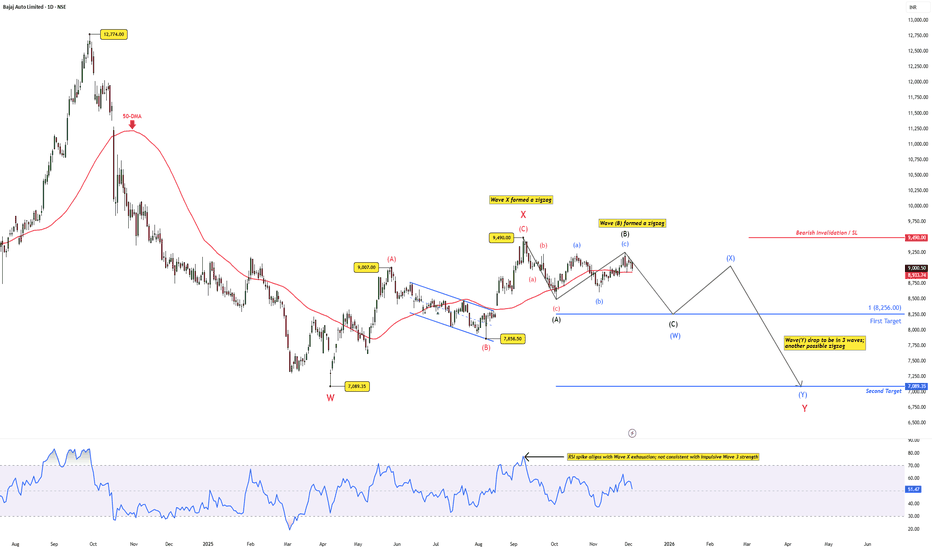
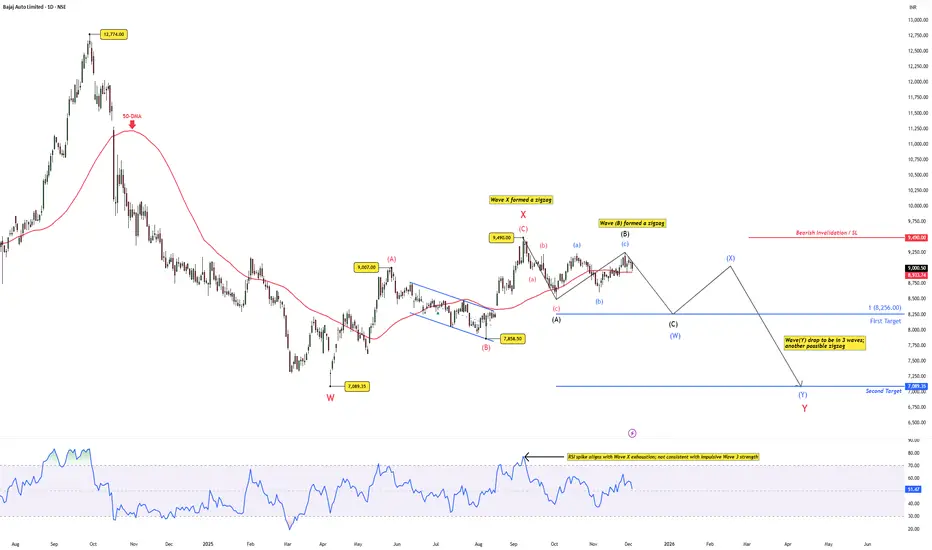
Bajaj Auto: A Chain of Zigzags Still Pointing LowerThe push to ₹9,490 looked like strength, but the internal map is clear — this entire structure is a zigzag , not an impulsive trend.
The rally into ₹9,490 is a classic Wave X zigzag , confirmed by RSI giving a sharp overbought spike and then immediately fading. That’s exhaustion, not Wave 3 behaviour.
Inside the larger Double Zigzag (W–X–Y), price has now completed Wave (B) of (W) in Wave Y.
Wave (W) of Y is still forming. After (W) completes, a small (X) bounce remains possible before the final (Y) leg lower.
Key Levels:
Target 1: ₹8,256
Target 2: ₹7,089
Invalidation: ₹9,490
As long as price stays below ₹9,490, the multi-zigzag structure remains the dominant path.
Disclaimer: This analysis is for educational purposes only and does not constitute investment advice. Please do your own research (DYOR) before making any trading decisions.
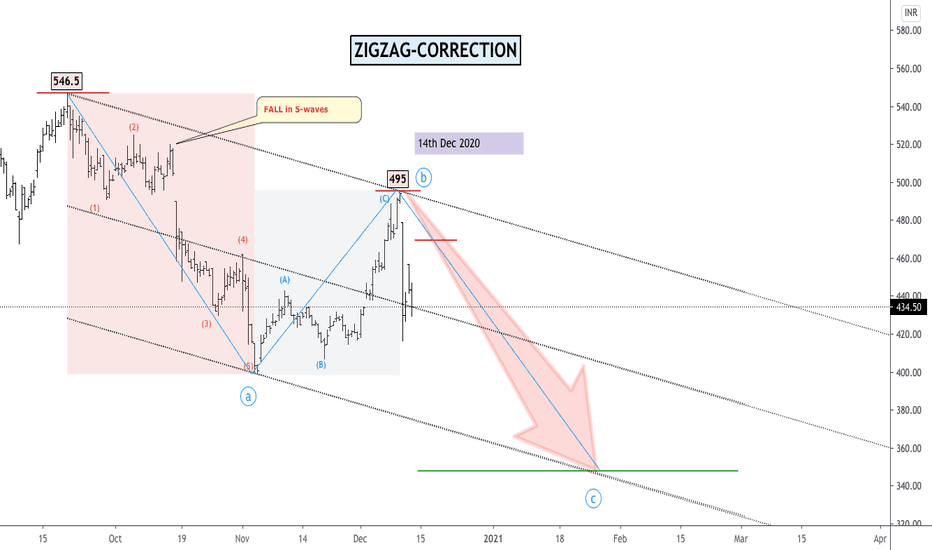
Real time example [zigzag] [Education]Let's talk about each waves of zigzag
Our first question is, What is the Zigzag?
In chart, a, b and c is zigzag which very easy to understand by picture.
Its really easy to understand this wave counting if you read just below basic rules and Characteristics of Zigzags.
Rules:
- Wave A always subdivides into an impulse or leading diagonal .
-Wave A always subdivides into an impulse or leading diagonal .
- Wave B always subdivides into a zigzag , flat, triangle or combination.
- Wave C always subdivides into an impulse or diagonal triangle.
NIFTY: Double Zigzag (WXY) Correction | Converging Triangle in XNSE:NIFTY
🌊 NIFTY: Double Zigzag (WXY) Correction | Converging Triangle Developing in Wave X
NIFTY appears to be unfolding a Double Zigzag (WXY) corrective structure. The first corrective leg, Wave W, has already completed as a Single ABC Zigzag, setting the stage for the current Wave X.
According to this wave count, Wave X is developing as a Converging Triangle (ABCDE). At present, waves (a), (b), (c), and (d) appear to be complete, while wave (e) is expected to be the final leg before the triangle finishes.
The triangle remains valid as long as price continues to respect its converging boundaries. However, there are two important invalidation conditions to monitor:
👉 Upper Invalidation: A sustained move above 24,532 before completing wave (e) would invalidate the current triangle structure.
👉 Lower Invalidation: If price falls below 23,069 before forming wave (e), this triangle scenario also becomes invalid, suggesting that Wave X may have already ended or an alternate correction is unfolding.
If the triangle completes successfully with wave (e), the next move would likely be the beginning of Wave Y of the larger WXY correction.
One important point to remember is that Wave Y is itself a corrective wave, meaning it does not have to be a simple zigzag. It can develop in several different corrective forms, including:
• Single, Double or Triple Zigzag
• Regular, Expanded or Running Flat
• Converging, Expanding, Barrier or Running Triangle
• Complex Combinations such as WXY or WXYXZ
This is why Elliott Wave analysis should always remain flexible. While the larger roadmap may be identified, the exact internal structure of the next corrective wave is confirmed only as price unfolds.
For now, NIFTY remains inside a contracting corrective pattern. The completion of wave (e) will be the key event to watch before expecting the next significant move.
Key Levels:
🔴 24,532 → Upper invalidation for the current triangle scenario.
🔴 23,069 → Lower invalidation if broken before wave (e) completes.
*******************************************************************************
⚠ Disclaimer:
This analysis is for educational purposes only and represents one possible Elliott Wave interpretation. Always wait for price confirmation and manage risk appropriately.
*******************************************************************************
#ElliottWave #DoubleZigzag #WXY #WaveX #WaveY #ConvergingTriangle #TrianglePattern #CorrectiveWaves #WaveAnalysis #TechnicalAnalysis #PriceAction #MarketStructure #TradingEducation #TradingView #Nifty #Nifty50 #NSE #SwingTrading #PositionalTrading #StockMarket #ChartAnalysis #NikhilKanal
IGL: Wave C unfoldingIt seems that after Impulse down we are now in a corrective phase which is unfolding as Zigzag. We have completed Waves A & B so far and Wave B retracement is around 0.618. So now we might be going for Wave C which can extends 100% of Wave A. This gives a logical target around 540-545 levels.
M
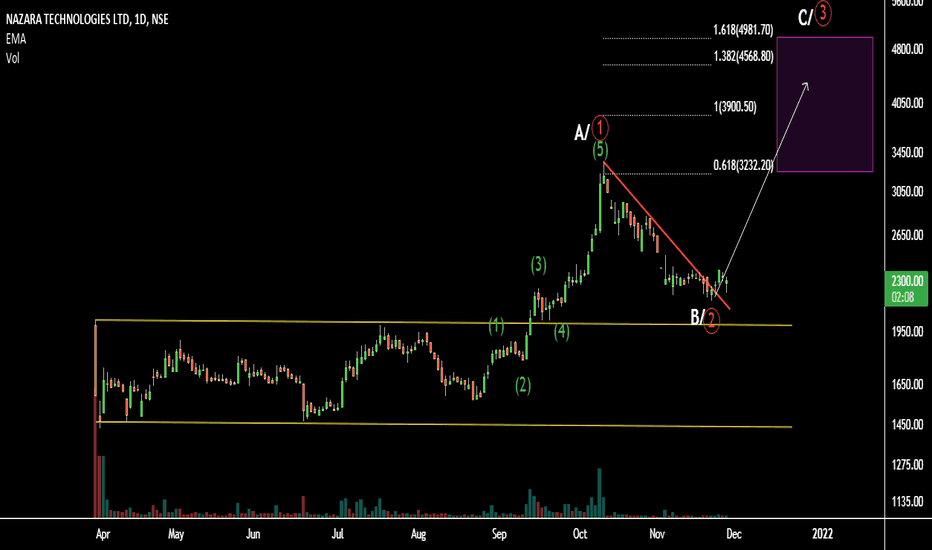
Start of New Impulse wave 3 or Zigzag C.Go longNazara technologies crossed it's listing day high on 14-09-2021,post which it has shown impulsive rise in 5 wave,after completing 5 waves,it has retraced back to 61.8% of prior impulse meaning forth coming move can be either impulse wave 3 of higher degree or an wave C of zigzag.In either case one can long at cmp of 2300 with a closing stop-loss of 2150.
Conservative Target for zigzag wave C is coming between 3232-3900
Ideal target for zigzag wave C is coming at 3900
Ideal target for impulse wave 3 of higher degree is coming at 4980.
Risk reward is looking extremely favourable at this stage and stock has breached it's down sloping trendline that it made during corrective wave B/2.
Disclaimer:Analysis done here is just for my future reference,no position should be build or squared off on it's basis.
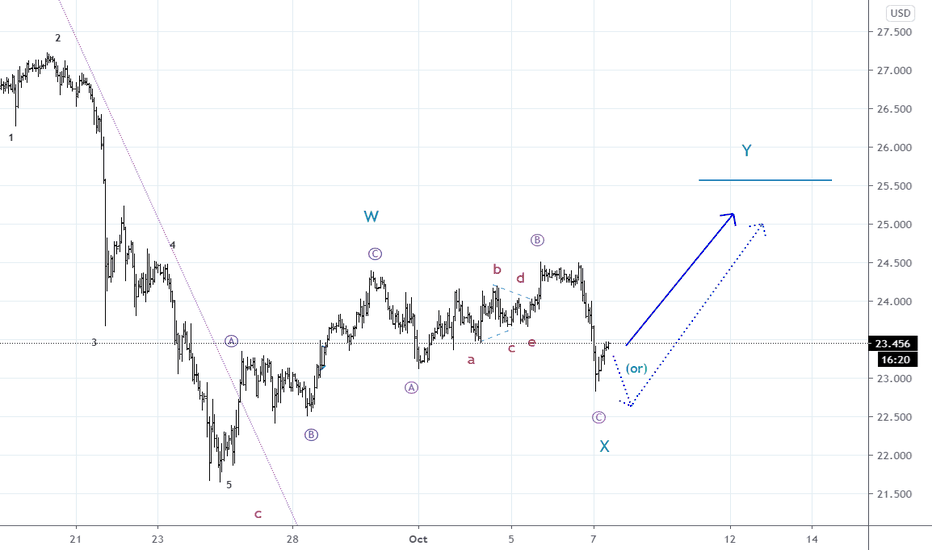
#Silver # XAGUSD ZigZag correction should lead to Wave C upThe past few days of price action in #silver is part of the larger upward correction and now looks like the last part of Wave c (circle) of X is completing. This should have already ended or will end with a quick peek below the yesterday's low. We should be then headed upward in Wave Z to complete the upward correction TVC:SILVER