Nifty Has Repeating Seasonal Patterns Most Traders Never ChartNifty Has Repeating Seasonal Patterns Most Traders Never Bother to Chart.
Markets are driven by fundamentals and flows — but certain calendar patterns have repeated often enough across cycles that ignoring them completely means ignoring real historical data.
Seasonality studies how an index has historically performed during specific calendar periods — months, festive periods, or around specific recurring events — across many past years, looking for statistically meaningful tendencies rather
Seasonality
GLAND has explosively broken out of a multi-year macro base1. The Macro Perspective: The Deep Washout and Multi-Year Accumulation
I am taking a LONG bias on Gland Pharma Limited (GLAND) on the weekly (1W) timeframe.
When analyzing pure market structure, the most powerful and sustainable secular trends are born from grueling, exhaustive accumulation phases. Look at the massive structural development spanning this entire chart. After a massive historical markdown phase, the stock spent over two years locked in a brutal macro accumulation base. This prolon
AVALONhas explosively broken out of a massive ascending triangle1. The Macro Perspective: The Institutional Staircase
I am taking a LONG bias on Avalon Technologies Limited (AVALON) on the weekly (1W) timeframe.
When analyzing pure market structure, the most powerful and sustainable breakouts occur in alignment with an established macro trend. Look at the massive structural development on this chart. The defining feature is the steep, unbroken ascending trendline (the lower solid black line). Every single time the stock experienced a pullback, institutional
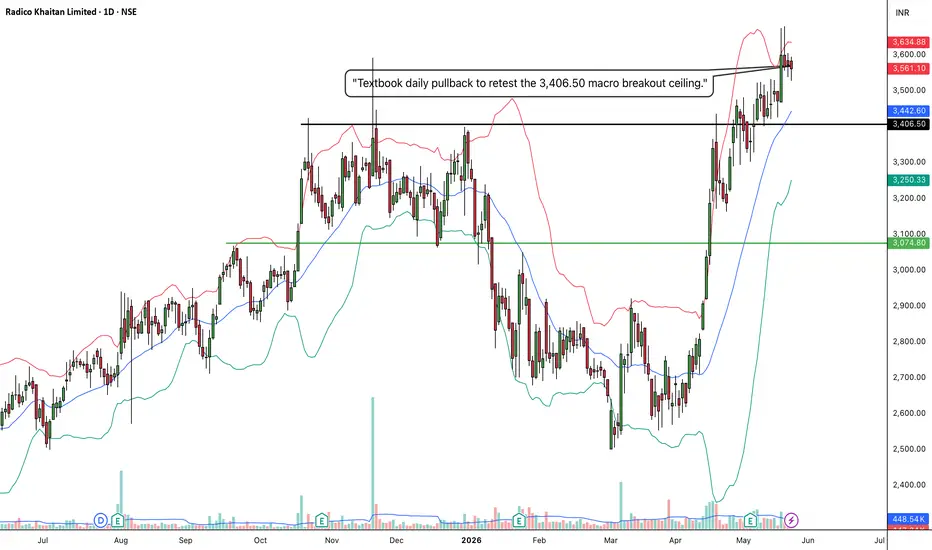
RADICO: Daily Break & Retest1. The Macro Perspective: The Massive Accumulation Cup
I am taking a LONG bias on Radico Khaitan Limited (RADICO) on the daily (1D) timeframe.
When analyzing pure market structure, sustainable long-term trends do not move in a straight line; they breathe through cycles of expansion and compression. Look at the extensive structural development displayed across Screenshot 2026-05-23 at 17.07.29.jpg. After a major markup phase that topped out in late 2025, the stock underwent an extensive correctiv
SHILPAMED: Monthly Macro Base Breakout1. The Macro Perspective: The Multi-Year Consolidation Base
I am taking a LONG bias on Shilpa Medicare Limited (SHILPAMED) on the absolute macro monthly (1M) timeframe.
When analyzing pure market structure on a monthly chart, we are looking at the footprint of long-term institutional accumulation. Look at the staggering structural development displayed across Screenshot 2026-05-26 at 14.44.51.jpg. After a major rally through mid-2024, the stock entered a broad, multi-year horizontal range. This
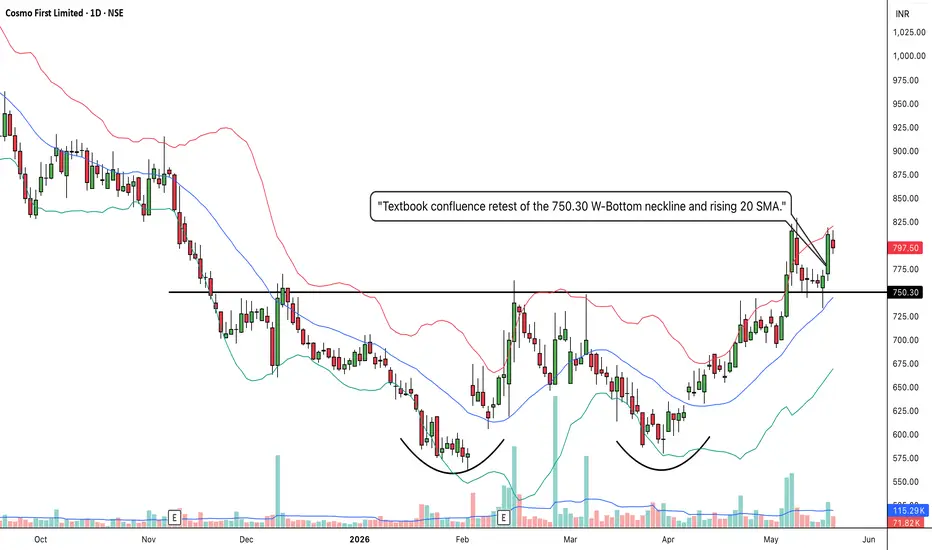
COSMOFIRST: Massive W-Bottom Base and Textbook Confluence Retest1. The Macro Perspective: The Washout and the W-Bottom
I am taking a LONG bias on Cosmo First Limited (COSMOFIRST) on the daily (1D) timeframe.
When analyzing pure market structure, the most reliable reversals are born from deep, agonizing accumulation phases. Look at the structural development on the lower half of this chart. After suffering a brutal markdown phase that dragged the price into the 500s and completely washed out weak hands, heavy institutional capital stepped in. I have explicitl
PFC: The Ultimate Bear Trap, Box Breakout, and Textbook Retest1. The Macro Perspective: The Digestion Box
I am taking a LONG bias on Power Finance Corporation Limited (PFC) on the weekly (1W) timeframe.
When analyzing pure market structure, massive momentum runs require massive digestion phases. Look at the structural development on the left side of this chart. After a historical parabolic run-up, the stock naturally exhausted itself. But instead of entering a multi-year bear market, institutional buyers established a massive horizontal consolidation zone
RPRX: Explosive Macro Breakout and Multi-Year ReversalThe Setup (Bias): I am taking a LONG bias on Royalty Pharma plc (RPRX) on the macro monthly (1M) timeframe.
The "Why" (Technical Reasons): 1. Historic Structural Reversal: Zooming out to the monthly timeframe reveals the true magnitude of this turnaround. After a prolonged downtrend into a clearly defined accumulation box at the lows, the price has mounted a massive V-shaped/rounding recovery. It has now forcefully broken out, cleanly slicing through the heavy macro resistance ceiling at 46.71.
ANGELONE: Daily Box Breakout1. The Macro Perspective: The High-Level Accumulation Box
I am taking a LONG bias on Angel One Limited (ANGELONE) on the daily (1D) timeframe.
When analyzing pure market structure, explosive vertical moves must eventually be digested. Look at the extensive structural development displayed on this chart. Following a massive, nearly vertical markup phase that initiated in late March, the stock naturally became overextended and needed to breathe. Instead of collapsing and surrendering those gains,
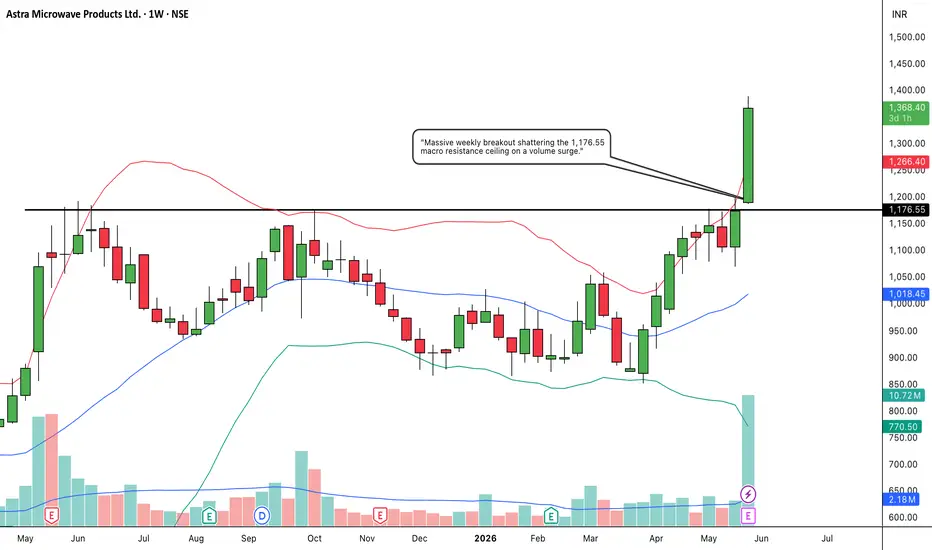
ASTRAMICRO: Weekly Macro Base Breakout1. The Macro Perspective: The Multi-Year Accumulation Phase
I am taking a LONG bias on Astra Microwave Products Limited (ASTRAMICRO) on the weekly (1W) timeframe.
When analyzing pure market structure, the most powerful and sustainable trends are born from prolonged high-level consolidation patterns. Looking at the structural development in Screenshot 2026-05-26 at 14.35.15.jpg, the stock has spent roughly a year building a massive macro base. After a previous secular markup phase that topped ou
GRANULES: Weekly Macro Cup Breakout1. The Macro Perspective: The Deep Washout and Rounding Base
I am taking a LONG bias on Granules India Limited (GRANULES) on the weekly (1W) timeframe.
When analyzing pure market structure on a macro level, the most powerful and sustainable trends emerge from deep, well-rounded accumulation structures. Look at the comprehensive development displayed in Screenshot 2026-05-23 at 17.10.58.jpg. After hitting a major structural peak in mid-2024, the stock entered a long, grueling digestion cycle that
JBCHEPHARM: Weekly ATH Breakout1. The Macro Perspective: The High-Level Accumulation Base
I am taking a LONG bias on JB Chemicals & Pharmaceuticals Limited (JBCHEPHARM) on the weekly (1W) timeframe.
When analyzing pure market structure, the strongest macro setups occur when a stock undergoes a healthy, multi-month consolidation right beneath its lifetime highs. Look at the comprehensive structural development displayed in edited-image.png. After carving out a major top in mid-2024, the stock underwent an extensive corrective
JLong
Next Vicennium of GoldBefore you start reading, these for my own notes with more polish than government polices yet not matching accounting covers of cooperates.
i hope you day goes well
1972
TVC:GOLD Gold pegged to 38 USD Per ounce, Fed had no gold to back so they broke Bretton Woods System dismantling the artificial suppression of gold for 30 years. GOLD jumped to 120 by mid 1973 due US President Nixon
1976
US recession over, Gold safe heaven asset lost or in words hedge against bad turns of economy was
SANSERA: The Perfect Ascending Channel and Confluence Bounce1. The Macro Perspective: The Institutional Staircase
I am taking a LONG bias on Sansera Engineering Limited (SANSERA) on the daily (1D) timeframe.
When analyzing pure market structure, the most sustainable and lucrative trends do not go straight up vertically; they move in structured waves. Look at the massive structural development spanning this chart. I have highlighted a textbook "Ascending Channel." This pattern is the ultimate footprint of methodical, long-term institutional accumulation.
PRECOT has explosively broken out of a massive multi-year macro 1. The Macro Perspective: The Multi-Year Secular Base
I am taking a LONG bias on Precot Limited (PRECOT) on the absolute macro monthly (1M) timeframe.
When analyzing pure market structure on a monthly chart, we are observing the true footprints of heavy institutional capital. Look at the staggering structural development spanning this entire chart. After a dormant decade of accumulation, the stock initiated a violent markup phase in 2021-2022. However, parabolic runs require deep digestion. Over
CANBK: Multi-Year Rounding Bottom and Textbook Macro Retest1. The Macro Perspective: The Decade-Long Washout and Recovery
I am taking a LONG bias on Canara Bank (CANBK) on the absolute macro monthly (1M) timeframe.
When analyzing pure market structure on a monthly chart, we are looking at cycles that take years to play out. Look at the massive structural development spanning the entire chart. The stock suffered a brutal, agonizing markdown phase that lasted for years, dragging the price all the way down to a concrete floor near the 10-20 zone. This dee
BIOCON: Ascending Triangle Breakout1. The Macro Perspective: The Secular Trendline Defense
I am taking a LONG bias on Biocon Limited (BIOCON) on the weekly (1W) timeframe.
When analyzing pure market structure, the most powerful and sustainable breakouts occur in alignment with an established macro trend. Look at the massive structural development on this chart. The defining feature is the steep, unbroken ascending trendline originating from the bottom left. Every single time the stock experienced a deep, agonizing pullback, inst
BTCUSD · 15M · SMC UpdateBuy-side liquidity above prior highs has been partially swept.
Rejection from supply shows acceptance failure in premium.
Market is now rotating back toward equilibrium.
LTF Structure
Impulsive move up completed.
Bearish response from supply with follow-through.
Current pullback is corrective, not impulsive.
Bias & Expectation
Favor shorts while price remains below the supply high.
Anticipate continuation lower toward:
Range low / EQ
Prior imbalance
HTF discount zone below
Infosys (W): Bullish - Coiling Pre-BreakoutTimeframe: Weekly | Scale: Logarithmic
The stock is in the final stages of a consolidation pattern, trading just below a multi-year resistance zone. The setup is a classic "absorption" phase , where buyers are soaking up supply before an imminent breakout, fueled by sector tailwinds.
🚀 1. The Fundamental Catalyst (The "Why")
The technical strength is supported by a major shift in sentiment:
> Accenture Q1 Results: The global IT giant recently reported strong numbers and raised guidance,
If you ignore this than it's your choice INDEX:BTCUSD
I am also shocked
every November closed in green in Year on year based than november near to end then it means v shape bounce is ready to in 6 days
please do your own research before taking any trade.
i am not financial advisor
risk is real stay practical
please feel free to ask any questions
Pilani Investment and Industries Ltd – DailyMarket Structure:
Price is currently in a bullish market structure, forming a series of higher highs and higher lows after breaking previous internal structure. The recent pullback appears to be a retracement into a discount zone, aligning with potential demand area.
Point of Interest (POI):
A clear demand zone is visible around ₹5,200–₹5,300, where price previously showed strong bullish reaction. Current price action suggests liquidity sweep below recent equal lows before potential mitigation.