Long
Long
 Long
Long
 Long
Long
 Long
Long
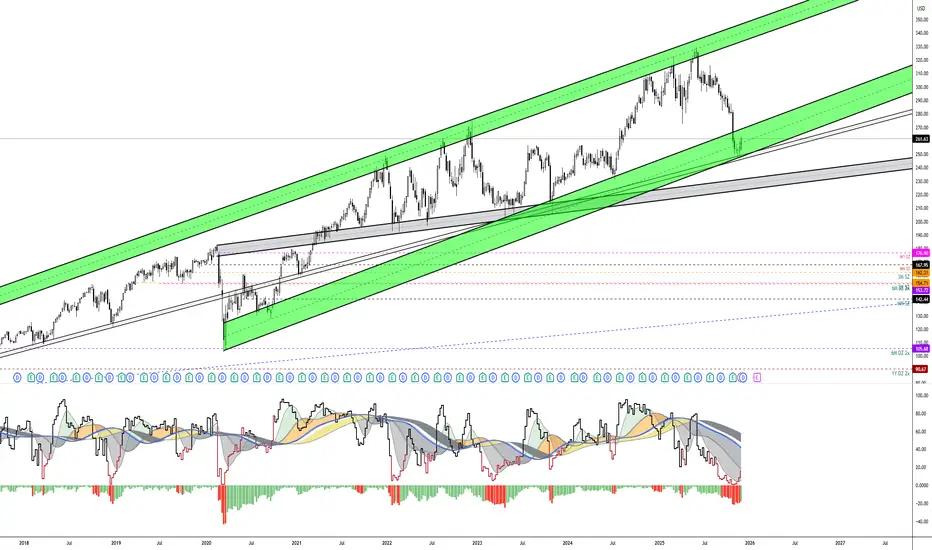
BTC vs Silver: Is This a New Major Bottom?1️⃣ BTC/Silver at Channel Support = Where Big Bottoms Formed Before 📉➡️📈**
- Every time BTC/SILVER touched the bottom of this rising channel, a major bottom followed:
- 🦠 Covid crash → huge recovery after
- 🐻 Bear‑market low of the current cycle → next bull phase started
- 🔁 Today the ratio is again sitting on that same lower trendline, which suggests we might be near another major bottom zone, not the middle of a fresh long‑term collapse.
2️⃣ RSI at All‑Time Lows = Extreme Exhaustion
- The weekly RSI for BTC/SILVER is at record low levels on this chart.
- When momentum is this oversold:
- It usually means sellers are exhausted and positioning is very one‑sided.
- Historically, extremes in the BTC–silver ratio have often been followed by mean‑reversion moves back up as risk appetite slowly returns.
This doesn’t guarantee an immediate bounce, but it strongly hints that most of the pain vs silver might already be priced in.
3️⃣ A “Different” Bull Market → A “Different” Bear Market 🤔
- Past BTC cycles often had:
- A parabolic blow‑off top, then
- A brutal −70% to −80% drawdown from the all‑time high.
- This cycle was not the same:
- ETF flows, more institutions, and more macro‑driven behavior
- Less crazy vertical move than earlier cycles
- Heavy rotation into metals while BTC cooled off instead of pure mania
Because of this, the expectation here is:
- ❌ Not a face‑melting pump straight to 300k.
- ❌ Not necessarily a textbook −70% crash like in past winters.
- ✅ More likely a “different” bear market:
- BTC consolidates, underperforms metals and some stocks
- The BTC/SILVER ratio resets at the channel bottom
- Drawdown is milder and more sideways‑grindy than previous full‑on nukes
4️⃣ Final thought for positioning 🧠
- Be prepared in case BTC does a smaller bear market.
- And at the same time, don’t be over‑exposed in case BTC still delivers a standard deep bear market like past −70% drawdowns.
Balancing those two possibilities is the key: respect the historical risk, but also recognize that this cycle’s structure and the BTC vs silver chart hint at something *less brutal* than many fear.  Long
Long
WHAT'S NEXT ON GOLDGold’s Multi-Year Rally Toward $5,000: Wave Structure, Psychological Barriers, and What Comes Next
Since early 2024, Gold has transitioned from a traditionally defensive asset into a structurally bullish, momentum-driven market. The rally has not been random or emotional; it has unfolded in distinct, impulsive waves, each followed by necessary consolidation phases. Understanding where we currently stand in this structure is critical—not only for directional bias, but for risk management and expectation setting as we move toward 2026.
This article breaks down the wave-based progression of Gold’s rally, evaluates whether the market is entering a terminal phase or another expansion leg, and outlines key levels and behaviours traders should monitor going forward.
Wave 1: The Structural Break That Changed Everything (February–October 2024)
The first strong impulse wave of the current Gold super-cycle began on 26 February 2024. This was not merely another bullish attempt—it was a structural regime shift.
Key breakout level: 2034.08
Wave 1 high: 2792.07 (28 October 2024)
Gold’s decisive break above the 2034.08 resistance confirmed a long-term bullish continuation and invalidated years of range-bound behaviour. This move established:
A clear Break-and-Hold structure
Higher highs and higher lows on the weekly timeframe
Institutional participation rather than speculative noise
By late October 2024, Gold had expanded nearly 760 points before entering its first meaningful pause. This consolidation during November–December 2024 was healthy, controlled, and characteristic of a market preparing for continuation—not exhaustion.
Conclusion: Wave 1 set the foundation. Without this break, the $5,000 narrative would not exist.
Wave 2: Controlled Expansion and Institutional Re-Accumulation (January–April 2025)
The second wave of the rally began on 13 January 2025 at 2683.79, following two months of compression and liquidity absorption.
Wave 2 high: 3504.74 (27 April 2025)
Post-wave consolidation: Approximately 4 months
This phase was notable for its orderly structure. Price respected support, pullbacks were shallow, and volatility expanded gradually. The rally stalled near 3500—not due to weakness, but due to the market needing time to rebalance after a strong extension.
The four-month consolidation that followed reinforced an important insight:
Gold was no longer reacting to short-term catalysts; it was being repriced structurally.
Wave 3: Momentum Expansion and Trend Acceleration (August–October 2025)
After months of digestion, the third impulse wave began on 24 August 2025 at 3355.79.
Wave 3 high: 4387.67 (12 October 2025)
This was the most aggressive and emotional leg of the rally so far. Characteristics included:
Strong bullish displacement
Minimal retracements
Broad participation across timeframes
Wave 3 confirmed that Gold had entered a momentum-driven phase, often associated with late-cycle trend acceleration. However, as expected, price once again paused after a sharp expansion, respecting the natural rhythm of trending markets.
At this stage, the $5,000 target entered mainstream discussion—but this is precisely where disciplined traders must slow down.
Where Are We Now? Wave 4 or Structural Pause?
As we approach the end of 2025, Gold is once again consolidating below major highs. The critical question is:
Are we beginning Wave 4 toward $5,000—or are we forming a deeper corrective phase first?
Key Considerations:
Psychological Resistance Zone
The 4000–4400 region is not just technical resistance; it is psychological and narrative-driven.
Markets often pause, retrace, or form complex structures near such levels.
Structural Risk Zone
A controlled dip below 3990, or even a deeper retracement toward prior wave support, would not invalidate the $5,000 thesis.
Instead, it could represent a final rebalancing phase before the next major expansion.
Time vs. Price
Gold has moved aggressively in price over a relatively short period.
Markets often compensate for rapid price expansion with time-based consolidation, not immediate continuation.
What to Watch Going Into 2026
Rather than predicting outcomes, traders should focus on behavioural confirmation. Here are the key signals to monitor:
Bullish Continuation Scenario:
Higher lows holding above prior wave supports
Clean break-and-hold above 4400
Strong bullish displacement with shallow pullbacks
Acceptance above psychological resistance zones
Deeper Correction Scenario:
Failure to hold above 4000
Increased volatility without directional follow-through
Price dipping below the previous impulse base without immediate recovery
Importantly, a retracement does not negate the macro bullish structure unless long-term supports are decisively broken.
Final Perspective: Is $5,000 Too Early—or Still Ahead?
Gold’s rally since 2024 has followed a textbook expansion–consolidation rhythm. Each impulse wave has been respected by the market, and each pause has strengthened the overall structure.
Whether the next leg toward $5,000 begins immediately or after a deeper reset, the broader narrative remains intact:
Gold is in a long-term repricing phase, not a speculative spike.
For traders and investors alike, the focus should not be on calling the exact top or bottom—but on aligning with structure, respecting psychological zones, and allowing the market to confirm its next intent.

 Short
Short
Stocking up on longs as Christmas cheer kicks inHaving failed to clear resistance layered above 8,726 last week, our ASX 200 contract has retraced back towards support at 8,575 and bounced, generating a setup where traders can look to play what is typically a strong seasonal period for Australian equities without leaving too much risk on the table.
Longs could be set above 8,575 with a stop below, targeting a bullish reversal back towards resistance at 8,726. While the oscillators are providing mildly bearish signals, with RSI (14) pushing lower away from the neutral level and MACD rolling over towards the signal line while remaining in negative territory, the message is overridden given we’re approaching the roll in futures and the likelihood of far lower volumes heading into Christmas.
Essentially, this trade is underpinned by the Santa rally playing out as institutional traders pack up for the year, providing a window for retail to dominate proceedings.
Good luck!
DS  Long
Long
 Long
Long
Long 
$NFLX #Netflix Outlook [High Margins, Low Debt, High Growth]NASDAQ:NFLX is attempting to acquire Warner Bros. Discovery (WBD). The stock has dropped roughly 31% from its highs. In big acquisitions, the stock of the company doing the buying usually drops because investors worry they are overpaying or taking on too much complexity. The fact that a bidding war is starting with Paramount adds uncertainty.
Strengths:
PEG is 1.14
Netflix is a consumer growth stock. Finding a tech giant growing earnings at 25%+ per year (EPS next 5Y is 25.64%) trading at a PEG of 1.1 is rare. The recent price drop has made the valuation very attractive relative to its growth.
Debt/Eq is 0.66
Netflix has very manageable debt. This gives them the power to make bold moves, like trying to buy Warner Bros without risking bankruptcy.
Profit Margin is 24.08
For every dollar of subscription money they take in, they keep 24 cents as pure profit. This is high for a media company that spends billions on content creation. It shows their business model has fully matured.
Weaknesses
If Netflix wins the war for WBD, they have to integrate a massive, legacy media company. This is messy, expensive, and dilutes existing shareholders. If they lose the war to Paramount, the stock might bounce back, but they lose a strategic asset. Uncertainty kills stock prices!
IMO, Netflix's problems are strategic which is a merger drama, not structural.
Not an investment advice, DYOR!
#AHMEDMESBAH #Stocks #NFLX #NETFLIX  Long
Long
Long 
 Long
Long
Long 
 Long
Long
KSE 100, Market Stance - Cautious Optimism with DisciplineMy stance remains very cautious regarding fresh buying. This week is likely to be bullish. My approach is to capitalize on the rally, book profits aggressively, and enjoy the upside while it lasts.
Freeing up at least 50% cash is strongly advised.
Historically, mutual funds tend to sell towards the end of December, and a fake-out rally remains a very real possibility.
A sustainable and stronger rally will only materialize if smart money gets the opportunity to buy at discounted levels, which may happen if the index corrects toward 160K or even 152K.
I sincerely wish to be proven wrong but experience has taught me the hard way.
Hence, the mantra is simple:
NEVER LOSE AGAIN
🔴 Resistance:
R1: 170,000
R2: 171,100
R3: 174,900
🟢 Support:
S1: 166,000
S2: 163,000
S3: 160,000
Rest with Allah Kareem…
Regards,
Arsalan Anwer
Stags  Long
Long