Shark
KNR Construction ready for double ??Disclaimer : This view is only for educational purpose and it's not buying or selling recommendation. Consult your financial advisor for stock market related investment. Stock market gains are subject to market risk's, hence invest with accepting stock market risk's.
I am not responsible for your profits and losses.
1] KNR construction has completed one major Elliot Wave Cycle :
a] Impulse Wave took time of 8 years (1-2-3-4-5) and 5th wave extended.
b] Corrective wave has taken time of 54-55
ETHUSD · 15M · SMC NarrativePrice has rallied cleanly into a premium HTF supply zone, tapping into a pool of resting buy-side liquidity above prior highs.
HTF Context
Previous range high clearly defined and respected.
Liquidity engineered above equal highs.
Current price trading in premium, far from value.
LTF Structure
Strong impulsive move up, low-quality pullbacks.
Final leg shows momentum expansion, typical of a liquidity run.
High probability this move is exit liquidity, not continuation.
Expectation
Brief p
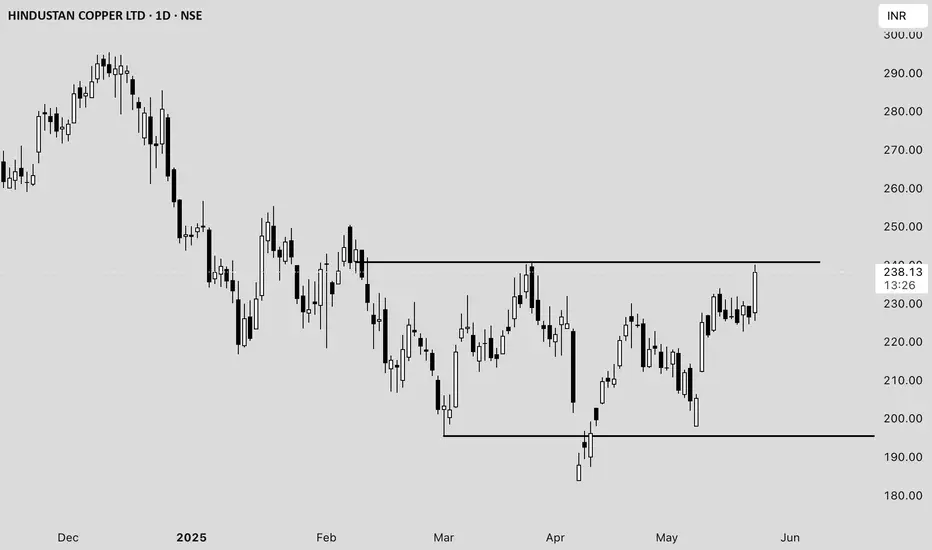
Hindustan Copper Ltd. (HINDCOPPER) Price Analysis **Date:*#### **Current Price and Intraday Movement**
- **Latest Price:** ₹237.98 (+5.09% / +₹11.52)
- **Day’s Range:** ₹225.50 – ₹240.10
- **Open:** ₹227.60
- **Previous Close:** ₹226.46
- **Volume:** 1.63 crore shares (well above average daily volume of 55.89 lakh)
#### **Technical Overview**
- **52-Week Range:** ₹183.82 – ₹381.90
- **50-Day Average:** ₹216.99
- **200-Day Average:** ₹260.58
- **Market Cap:** ₹23,013 crore
- **P/E Ratio:** 57.48
- **EPS:** ₹4.14
#### **Recent Performance an
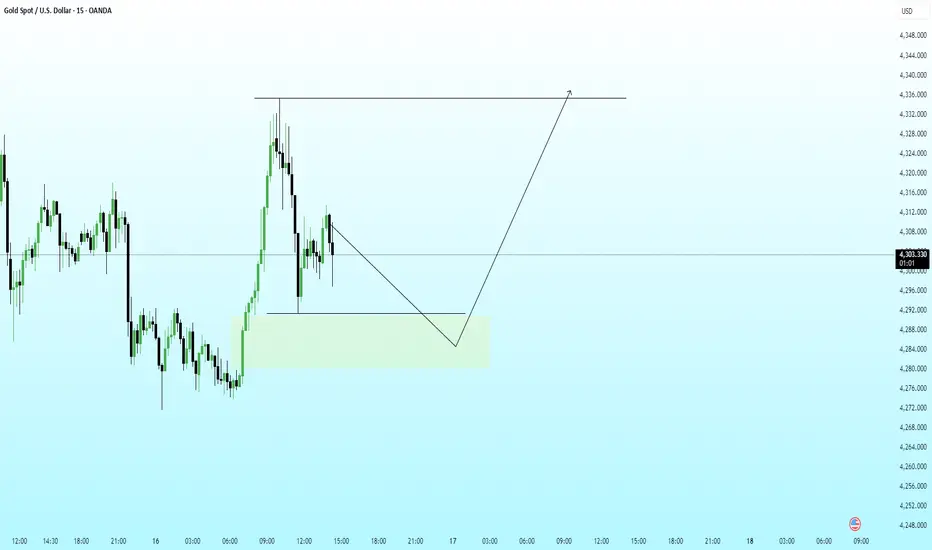
XAUUSD – 15M | SMC-Based Trade PlanGold is currently in a corrective phase after a strong impulsive move to the upside. Price has delivered a clear displacement, followed by a pullback into a refined demand zone, highlighted on the chart. This area aligns with prior bullish order flow and acts as a discount zone within the higher-timeframe range.
The current sell-off appears corrective, not impulsive. Expectation is for price to mitigate demand, sweep weak lows if needed, and then resume the primary bullish structure.
Execution
Gold Intraday Setup (XAU/USD)Price tapped into the premium zone after a sharp impulsive leg, showing signs of exhaustion near 4139–4140 levels. Expecting a potential short-term correction as liquidity above recent highs has been swept.
Bias: Short
Entry: 4134
Stop Loss: 4140
Target: 4120
R:R: ~2:1
Watching for confirmation on lower timeframes before continuation.
#Gold #XAUUSD #PriceAction #LiquidityGrab #YCGHCapital
INTELLECT Price ActionAs of **October 24, 2025**, **Intellect Design Arena Ltd (NSE: INTELLECT)** closed at **₹997.95**, gaining around **3.6%** from the previous close of ₹963.50. The stock opened at **₹965.00**, reached a **high of ₹1,008.00**, and a **low of ₹950.50**, supported by a trading volume of about **4.01 lakh shares**.
The company’s **market capitalization** stands around **₹13,760 crore**, with an **EPS of ₹25.05** and a **P/E ratio near 39.8**, suggesting a moderate premium valuation compared to the
TATAINVEST Price ActionAs of **October 24, 2025**, **Tata Investment Corporation Ltd (NSE: TATAINVEST)** closed at **₹839.00**, marking a **1.45% gain** from the previous session’s ₹827.00. The stock traded between **₹821.00 and ₹849.00** during the session, with total trading volume around **4 million shares**. The company’s **market capitalization** stands close to **₹42,450 crore**, keeping it well within the mid-cap investment and financial services category.
The **52-week range** spans between **₹514.52 (low)**
IFBIND Price ActionAs of October 23, 2025, **IFB Industries Ltd (NSE: IFBIND)** was trading around **₹1,893**, showing a modest weekly gain of about 4% and up nearly 40% over the past three months. The stock has recently fluctuated between the **52-week high of ₹2,319.85** and **low of ₹1,060**, indicating strong recovery momentum after several quarters of underperformance.
The company’s **market capitalization** stands near **₹7,480 crore**, placing it in the small- to mid-cap category. The current **P/E ratio
TFCILTD Price Action## TFCILTD – Price Analysis (August 2025)
### Price & Market Metrics
- **Current share price:** ₹297.75 (as of August 13, 2025; latest close).
- **Market capitalization:** Approx. ₹2,757crore.
- **52-week range:** ₹122.32 (low) – ₹303.50 (high); new high reached in early August.
- **All-time low:** ₹4.45 (Sep 2001).
- **All-time high:** ₹303.50 (July–August 2025).
- **Day’s range (Aug 13):** ₹282.60–₹303.50.
- **Volume:** 3,955,421 shares traded on Aug 13.
- **Beta:** 1.24, showing moderate vol
Godrej Agrovet LtdAs per harmonic patter Alt shark formed
DISCLAIMER
Information provided is for informational purposes only and should not be construed as investment advice or an offer to buy or sell securities. Investors are advised to carefully review all materials and consult with a financial advisor considering their own financial situation and risk tolerance before making investment decisions. The disclaimer also often includes statements about no guarantees or warranties regarding the accuracy, adequac
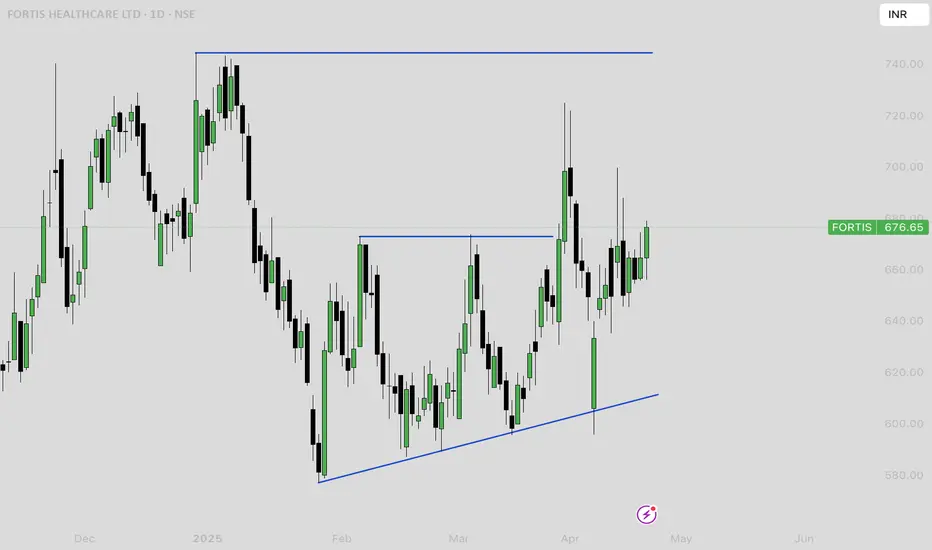
Fortis Healthcare’s share price analysisFortis Healthcare’s share price is currently around ₹667, reflecting strong momentum and significant outperformance over the past year, with a return of about 49%. The stock recently touched a 52-week high of ₹744.5 and a low of ₹406, indicating a broad trading range and robust investor interest
Analyst sentiment remains bullish, with most forecasts targeting a price range of ₹736 to ₹850 over the next 12 months, suggesting a potential upside of around 10–20% from current levels . Some projecti
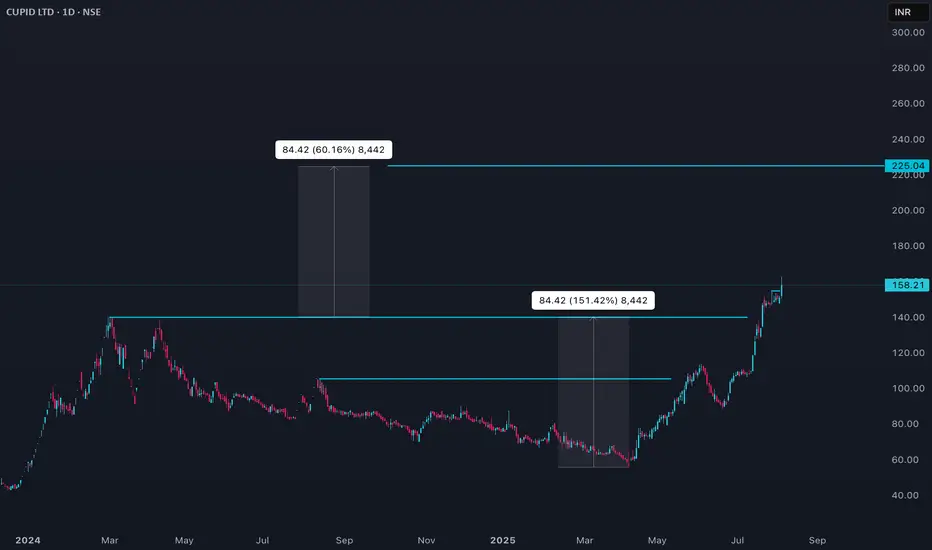
Cupid Price ActionCupid Limited’s stock is trading around ₹158 as of early August 2025, having recently hit new record highs above ₹162. The share price surged over 45% in the past month and is up more than 100% year-to-date, significantly outperforming both its FMCG peers and the broader market. Volatility is high: daily moves of 5–6% are common, and intraday swings have reached as much as 8%. The stock is trading well above all major moving averages, reflecting strong buying momentum.
Long-term performance is
ANANTRAJ Price Action
## Current Price & Performance
- Last close was ₹607.20.
- Over the past week, the stock is up more than 10%, showing strong short-term momentum.
- Over the past year, it has gained nearly 25%, but suffered a sharp 32% drawdown over six months.
- The 52-week price ranged from ₹376.15 to ₹947.90, reflecting high volatility.
## Valuation and Metrics
- ANANTRAJ trades at a high valuation, with price-to-earnings and price-to-book ratios above typical industry averages.
- Its market capitalizatio
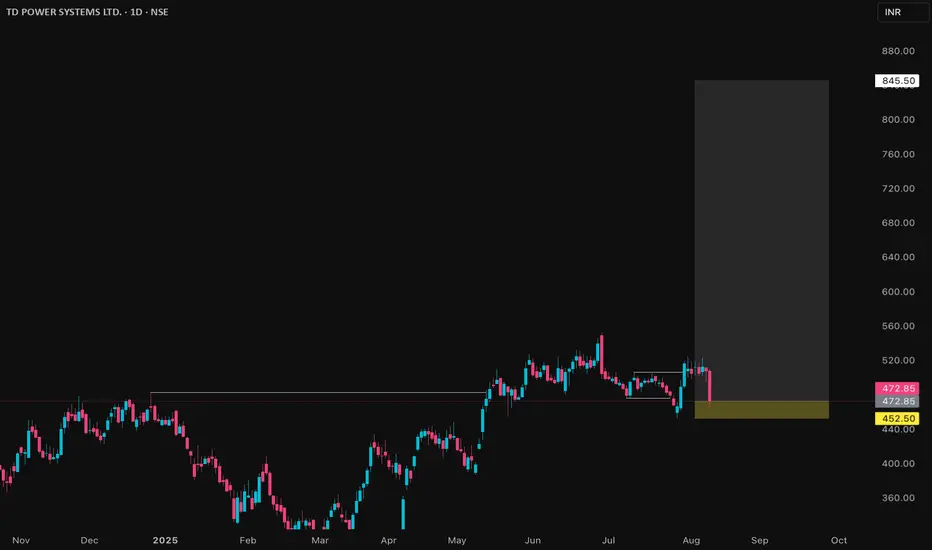
TDPOWERSYS Price Action## TDPOWERSYS Price Details (as of August 8, 2025)
### Market Metrics
- Current share price is ₹472.85.
- Market capitalization is ₹7,385crore.
- The 52-week price range is ₹293 to ₹552.75.
- Its all-time low was ₹14 in March 2020; all-time high is ₹552.75 in June 2025.
### Returns & Volatility
- 1-month return: -1.48%.
- 1-year return: about 18%-20%.
- 3-year return: over 300%.
- 5-year return: over 1,900%.
- Weekly volatility is 6%, which is above average.
- Beta is 2.04, indicating higher r
BTC/UsDT Short sideHere is a description of the downside scenario as depicted:
1. The Short Entry Point: The short trade is set up to begin at the approximate current price level, which is around $122,000 to $123,000. This suggests a trader is anticipating that the current strong bullish move has reached its peak and a reversal is imminent.
2. The Stop-Loss (Risk):
• The top boundary of the red box, which extends into the red area above the entry, represents the stop-loss level.
• This red area is relatively small
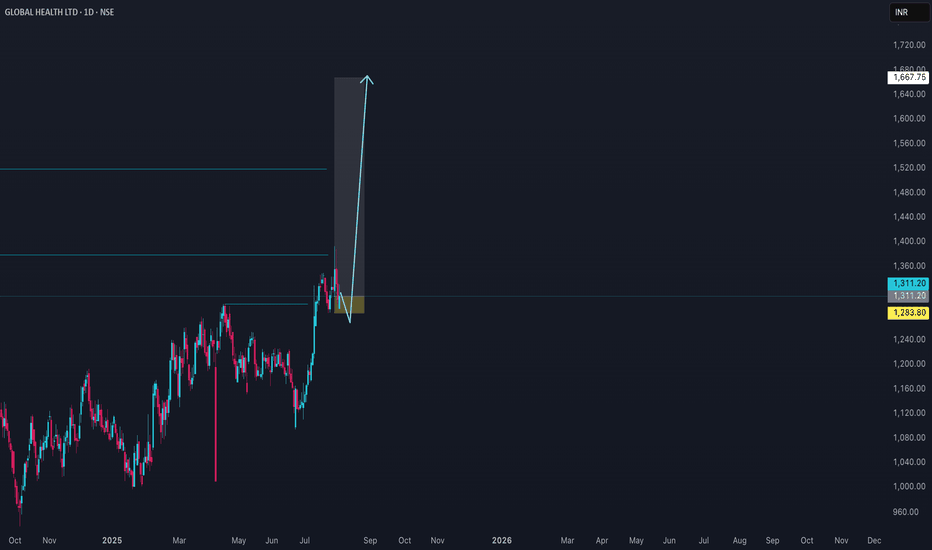
MEDANTA Price ActionMedanta (Global Health Ltd) is currently trading in the ₹1,300–₹1,335 range, having shown a notable run-up over the past six months, but with increased volatility in recent weeks. The stock reached a recent high near ₹1,393 and a low around ₹935 during the past year.
Fundamentally, Medanta continues to deliver robust revenue growth: annual revenues for FY25 rose to ₹3,692 crore, up approximately 13% from the previous year. Operating profitability remains strong, with margins in the 23% range an
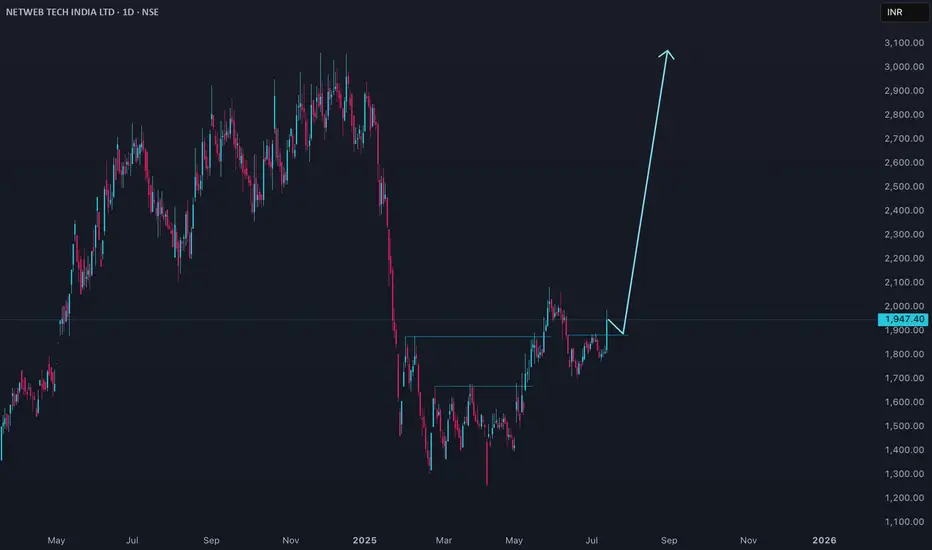
NETWEB Price actionNetweb Technologies (NETWEB) is trading at ₹1,947.40 as of July 11, 2025. The stock has shown a strong short-term recovery, up about 7.4% in the last session and nearly 6.8% over the past week, but it remains down by over 25% in the past six months. The 52-week high is ₹3,060 and the low is ₹1,251.55.
Valuation-wise, NETWEB is trading at a high price-to-earnings ratio (around 90–96) and a price-to-book ratio near 20, indicating a premium valuation. The company’s market capitalization is approxi
SYRMA Price ActionSyrma SGS Technology Ltd closed at ₹816.25 today, down 1.39% with a loss of ₹11.5 from the previous session. The stock opened at ₹834.80 and traded within a range of ₹811.95 to ₹836.95, reflecting a mildly bearish session after demand failed to sustain above recent highs. Despite the pullback, Syrma SGS remains in a firm uptrend on longer time frames, still trading well above its 50-day and 200-day averages.
The price action signals some profit booking near resistance zones close to ₹837, while
VIMTALABS Price Action## Vimta Labs Ltd – Price Analysis (August 2025)
### Price & Market Metrics
- Current share price is around ₹646–₹659 as of August 13, 2025.
- Market capitalization is approximately ₹2,900 crore.
- The 52-week price range is ₹241.30 (low) to ₹728.95 (high).
- The all-time high was ₹728.95 recorded in early August 2025.
- Recent price movement shows a strong rebound with gains around 6-7.5% over the past day.
### Returns & Volatility
- Over the last 1 year, the stock has surged by approximately
TIMETECHNO Price ction
### Market Metrics
- **Current share price:** ₹458.10.
- **Market capitalization:** ₹10,396crore.
- **52-week price range:** ₹306.60 (low) to ₹513.55 (high).
- **All-time low:** ₹17.55 (Feb 19, 2009).
- **All-time high:** ₹513.55 (Dec 13, 2024).
### Returns & Volatility
- **1-week change:** Down 1.98%.
- **1-month change:** Up 4.83%.
- **1-year return:** Up 43.18%.
- **Recent volatility:** Daily moves between ₹451.70 and ₹466.10 common.
- **Beta:** Not specified, but price swings indicate mode