AIIL Price actionAuthum Investment & Infrastructure Ltd (AIIL) has shown significant price appreciation over the past year, rising by more than 120%. The stock recently reached an all-time high near ₹2,600, with its lowest point in the past year being around ₹730. In the last month, AIIL gained over 17%, and in the past week alone, it rose by more than 6%.
The stock is considered volatile, with price swings that are sharper than the broader market. Technical indicators, such as moving averages, generally point
Shark
Paras Defence Price ActionParas Defence and Space Technologies is currently trading near ₹1,630, having delivered a substantial rally over the past year and outperformed many of its peers in the defence sector. The stock has risen more than 100% from its 52-week low and is trading close to its all-time high, reflecting strong investor confidence and robust momentum. Year-to-date, the stock is up over 60%, though it has shown some short-term volatility with a recent pullback of about 9% in just two days, suggesting a phas
Sudarshan Price ActionSudarshan Chemical Industries is currently trading around ₹1,256, having gained nearly 5% in the past week and over 6% in the last month. The stock has delivered a strong 10% return over six months and nearly 40% over the past year, reflecting robust momentum. Its 52-week high is ₹1,315, while the low stands at ₹796, placing the current price close to its yearly peak.
Valuation-wise, Sudarshan Chemical trades at a high price-to-earnings ratio above 80 and a price-to-book ratio above 8, signalin
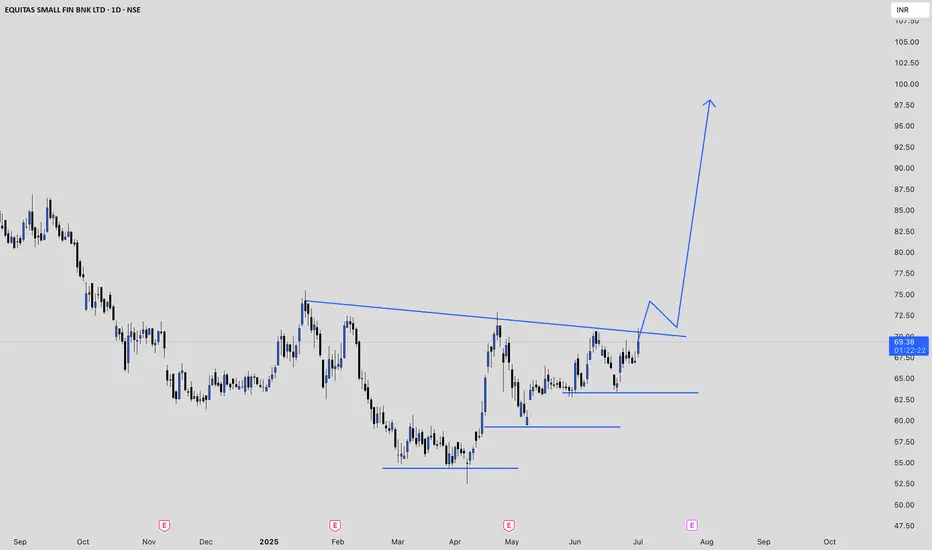
EQUITASBNK Price ActionEquitas Small Finance Bank is currently trading around ₹69, showing a strong gain of over 5% on July 1, 2025, and outperforming its sector in the short term. The stock has been volatile, with a day range between ₹67.50 and ₹71.00. Its 52-week high is ₹97.21, while the 52-week low stands at ₹52.52, placing the current price closer to the lower end of this range. The all-time high for the stock is ₹116.50.
Market capitalization is approximately ₹7,950 crore, and trading volumes remain robust, wit
RAYMONDLSL Price actionRaymond Lifestyle Ltd (RAYMONDLSL) is currently trading in the range of ₹1,088 to ₹1,179 as of June 26, 2025, showing a strong rebound in the last few days after a prolonged period of decline. Over the past year, the stock has been highly volatile, reaching a 52-week high of ₹3,100 and hitting a low of ₹911.35 in May 2025. The share price has dropped significantly, with a decline of about 64% over the last year and nearly 48% over the last six months.
Despite this correction, the stock has rece
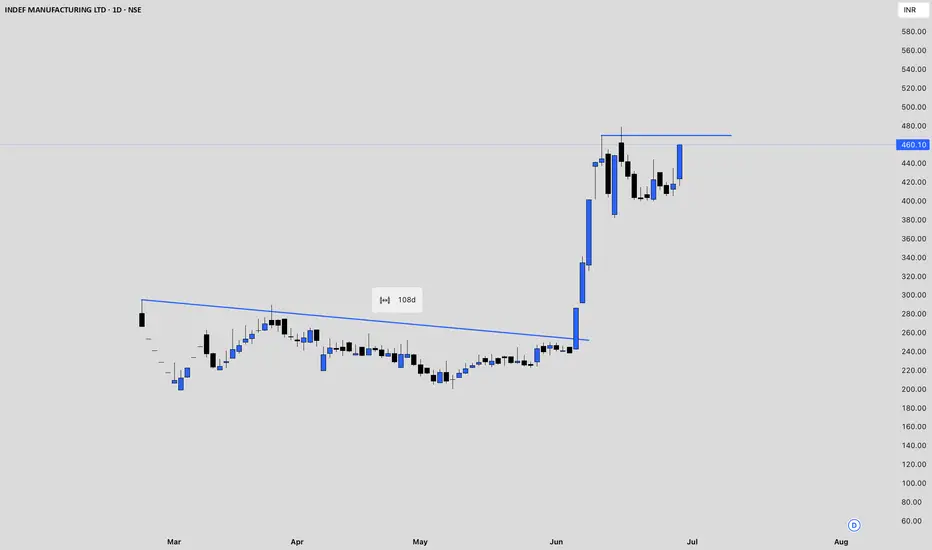
BAJAJINDEF Price ActionBajaj Indef (BAJAJINDEF) has experienced a period of high volatility and rapid price movement in June 2025. After a sharp rally from around ₹225 in late May to a peak near ₹478.90 by mid-June, the stock has since corrected and is now trading in the ₹400–₹420 range. This recent surge was accompanied by significant spikes in trading volume, indicating heightened market interest and participation.
The stock’s price action shows a pattern of large daily swings, with both double-digit percentage gai
CERA Price action**CERA Sanitaryware (NSE: CERA) Price Analysis – June 2025**
- **Current Price:** As of June 27, 2025, CERA closed at ₹6,816, showing a 3.33% gain from the previous session.
- **Recent Trend:** The stock has been volatile in June, with prices fluctuating between ₹6,573 and ₹7,275. Over the past week, it declined by about 2.8%, but remains up 6% for the month and nearly 17% over the past three months.
- **Long-Term Performance:** Despite recent weakness, CERA has delivered a 62% return over thre
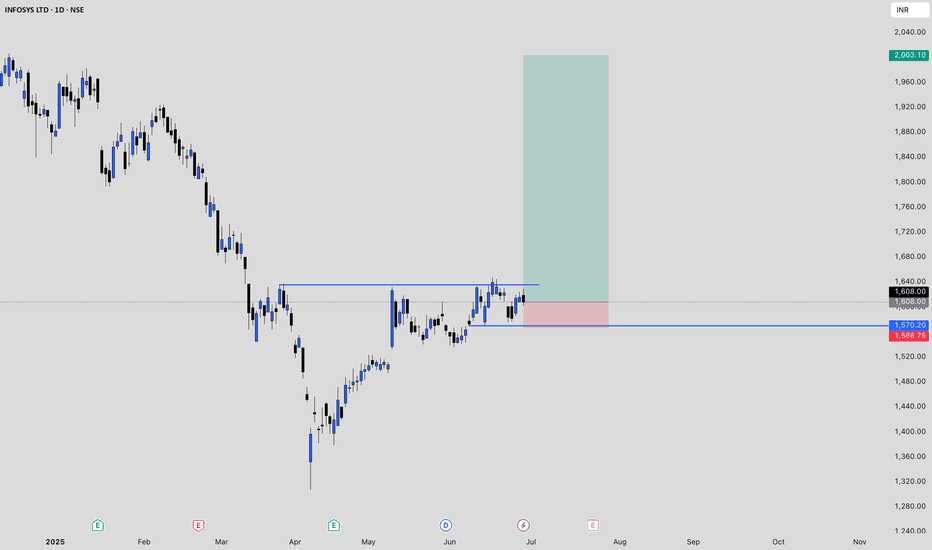
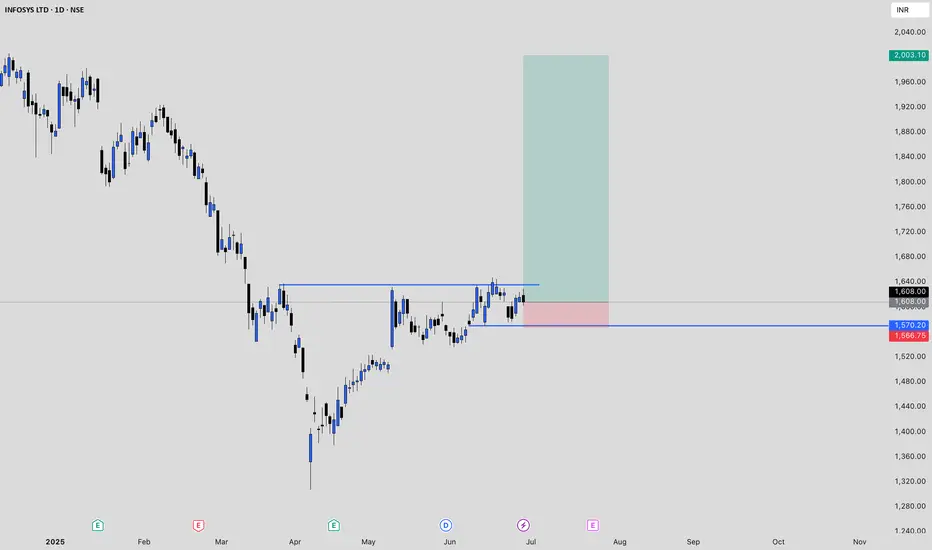
Infy Price actionInfosys (INFY) is currently trading around ₹1,608, with recent fluctuations between ₹1,606 and ₹1,629. Over the past year, the stock has delivered modest gains, slightly underperforming broader market indices and the IT sector. Financially, Infosys remains robust, maintaining strong revenues, healthy profit margins, and a debt-free balance sheet. The company continues to reward shareholders with consistent dividends, including a recent payout of ₹22 per share.
Looking ahead, growth expectations
OIL Price ActionOil India Limited is currently trading at ₹433.40 as of June 27, 2025. The stock has seen a notable decline over the past week, falling by nearly 7%. Over the last month, the price has remained relatively flat, with a slight gain of about 0.5%. Looking at a broader time frame, the stock is up 12% over the past three months and has gained just under 2% in the last six months.
The 52-week high for Oil India stands at ₹767.90, while the low is ₹325.00, indicating that the stock is trading well bel
CEATLTD Price actionCEAT Ltd has recently shown a recovery in its price action after a period of volatility. The stock closed at ₹3,645.30, rebounding over 2% in the latest session following a brief dip earlier in the week. Over the past month, CEAT experienced a mild correction, with the price dropping about 4%, but the three-month return remains strong at over 25%. On a one-year basis, the stock has delivered a solid gain of more than 37%, reflecting sustained investor interest and underlying business strength.
KIRLOSBROS Price actionKirloskar Brothers Ltd (KIRLOSBROS) has experienced a strong upward trend recently, with the stock price rallying sharply from lower levels earlier in June 2025. The price reached a high above 2,200 INR before encountering some resistance and pulling back slightly. This surge was accompanied by increased trading volumes, indicating heightened interest from market participants.
The overall trend remains positive, supported by the company's solid annual financial performance, despite a dip in the
APARINDS Price actionAPAR Industries (APARINDS) is currently trading between ₹8,083 and ₹8,620 per share as of June 26, 2025. The stock is down about 31% from its 52-week high of ₹11,779.90 (reached in January 2025), but it remains 85% above its 52-week low of ₹4,308.05 (from April 2025). Over the past six and twelve months, APARINDS has delivered negative returns of -22.68% and -16.58%, respectively, reflecting a significant correction after a strong rally earlier in the year.
Valuation-wise, the stock has a price
FORCEMOT Price action **Force Motors (FORCEMOT) Price Analysis – April 21, 2025**
**Current Price:** ₹9,229
**Trend:** Strong uptrend, up 40% in the past three months.
**Support:** ₹8,700–₹8,900
**Resistance:** ₹9,270 (previously ₹10,272, the 52-week high).
**Outlook:** Bullish above ₹9,000. A breakout above ₹9,270 could potentially retest the 52-week high.
**Summary:** The momentum is strong, and the trend remains positive unless the price falls below ₹8,700.
NEWGEN Price Action**NEWGEN (Newgen Software Technologies) Price Analysis – June 2025**
**Current Price & Trend**
- Latest price: Around ₹1,148 as of June 16, 2025.
- The stock has recently shown a mildly bearish technical trend, with daily moving averages and the monthly MACD indicating caution.
- Short-term signals (as of early June) are bearish, with a 5-day EMA crossover and stochastic crossover suggesting further downside. Historically, such signals have led to average declines of 3–11% over the following da
JUBLFOOD price actionJUBLFOOD (Jubilant Foodworks) is currently trading at ₹681.45 as of June 13, 2025, up 2% for the day. Over the past year, the stock has gained about 26.5%, though it remains roughly 14% below its 52-week high of ₹796.75 and about 30% above its 52-week low of ₹522.25.
Technically, the stock is showing mixed signals. The RSI is neutral around 49.5, while MACD and ADX are giving sell signals. However, most short-term moving averages (except the 5 and 50-day) are showing buy signals, and the price
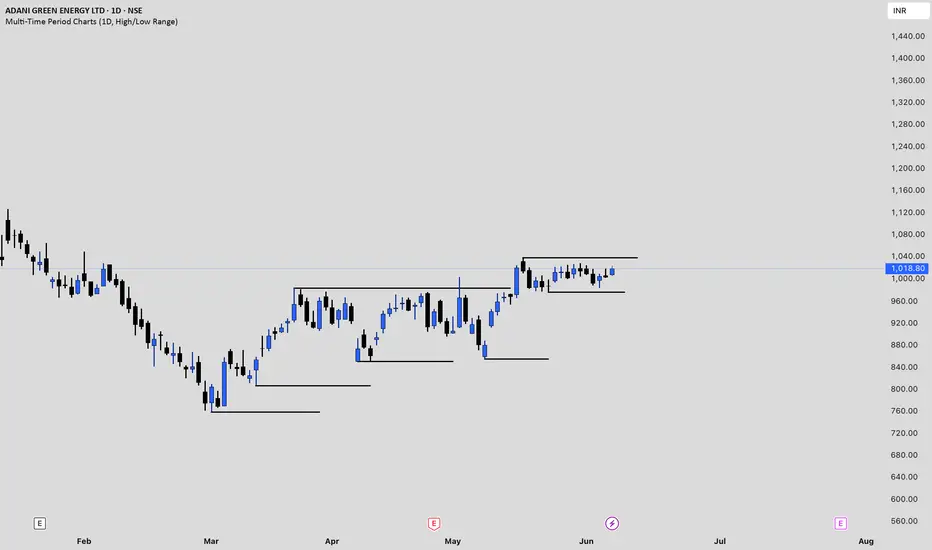
ADANIGREEN Price actionAdani Green Energy Ltd (ADANIGREEN) closed at ₹1,009.50 on June 6, 2025. The stock has shown notable volatility in recent months. Over the past month, it gained nearly 10%, and over the last three months, it’s up 18.25%. However, longer-term performance is weaker, with a 6-month decline of 18.38% and a significant 45% drop over the past year .
The stock’s 52-week high is ₹2,091, while the 52-week low is ₹758, indicating substantial price swings. ADANIGREEN trades at a high valuation, with a P/E
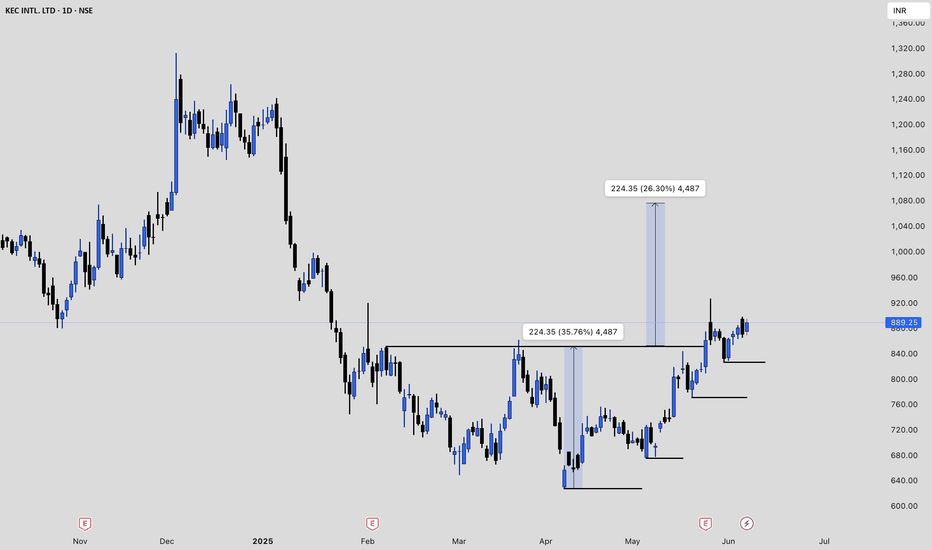
KEC Price ActionKEC International’s share price as of June 6, 2025, is around ₹889.25, reflecting a 2.16% increase from the previous close. Over the past month, the stock has surged by 28.8%, and it is up 6.83% in the last week, showing strong short-term momentum. However, over the last six months, the stock is down by 26.85%, indicating significant volatility in the medium term .
The company is currently trading at a price-to-earnings (P/E) ratio of 40.6 and a price-to-book (P/B) ratio of 4.33, both of which
Sobha Ltd's Price AnalysisSobha Ltd's share price as of late May 2025 is trading in the range of ₹1,349.60 to ₹1,386.10, with recent sessions showing minor fluctuations and a slight upward move from the previous close. Over the past year, the stock has declined by nearly 29%, though its longer-term performance remains strong, with a five-year return exceeding 600% .
From a valuation perspective, Sobha is trading at a high price-to-earnings (P/E) ratio of about 225–241, which is significantly above the industry average a
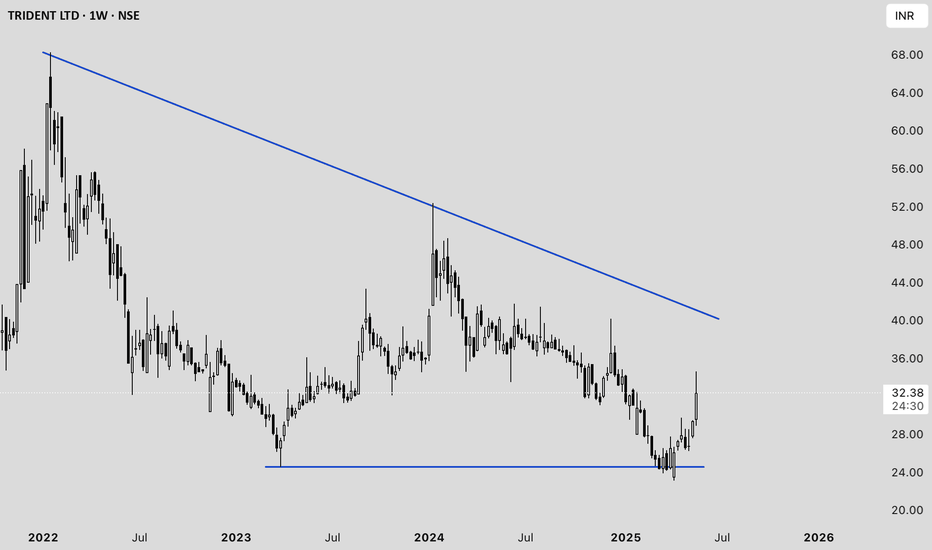
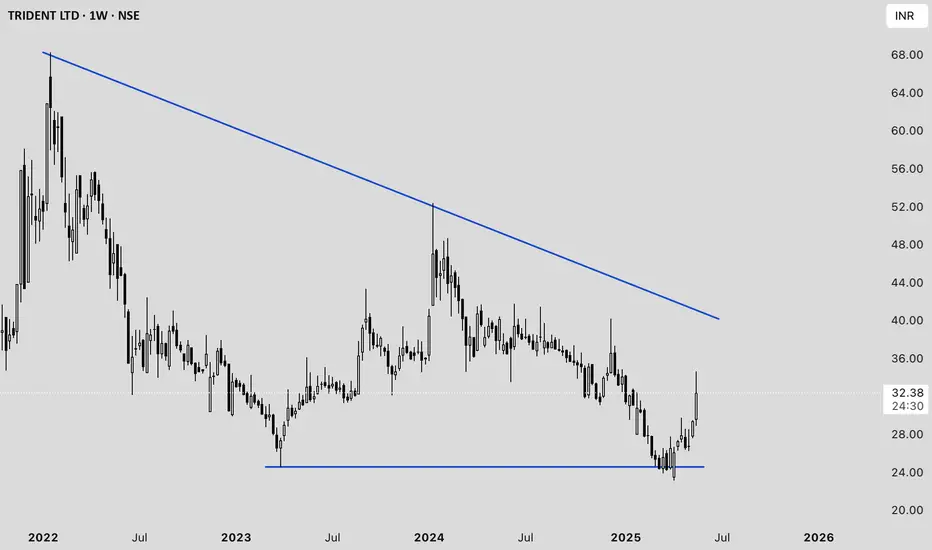
Trident Ltd. Price Analysis (as of May 23, 2025)#### **Current Price and Recent Movement**
- **Latest Price:** ₹32.11 (down 2.32% from the previous close) .
- **1-Week Return:** +9.29%
- **1-Month Return:** +9.11%
- **1-Year Return:** -15.39%
- **3-Year Return:** -32.89%
#### **Technical Analysis**
- **Buy Signal:** A 200-day moving average crossover occurred on May 21, 2025. Historically, this signal has led to an average gain of 6.61% within 30 days .
- **Momentum Indicators:**
- **RSI:** 62.17 (shows moderate bullish momentum)
- **M
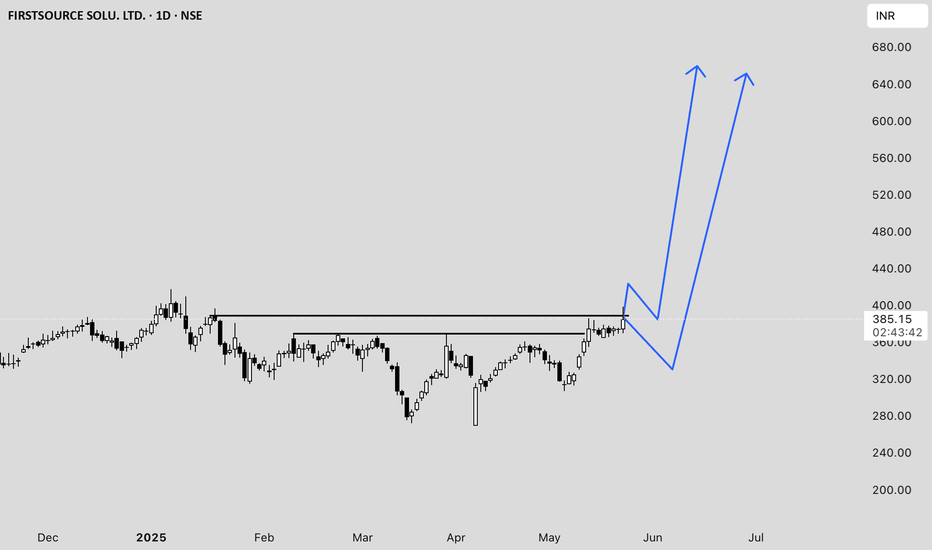
FSL price actionFirstsource Solutions Ltd (FSL) on the NSE is trading at ₹385.55 as of May 23, 2025 . The stock has shown strong performance over the past year, with a return of 87.31% and a five-year return exceeding 1,100% . FSL’s 52-week high is ₹422.30, while the 52-week low is ₹176.25 .
Recent price action shows that after peaking near its all-time high in January 2025, FSL corrected but has since rebounded sharply from the ₹320–₹330 range in early May to the current levels. Trading volumes have been robu
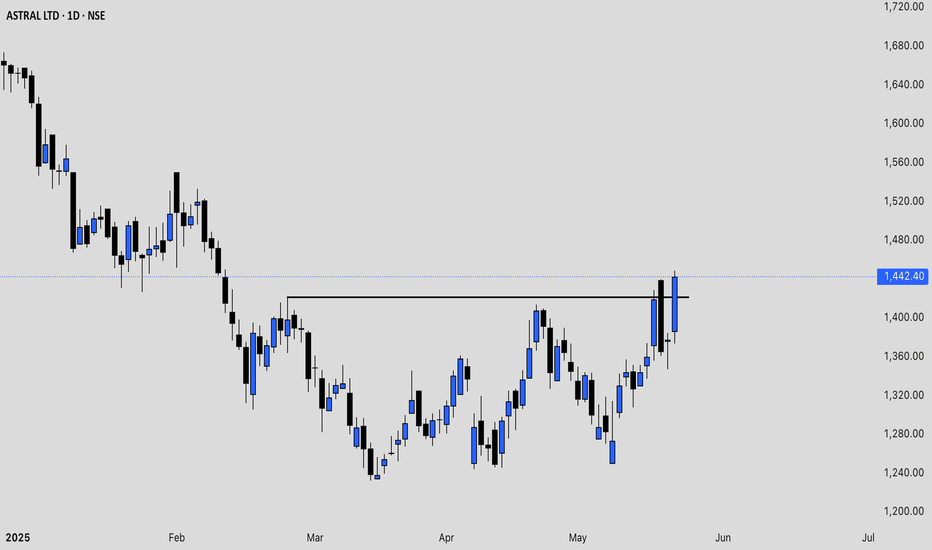
ASTRAL price action analysis Astral Ltd (ASTRAL) has shown a mix of volatility and recovery in May 2025. After a sharp decline earlier in the month, the stock rebounded, with recent prices moving from the ₹1,330–₹1,350 range up to ₹1,377.70 as of May 21, 2025. The trading volumes have remained strong, indicating active participation from both buyers and sellers.
Technically, Astral is trading above its short-term volume-weighted average price (VWAP) of around ₹1,362.9, which is a positive sign for near-term momentum . The
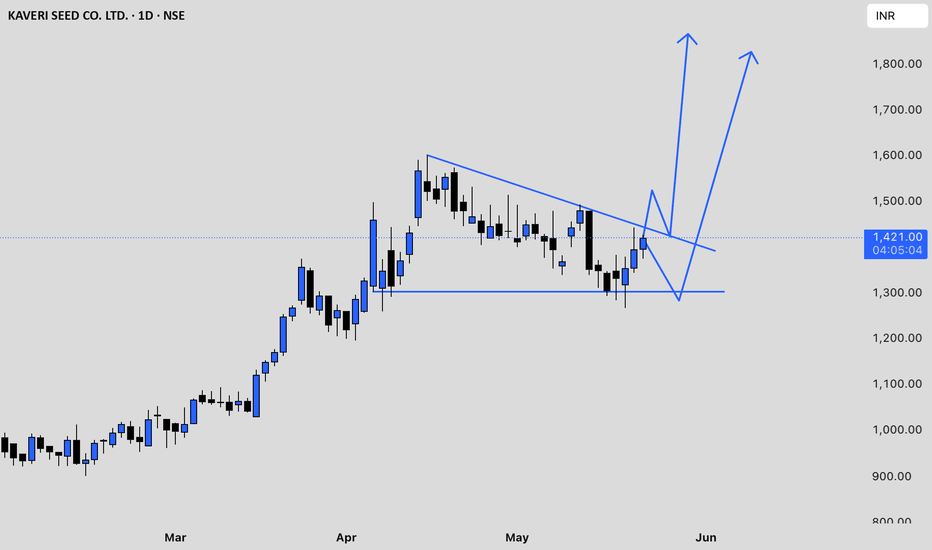
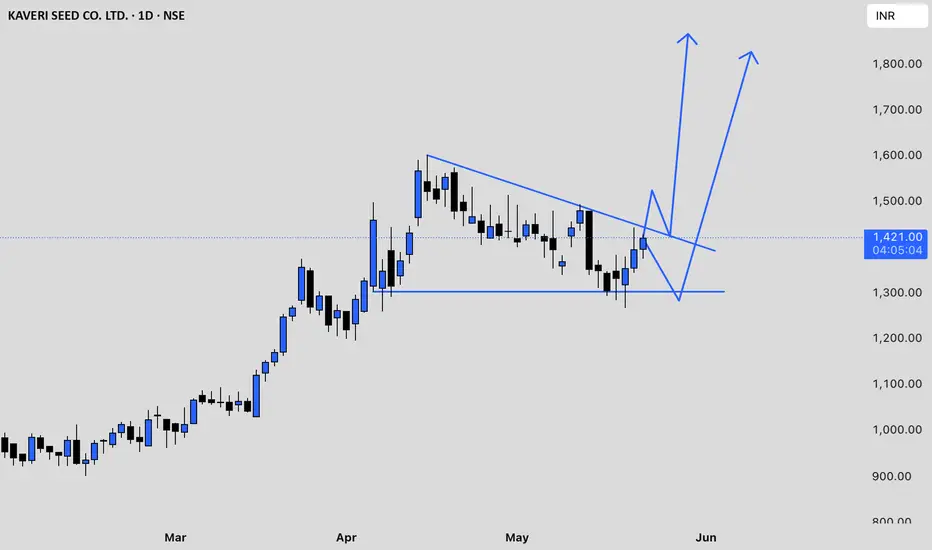
KSCL chart analysisKaveri Seed Company Ltd (KSCL) has recently experienced significant volatility. After reaching a peak above ₹1,480 in mid-May 2025, the stock corrected sharply, falling to the ₹1,305–₹1,345 range by May 16, marking a notable pullback of nearly 9% in a single session. Trading volumes have been high, indicating strong market participation during both the rally and the subsequent sell-off.
From a technical perspective, KSCL’s price remains above its 50-day, 100-day, and 200-day exponential moving
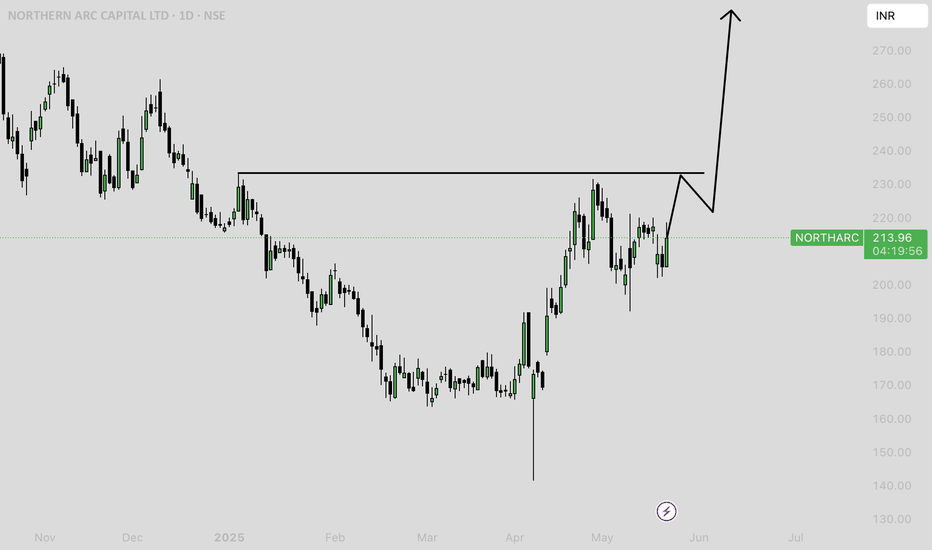
## NORTHARC Price Action Analysis
### **Recent Price Performance**
- **Current Price:** As of the latest available data, Northern Arc Capital Ltd (NORTHARC) is trading around ₹208–213.
- **Volatility:** The stock is showing a volatility of about 4.14% with a beta of 1.37, indicating higher-than-market volatility.
- **52-Week Range:** The price has ranged from a low of ₹141.47 (April 7, 2025) to a high of ₹350.00 (September 24, 2024).
- **Recent Trend:** NORTHARC has fallen by about 8% over the past week but is up nearly 14% ov
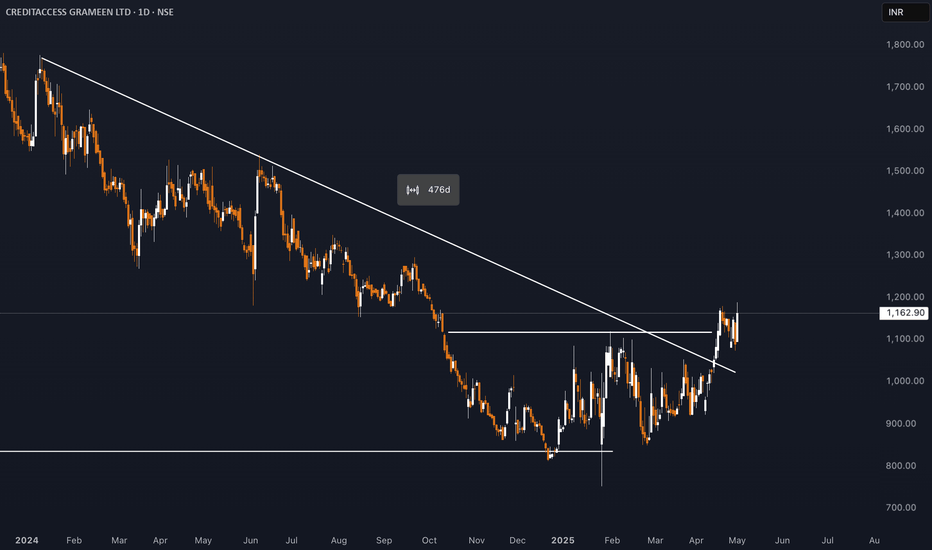
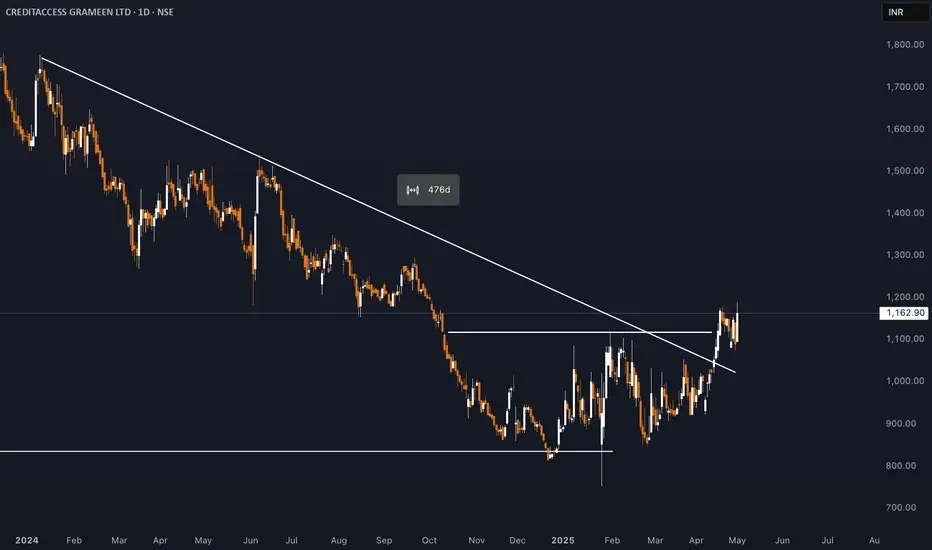
## CreditAccess Grameen (CREDITACC) Share Price Analysis- As of May 2, 2025, CreditAccess Grameen (CREDITACC) traded around ₹1,121–₹1,145, which is approximately 52% above its 52-week low of ₹750.20 (set in January 2025), but below its 52-week high of ₹1,551.95 (set in June 2024) .
- The stock has shown volatility over the past year, with a notable decline from its peak, reflecting both sector trends and company-specific events .
**Valuation and Financial Metrics**
- **P/E Ratio (TTM):** 20.3–21.2, indicating moderate valuation relative to earnings