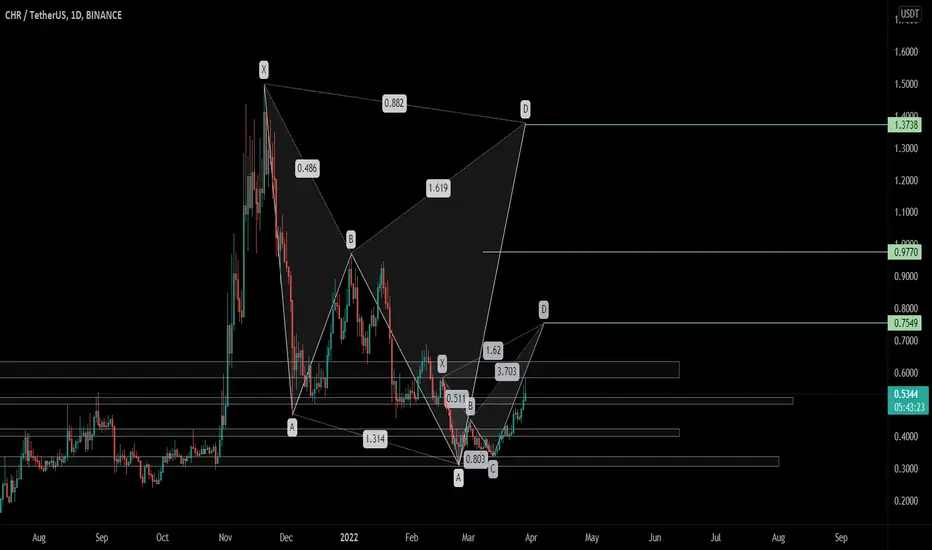
Perfect automated detection of Cypher & Shark PRZ - ShortA Bearish-type Cypher pattern occurred near the resistance zone of 0.983-0.987.
A Bearish-type Shark is likely to occur as the price moves closer to the resistance zone.
Short after Shark pattern generation and seeing the rebound.
*Harmonic patterns and support/resistance zones are automatically detected using the indicators below.
- Harmonic auto-detect PRO
- Support/Resistance Zone Auto PRO
Shark
AUDCAD - Bullish SharkAs mentioned yesterday in our private channel(check the link at the footer) that today will be an active day for traders.
I've engaged in this counter-trend trading opportunity, the Bullish Shark Pattern. If this setup fails, there is another level of opportunity, as we know that shark patterns can be tricky.
Please do your own analysis and do not follow blindly.
GBPAUD - Bullish 5-0PatternFirst, before the 5-0Pattern is completed, it has to reverse at 1.7063 to show respect for the Bearish Shark Pattern completion.
Would I take the trade?
You bet I will!
I will observe if the market will respect 1.6993; if it pauses and reverses, I know I have my Bullish 5-0 Pattern.
The 5-0 Pattern is vital for my longer-term trading plan.
DFI.Money (YFII) formed bullish Shark for upto 188% rallyHi dear friends, hope you are well, and welcome to the new update on DFI .Money (YFII) token with US Dollar pair.
Previously we had a nice trade of YFII:
Now on a daily time frame chart, YFII has formed a bullish Shark.
Note: Above idea is for educational purpose only. It is advised to diversify and strictly follow the stop loss, and don't get stuck with trade
YLong
Perfect automated detection of 3Drive pattern - LongA Bullish-type 3Drive pattern occurred.
Also on the daily chart, Bullish-type 3Drive pattern is occurring,
on weekly chart, Bullish-type Shark pattern is occurring.
Long after seeing the rebound.
*Harmonic patterns and support/resistance zones are automatically detected using the indicators below.
- Harmonic auto-detect PRO
Tellor (TRB) formed bullish Shark for upto 26% pumpHi dear friends, hope you are well and welcome to the new trade setup of Tellor ( TRB ) token with US Dollar pair.
Now on a 4-hr time frame chart, TRB has formed a bullish Shark .
Note: Above idea is for educational purpose only. It is advised to diversify and strictly follow the stop loss, and don't get stuck with trade
Bitcoin (BTC) formed bullish Shark for upto 19.50% moveHi friends, hope you are well and welcome to the new trade setup of Bitcoin (BTC)
On a daily time frame, Bitcoin has formed a bullish Shark pattern.
Buy between: $21153 to $20183
Sell between: $22104 to $24135
Stop loss:
Below: $20183
Possible profit and loss ratio:
As per the above targets, this trade has a profit possibility of 19.50%, and a loss possibility upto 5%.
Note: Above idea is for educational purpose only. It is advised to diversify and strictly follow the stop loss
[BYBIT:BITUSD] [Day Trade] Correction after massive dumpHello fellow traders,
Take a profit when the trade has been completed for 50% and move your stop-loss to entry.
Good luck and happy trading!
Kind regards,
n1d0
BLong
Bearish breakout of the BTC bear flagA significant bearish breakdown of the parallel channel/bear flag has begun. The triple bearish divergence and decreasing volume is now playing out. As usual, we need patience to see what the follow through price action looks like. Will we see a backtest of the channel as resistance or do we break back into the channel and continue the short term uptrend? I think more likely than not, this is the beginning of the continuation of the larger bear market cycle for BTC and crypto as a whole. Rememb
BTCUSD: Bearish Shark Update; Bullish 5-0A few days ago i posted a Bearish Shark with a a target between this trendline and the lower 21k area depending on if BTC would break through the trendline once it got here. However it would seem that BTC is holding up well at this trendline which is also the 50% Retrace of the Bearish Shark and it is now Double Bottoming in this Area on the 2 Hour Chart so i think it has become likely that this Bearish has evolved into a Bullish 5-0 that would Demand BTC atleast make another Local Higher High.
B
H
C
Class A Triple Bearish Divergence on BTC DailyWe see clear class A triple bearish divergence has formed on the BTC daily chart. This is an indication of a likely bearish reversal of the short term uptrend BTC has been experiencing. Recently, BTC has been holding the heartland of the bear flag channel that it has been in since June 16th. The recent upward price movement did not reach the top of the channel and now is heading down. The price action has been tightening for BTC, lately, so a full test to the bottom of the channel might be unlik