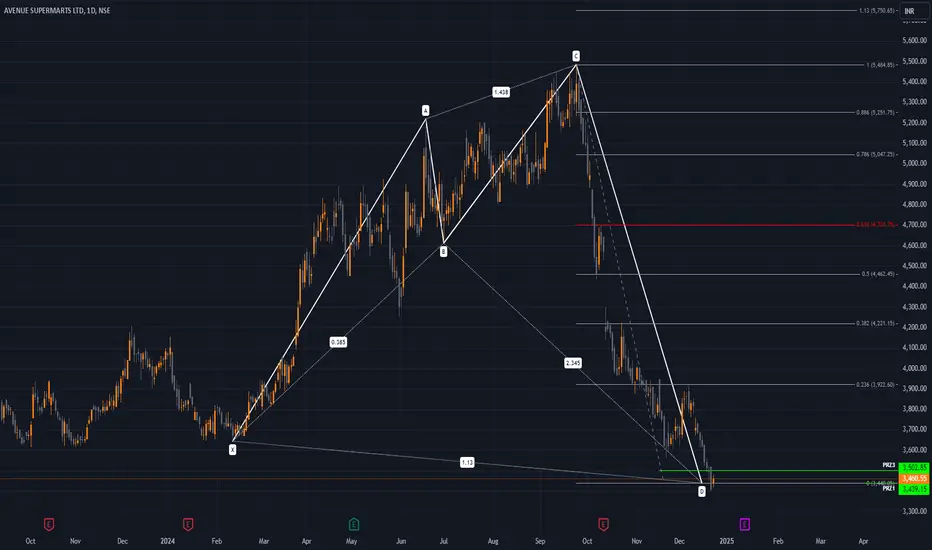
ERIS Lifesciences Share Price AnalysisEris Lifesciences is currently trading in the range of ₹1,371 to ₹1,474, with the latest reported price at ₹1,474.20 as of April 23, 2025. The stock has shown strong performance over the past year, delivering a return of approximately 57%. Over the last three months, the stock is up about 9%, though it has seen a slight dip of 0.57% in the past month.
**Valuation and Fundamentals**
Eris Lifesciences trades at a price-to-earnings (P/E) ratio of 57.13, which is high for the sector, and a price-to-book (P/B) ratio of 4.53. The company’s earnings per share (EPS) stands at 29.19, and its return on equity (ROE) is 12.63%, indicating moderate profitability. The market capitalization is approximately ₹18,831 crore . The dividend yield is negligible, suggesting the company focuses more on growth than on returning cash to shareholders.
**Analyst Sentiment and Targets**
Analyst sentiment is strongly positive, with nearly 89% recommending a buy and the remainder suggesting hold; there are no sell recommendations. The average long-term price target from analysts is ₹1,512.56, indicating modest upside from current levels.
**Technical and Trading Overview**
The stock has recently traded near its upper circuit of ₹1,659.60, with a lower circuit at ₹1,106.40, reflecting a relatively wide trading band and potential for volatility. Recent trading volumes have been healthy, supporting the current price momentum.
**Summary**
Eris Lifesciences has delivered strong returns over the past year and is viewed positively by analysts. However, its high P/E ratio suggests the stock is priced for continued growth, and the lack of dividend yield may not appeal to income-focused investors. The technical outlook is stable, with the stock trading near its highs and supported by robust trading activity.
 Long
Long
NTPC price analysisNTPC is currently trading around ₹360, having shown a modest gain of about 4% over the past year. The stock reached its all-time high of ₹448.45 in September 2024 and has since pulled back, with recent price action reflecting some consolidation after a strong multi-year rally . Over the last month, NTPC has delivered a positive return of approximately 2.5%, indicating some short-term strength despite a slight decline of nearly 1.8% in the past week.
Fundamentally, NTPC remains a large-cap, stable utility with a market capitalization near ₹3.5 lakh crore and a price-to-earnings (PE) ratio of about 15.9, which is below the industry average, suggesting reasonable valuation. The company boasts a healthy dividend yield of 2.5%, and its return on equity (ROE) stands at 13.1%. Promoter holding remains steady at 51.1%, and the company continues to report strong profits, with net profit for the latest fiscal year exceeding ₹20,000 crore.
Analyst sentiment is generally positive, with some brokerages forecasting up to 35% further upside from current levels and price targets ranging between ₹305 and ₹500 for 2025.
Technical indicators and historical trends show NTPC often delivers positive returns in April, with an average gain of about 3% for the month
In summary, NTPC is viewed as a fundamentally sound, dividend-paying stock with moderate growth prospects and reasonable valuation. While the stock is off its recent highs, the outlook remains constructive, supported by positive earnings, stable fundamentals, and favorable long-term forecasts from analysts  Long
Long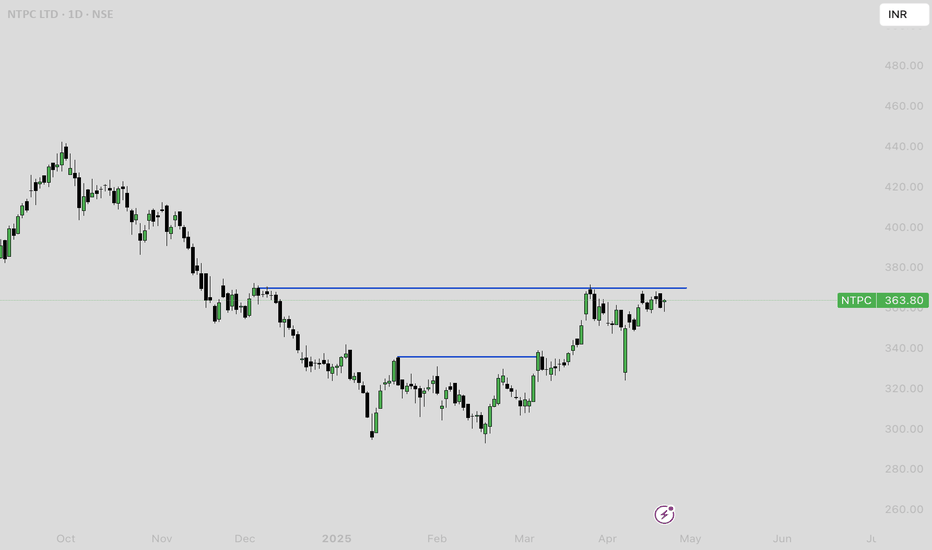
## TORNTPHARM Price AnalysisTorrent Pharmaceuticals (TORNTPHARM) is currently trading near ₹3,254, maintaining a strong uptrend over the past several years. The stock has delivered a return of approximately 165% from July 2020 to November 2024, including a stock split, highlighting its consistent long-term growth.
**Valuation and Fair Value**
TORNTPHARM is trading well above its estimated intrinsic value. Independent valuations suggest a fair value in the range of ₹1,560 to ₹1,940 per share, meaning the current market price is overvalued by about 40%. The price-to-earnings (PE) ratio stands at approximately 59–66, which is significantly higher than the sector average of around 49, indicating a premium valuation. The price-to-book (PB) ratio is also elevated at 16, compared to the sector average of 6.29.
**Recent Performance**
The stock has shown positive momentum in the short term, with returns of 3.5% over the past week and 5.7% over the past month. Over the last year, TORNTPHARM has gained nearly 28%, and over three years, the return is more than 128%. Despite some volatility, the stock has outperformed many of its peers and the broader market.
**Fundamental Trends**
Torrent Pharma’s India business, which constitutes the bulk of its revenue, grew by 12% in Q3 FY25, driven by strong performance in branded generics. However, the company faces challenges in international markets, particularly the US, due to regulatory headwinds and pricing pressures. Revenue growth over the past five years has averaged 7% annually, slightly below the industry average, but net income growth has been robust at over 30% per year, outpacing peers.
**Analyst Outlook**
Analysts have a moderately positive outlook, with a one-year price target averaging around ₹3,600, and a range between ₹2,959 and ₹4,200 . About 68% of analysts currently rate the stock as a buy.
**Dividend and Market Cap**
The dividend yield is 0.86%, which is above the sector average, and the company’s market capitalization is approximately ₹1.1 lakh crore, placing it among the larger players in the Indian pharmaceutical sector.
**Summary**
TORNTPHARM has demonstrated strong long-term price appreciation and profitability, but it is currently trading at a significant premium to its estimated intrinsic value. Short-term technicals are mixed, with some bullish undertones, but caution is warranted due to high valuation multiples. The company’s growth is primarily driven by its domestic business, while international operations face ongoing challenges. Analyst sentiment remains positive, but the upside may be limited unless earnings growth accelerates or valuation multiples contract.
 Long
Long
MAXHEALTH Price Chart Analysis**Current Price and Recent Performance**
- As of the latest available data, Max Healthcare Institute Ltd (MAXHEALTH) is trading around ₹1,084.40, showing a 0.64% increase in the past 24 hours
- The stock hit a high of ₹1,095.00 and a low of ₹1,066.50 in the most recent trading session, with an average traded price of ₹1,075.13
- Over the past week, the stock is down by 0.97%, but it has risen 8.23% over the past month and 30.78% over the last year
**Historical Price Levels**
- MAXHEALTH reached its all-time high of ₹1,227.95 on January 8, 2025
- The all-time low was ₹97.15, recorded on November 12, 2020
**Analyst Forecasts and Valuation**
- Analyst price targets range from a minimum of ₹615.00 to a maximum of ₹1,390.00
- The stock is trading at a price-to-earnings (PE) ratio of 100.12 and a price-to-book (PB) ratio of 12.59, which is higher than the sector averages (sector PE: 47.87, sector PB: 6.12)
- Dividend yield is low at 0.14%
**Technical and Volatility Insights**
- MAXHEALTH is 2.61 times as volatile as the Nifty index, indicating higher price swings.
- The 50-day moving average (DMA) is at ₹1,062, suggesting the current price is above this technical support level.
MAXHEALTH's valuation is high compared to peers, reflecting strong investor expectations
**Fundamental Performance**
- Revenue has grown at a compound annual rate of 27.47% over the last five years, outpacing the industry average of 10.01%
- Net profit for FY 2023-24 was ₹687 crore, with a slight decline of 1.02% compared to the previous year, despite a 22.93% rise in revenue.
- Promoter and institutional holdings have remained stable in recent quarters
**Summary**
MAXHEALTH has demonstrated robust long-term price appreciation and revenue growth, with a recent pullback from its all-time high. The stock trades at a premium valuation relative to sector peers, reflecting high growth expectations. Technicals show the stock is above key moving averages, and volatility remains elevated. Analyst targets suggest a broad range of possible outcomes, with the consensus leaning toward further upside, but caution is warranted due to the high valuation and recent profit stagnation
 Long
Long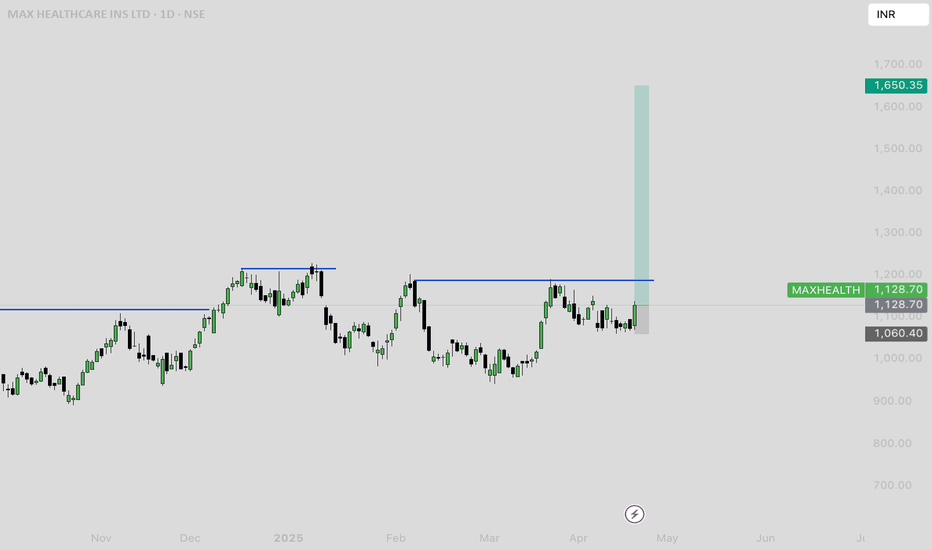
Som Distilleries & Breweries Ltd (SDBL) Price Analysis
- **Current Price:** ₹156.00 (all-time high as of April 22, 2025)
- **Day’s Range:** ₹127.66 – ₹143.40
- **Previous Close:** ₹128.38
- **Volume:** 13.36 million (well above 20-day average of 1.34 million)
- **52-Week Range:** ₹95.61 – ₹148.90 (new all-time high today)
- **VWAP:** ₹137.86
- **Market Cap:** ₹2,931 crore
### **Trend & Momentum**
- SDBL has surged sharply, breaking out to a new all-time high with exceptionally high volume, indicating strong bullish momentum
- The stock has rallied over 20% in a single session, moving far above recent resistance levels and its VWAP
- Technical patterns suggest a bullish formation with potential for further upside, possibly another 10% move, according to chartists
### **Support & Resistance**
- **Immediate Support:** ₹143.40 (today’s high), then ₹127.66 (today’s low), and ₹128.38 (previous close)
- **Resistance:** With a new all-time high at ₹156.00, the stock is in price discovery; next resistance will form as the stock trades higher
### **Valuation**
- **TTM PE:** 30.48 (sector PE: 88.54)
- **P/B:** 4.75
- **EPS (TTM):** ₹4.67 (+5.28% YoY)
- **Book Value per Share:** ₹30.02
### **Outlook**
- **Short-Term:** The breakout and volume spike suggest continued bullishness. However, after such a sharp rally, some profit booking or volatility is possible.
- **Medium-Term:** Sustained trade above ₹143–₹148 keeps the trend positive. Watch for consolidation near new highs before the next leg up.
- **Downside Risk:** If the stock falls below ₹143, it may retest support around ₹128–₹130
 Long
Long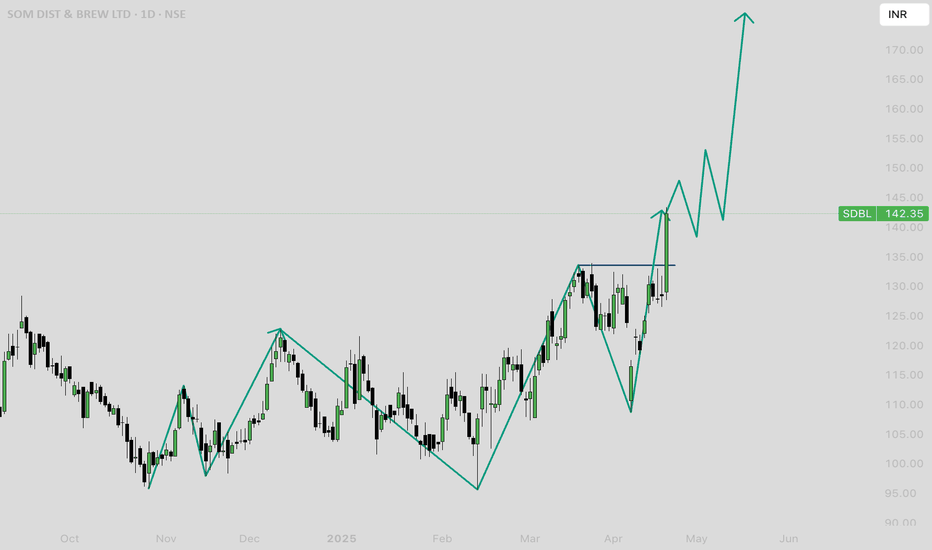
 Long
Long
 Long
Long
JUBLFOOD Probable price actionBased on the recent price action for Jubilant FoodWorks Ltd (JUBLFOOD), the stock shows a bullish trend in the short term:
1. The stock closed at ₹670.5 on February 14, 2025, up 1.27% from the previous close.
2. JUBLFOOD has been in an uptrend since late January 2025, rising from ₹638.65 on January 27 to the current price of ₹670.50.
3. The stock has shown strong momentum, breaking above the ₹700 level in early January before a brief pullback.
4. Recent price action indicates a recovery from the pullback, with the stock forming higher lows and higher highs since February 12, 2025.
5. The stock is trading above its 50-day moving average of ₹699.307, suggesting bullish sentiment in the medium term.
6. Volume has been above average in recent sessions, with 4,032,606 shares traded on February 14, compared to the average volume of 2,001,293.
7. The stock is showing strength relative to its 52-week range, currently trading closer to its year high of ₹796.75 than its year low of ₹421.05.
However, traders should note some potential resistance levels:
1. The stock may face resistance near the ₹700 level, which it failed to hold in early February.
2. The year high of ₹796.75 could act as a strong resistance if the uptrend continues.
Overall, the price action suggests a bullish short-term outlook for JUBLFOOD.
 Long
Long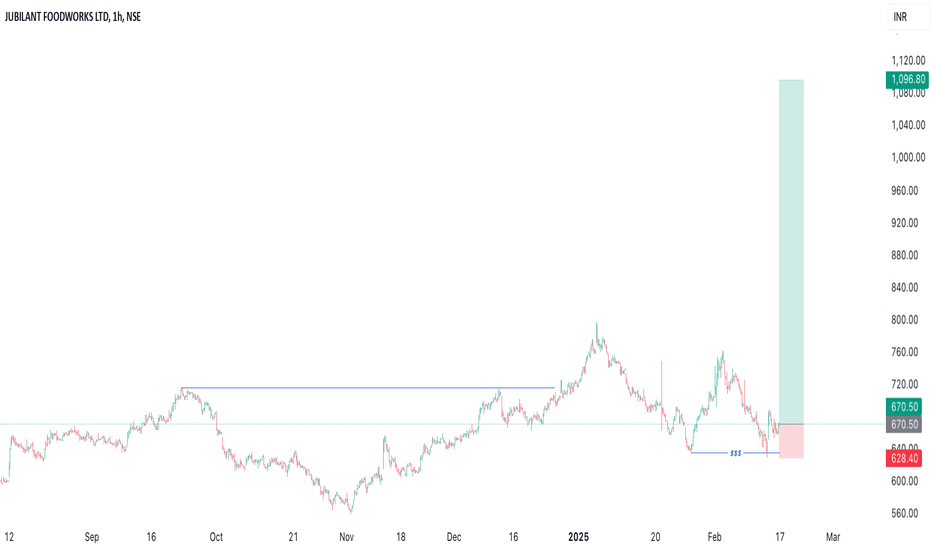
SHREECEM Price action analysisBased on the latest available data, the price action analysis for Shree Cement Ltd (SHREECEM) indicates a bullish trend in the short to medium term:
1. The stock is trading above its key moving averages, including the 5, 10, 20, 50, 100, and 200-day moving averages, suggesting strong upward momentum.
2. As of February 14, 2025, the stock was showing bullish signals for short-term, medium-term, and long-term investors.
3. The current price is significantly higher than the 200-day moving average of 26,081.26, indicating a sustained uptrend.
4. Recent price action has formed a cup and handle pattern on the daily chart, which is typically considered a bullish continuation pattern.
5. The stock has been in an uptrend since September 2023, breaking out of a sideways movement that had persisted since August 2022.
However, it's important to note some potential caution signals:
1. As of January 21, 2025, there were indications of a possible short-term downtrend, with the price falling below the important level of 25,422.22.
2. The stock was trading below its short-term Volume Weighted Average Price (VWAP) of 25,264.61, suggesting some selling pressure.
3. Technical indicators like ADX and MACD were showing sell signals in the short term as of January 21, 2025.
Given the conflicting signals between the January and February data, traders should closely monitor the stock for confirmation of the current trend and be aware of potential volatility.
 Long
Long
 Long
Long
 Short
Short
 Long
Long
 Long
Long
 Long
Long
 Long
Long
 Long
Long
 Long
Long
 Long
Long
 Long
Long
 Long
Long
 Long
Long
 Long
Long
 Long
Long