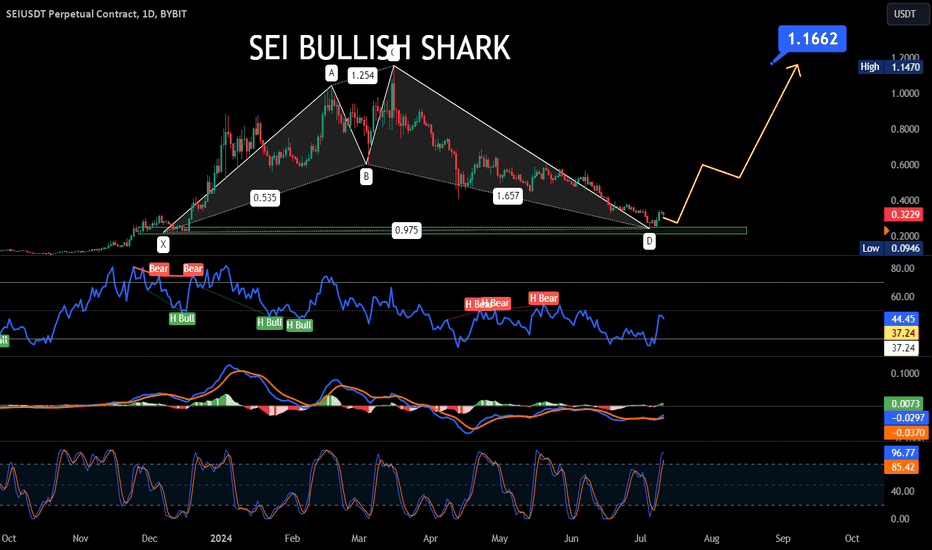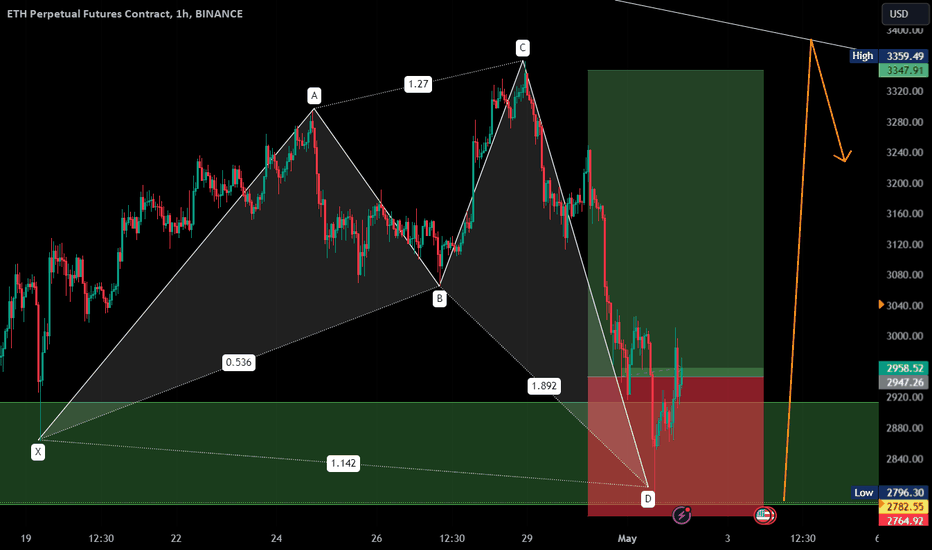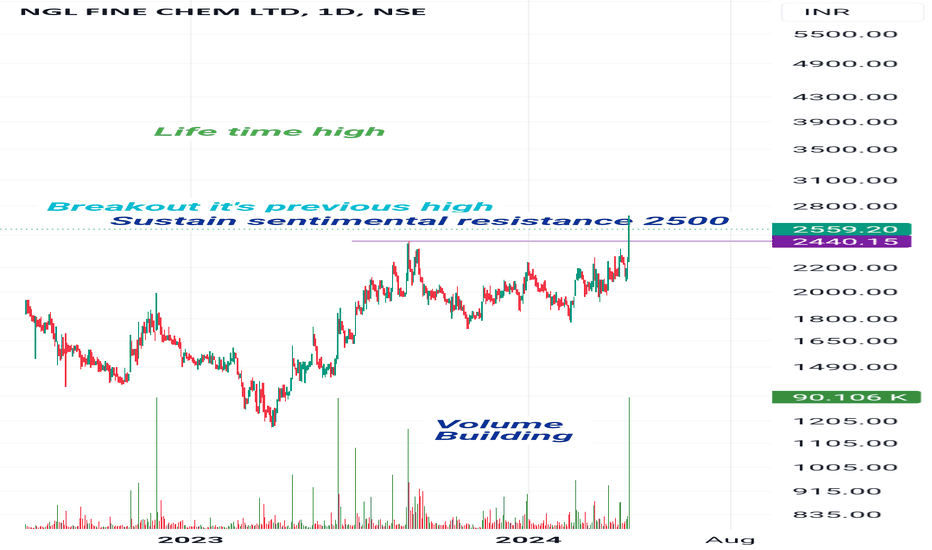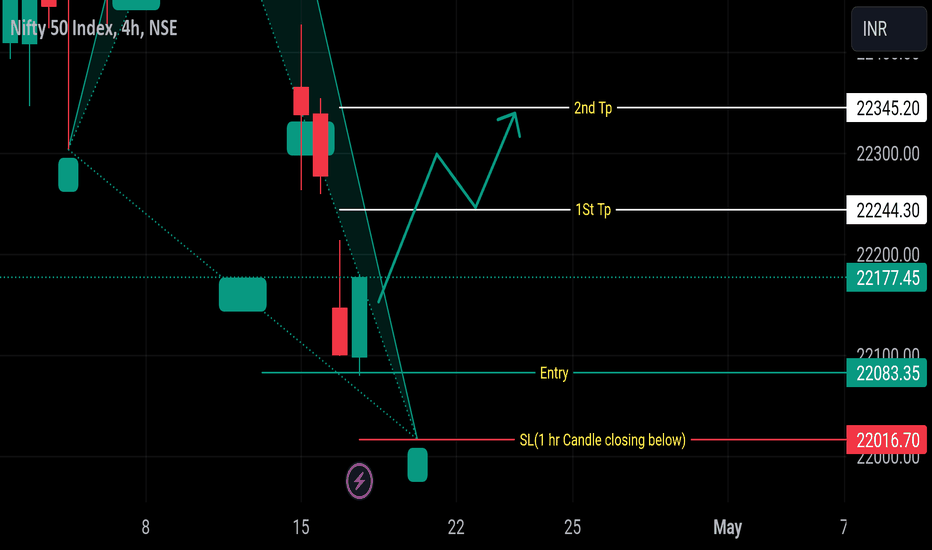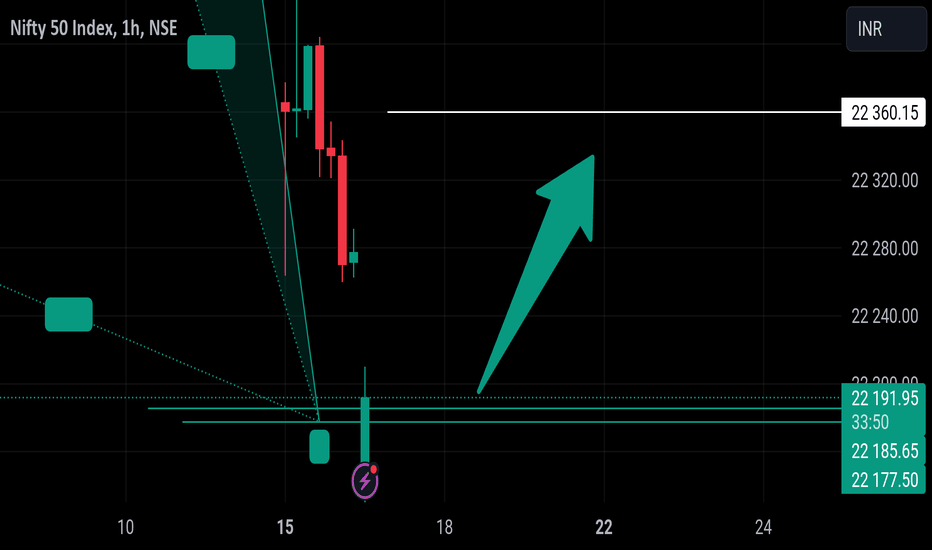
SEI/USDT: Bullish Shark Pattern Signals Potential RallySEI/USDT has formed a bullish shark pattern and is showing a bullish divergence bounce, indicating strength.
There is now a chance to retest the $0.30 level, after which a rally is expected.
The targets are $0.58 and $1.16.
#SEI #USDT #CryptoTrading #BullishSharkPattern #BullishDivergence #CryptoAnalysis #TradingTargets #CryptoRally #TechnicalAnalysis
Shark
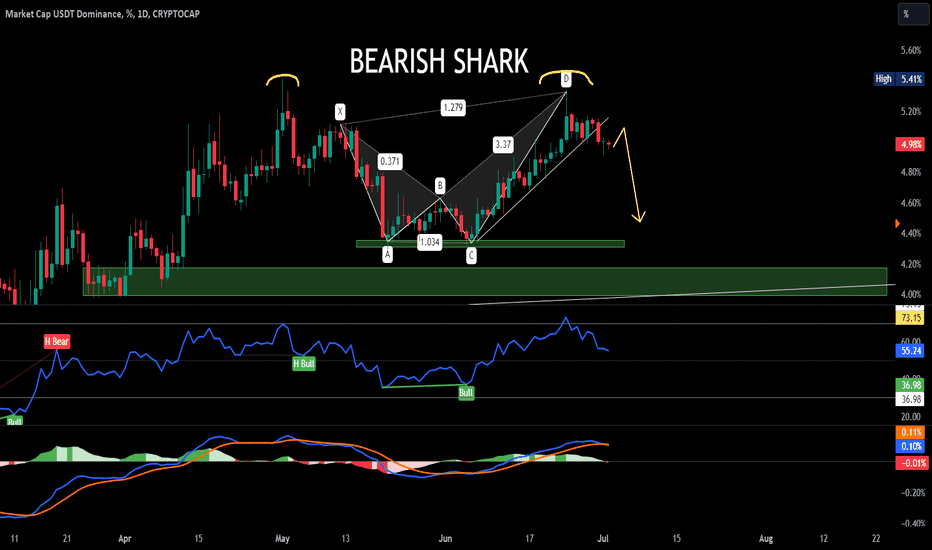
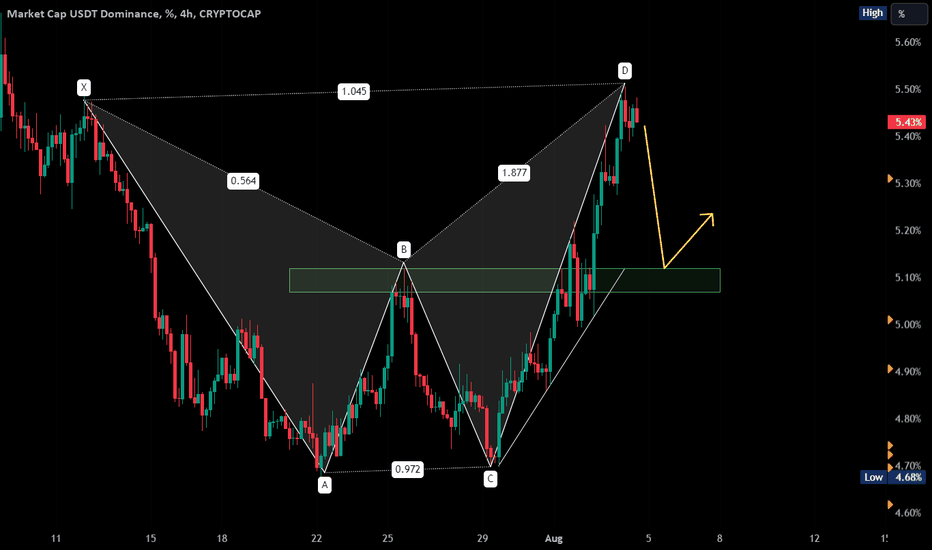
USDT.D Bearish Shark Pattern Signals Move to Key Support LevelsUSDT.D has formed a bearish shark pattern and has broken the support trendline, indicating a likely move towards the 4.6% and 4.10% support areas. The bearish confirmation is further supported by the RSI falling from the overbought zone and a clear bearish cross on the MACD.
#USDTDominance #BearishSharkPattern #TechnicalAnalysis #Crypto #RSI #MACD #SupportLevels #CryptoTrading
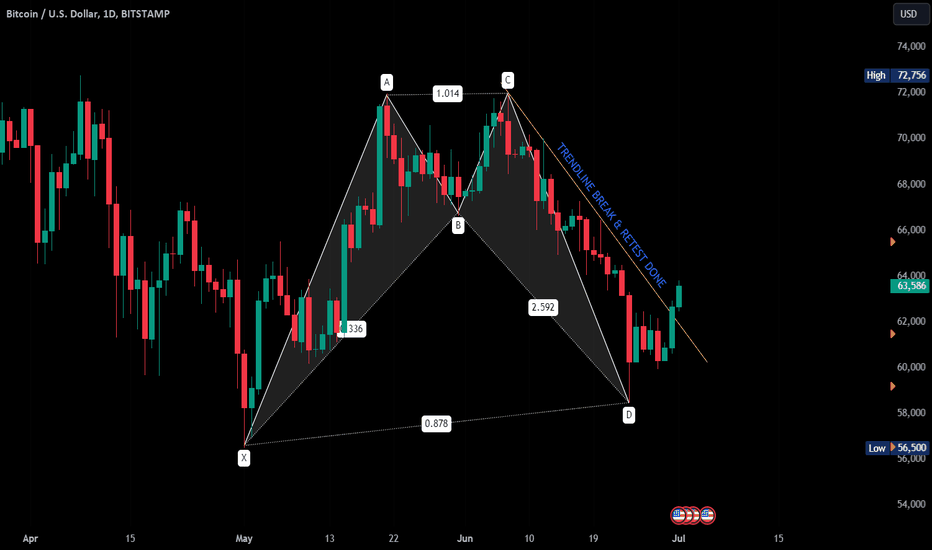
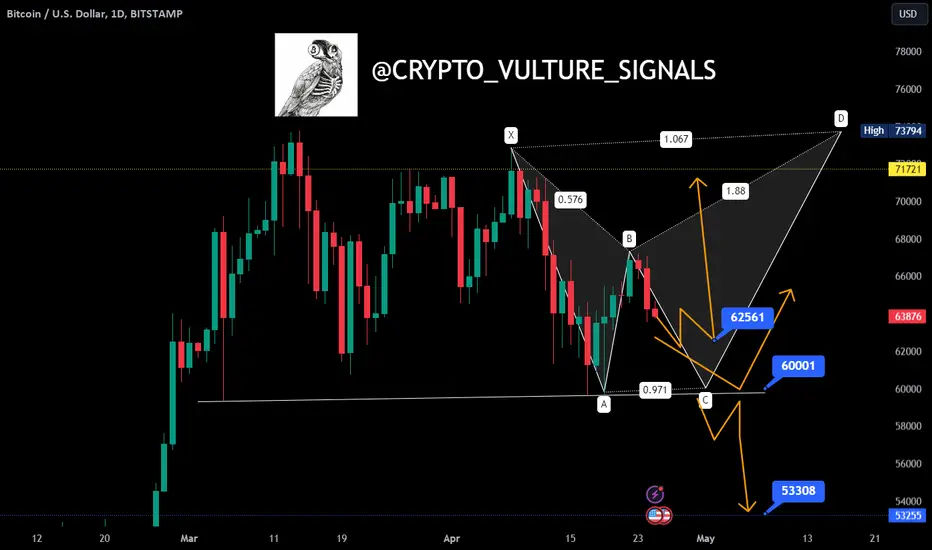
BTC Breaks Free from Downtrend: Next Stop $72KBitcoin Shows Bullish Signs: Breaks Downtrend, RSI Rebounds, Targeting $85K and $90K
Bitcoin has recently displayed strong bullish signals in the market. It formed a bullish divergence and successfully broke its downtrend. The RSI (Relative Strength Index) has bounced back from oversold levels, indicating increasing bullish momentum.
To sustain this upward trend, Bitcoin now needs to surpass key resistance levels at $64,500 and $72,000. If these levels are breached, new targets of $85,000 and $90,000 come into focus, potentially marking significant milestones for BTC's price trajectory.
This combination of technical indicators suggests a bullish outlook for Bitcoin in the near term.
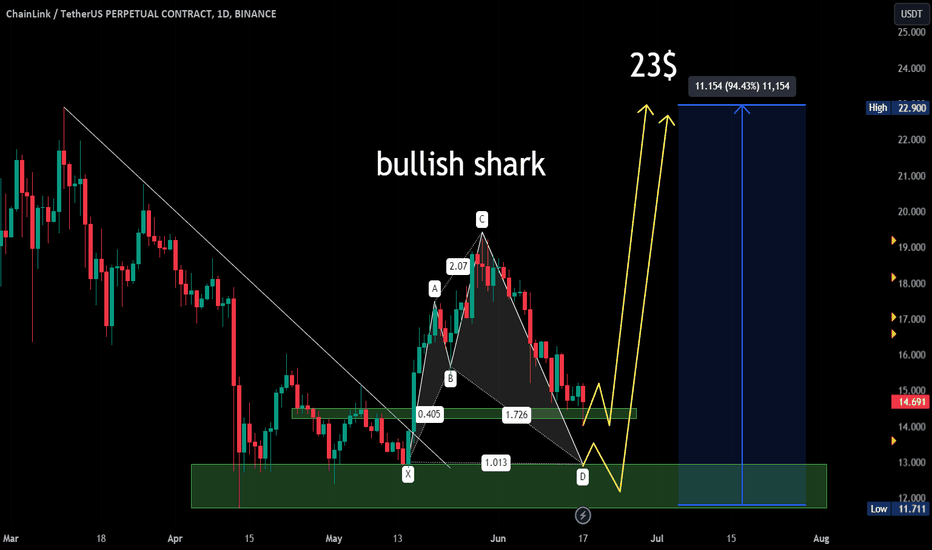
LINK's Bullish Shark Pattern: Retest Bounce Targets $23 with 100#Chainlink ( BIST:LINK ) is currently forming a bullish shark pattern, a harmonic pattern that indicates a potential reversal and a strong buying opportunity.
In this scenario, LINK's price is expected to bounce with retest of a crucial support level. The RSI (Relative Strength Index) has reached the oversold area, suggesting that the asset is undervalued and may soon experience a reversal.
If LINK successfully retests the support level and bounces, the bullish momentum could propel it to a significant target of $23. This move would represent an almost 100% return from the current price level.
NEAR/USDT: Bullish Shark Pattern Signals a Potential 60% Upside#NEAR/USDT has formed a bullish shark pattern & the RSI (Relative Strength Index) is currently in the oversold area, suggesting that for a rebound.
Currently, NEAR is standing at a bullish support trend line, which further reinforces the potential for an upward move. Given these strong technical signals to deliver a 60% profit.
#LINK/USDT FORMED DOUBLE BOTTOM PATTERN #LINK/USDT has recently shown a bullish shark and double bottom pattern, indicating a potential uptrend. The price has bounced from the buy liquidity support area at $11.5, suggesting a strong level of buying interest at that price point. This could signal a reversal in the current downtrend and a possible move towards higher price levels.
#LINK/USDT FORMED BULLISH SHARK #LINK/USDT has recently formed a bullish shark pattern, indicating a potential double bottom formation. If this pattern plays out, there is a chance for the price to reach around $11, where it could potentially grab liquidity before making a significant upward move towards the moon.
BIG Bounce Or Fall? Banknifty Simple Analysis for tomorrowRecap:
As mentioned yesterday's analysis Bank nifty started with fake break out after firing 2 strong bullish candle on 15min & then a sudden dip trapped many players. But still strong support 46900 helped saved bulls to reach again for a breakout but failed & BN closed at support 46900.
Analysis for Next Day:
Bears have started dominating as seen today bulls failed to break 47200-47300 level twice also confirms bears presence more then bulls. Again mentioning bullish presence is strong above 47300.
Trend line support has also been broken in last 30 min session today & closed at support. if BN open below 46900 this can be bearshish move. Keep eyes on opening print.
Bulls can bounce from daily resistance if gap up opening is seen & for momentum they need to cross 47300.
Looks like may be it will a sideways day tomorrow.
Support : 46900,46700
Resistance : 47100,47300
Note : Do your own analysis before making any trade decesions.