Shooting Star
MCX ,1D formed shooting starNSE:MCX Multi Commodity Exchange of India Ltd is a commodity exchange based in India. It was established in 2003 by the Government of India and is currently based in Mumbai. It is India's largest commodity derivatives exchange.
MCX formed shooting star at daily timeframe (and gave closing below it) on resistance of parallel channel.
Entry : 1796
Target : 1648
SL : 1885
RR : 1.66
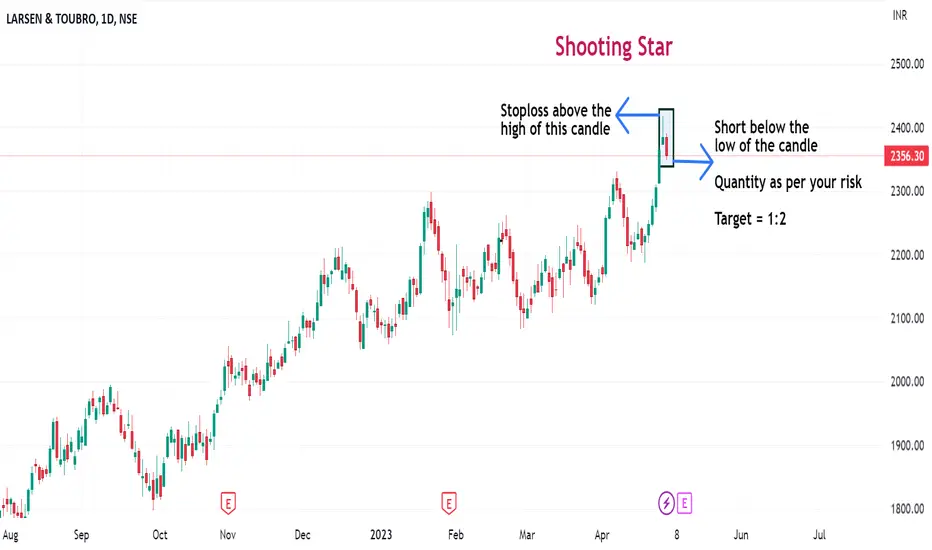
Shooting Star formed on LT, 1DNSE:LT Larsen & Toubro Ltd, commonly known as L&T, is an Indian multinational conglomerate company, with business interests in engineering, construction, manufacturing, technology, information technology and financial services, headquartered in Mumbai & Technical services, headquartered in Chennai.
LT forms Shooting Star after an uptrend and gave closing below it.
Entry : 2906.75
Target : 2760
SL : 3015
RR : 1.36
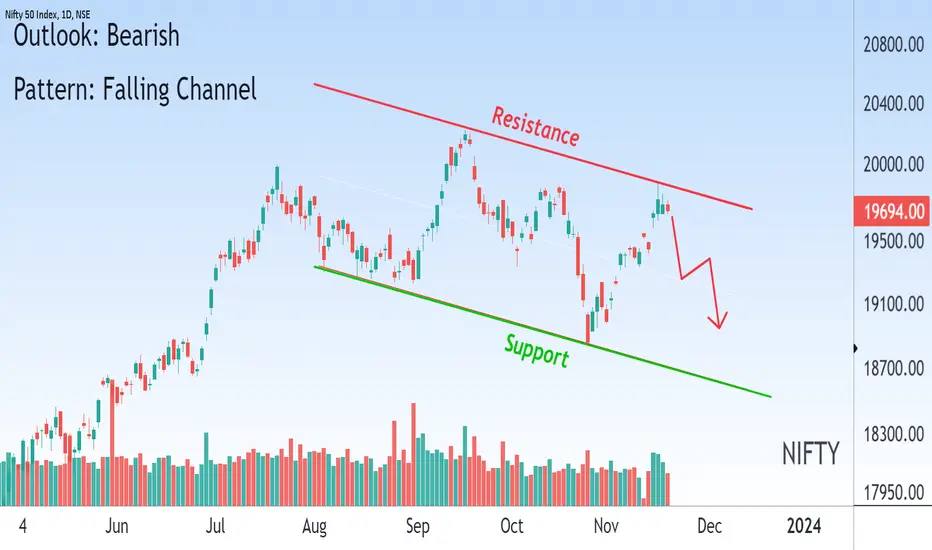
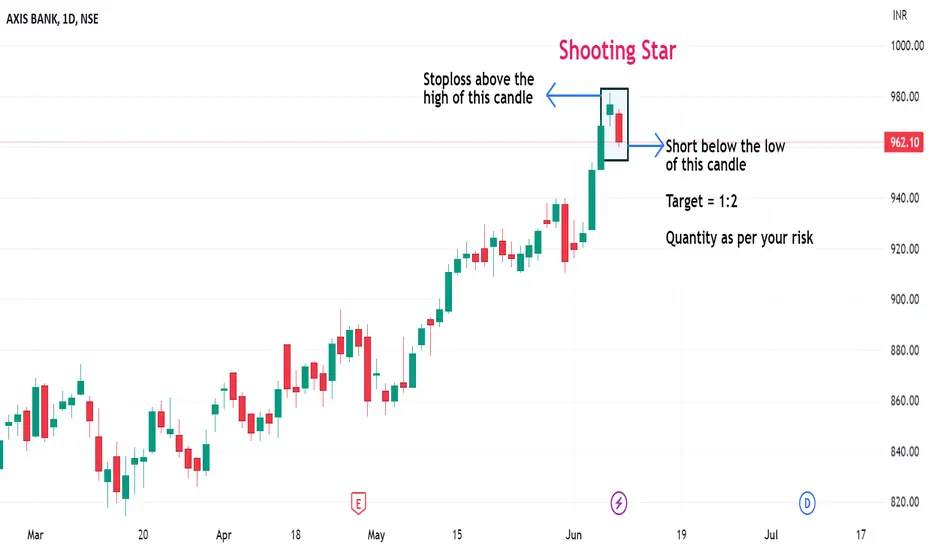
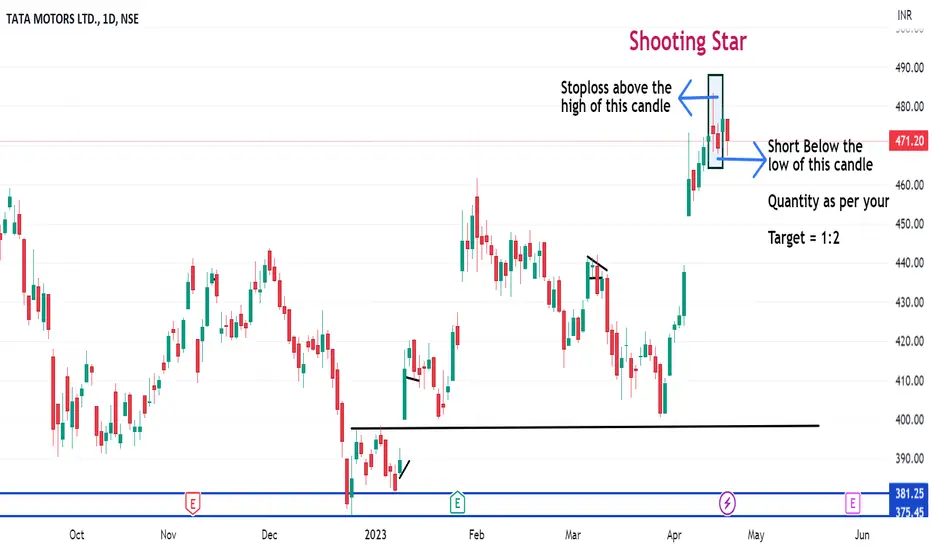
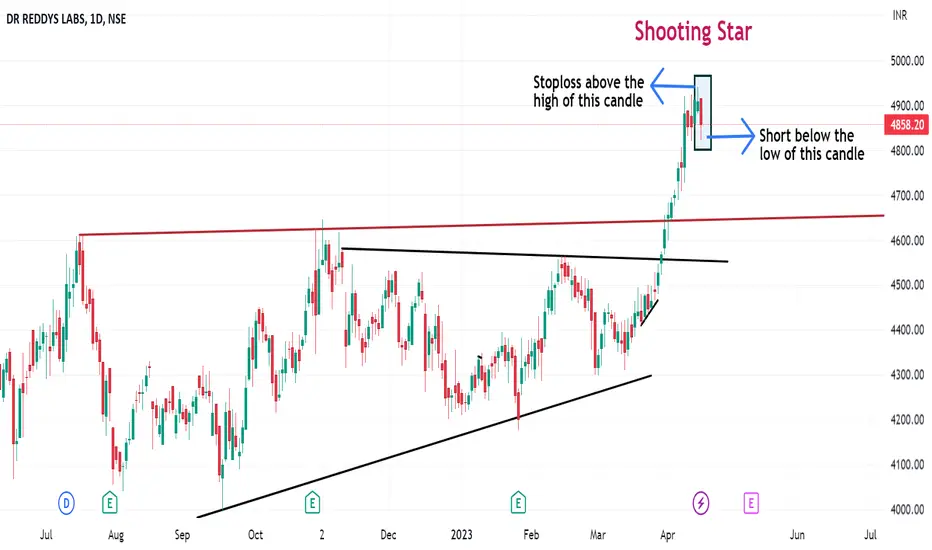
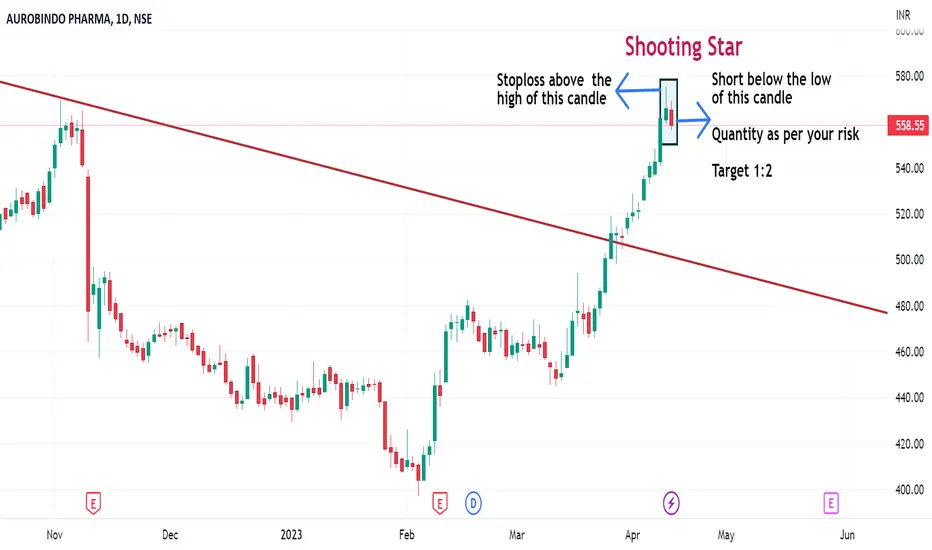
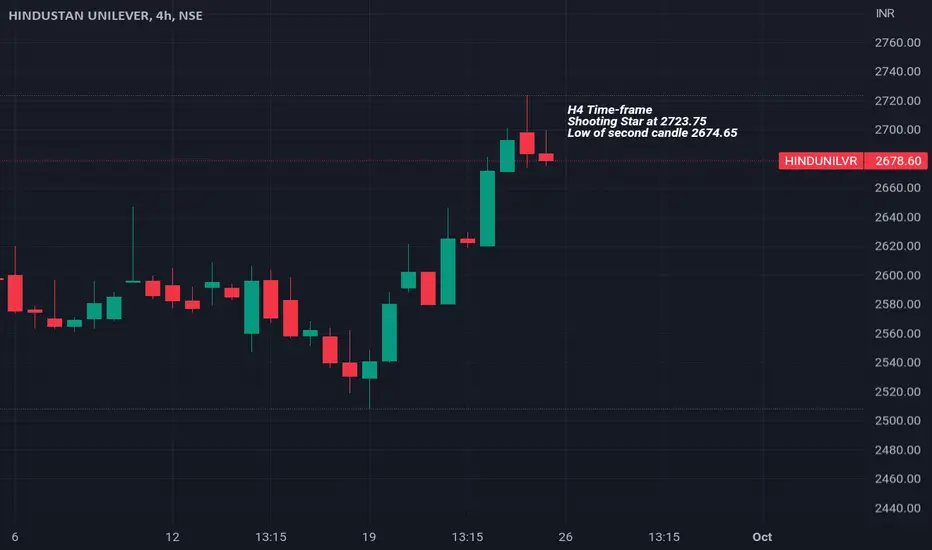
Shooting Star A shooting star occurs after an advance and indicates the price could start falling.
The formation is bearish because the price tried to rise significantly during the day, but then the sellers took over and pushed the price back down toward the open.
Traders typically wait to see what the next candle (period) does following a shooting star . If the price declines during the next period they may sell or short.
If the price rises after a shooting star , the formation m
Shooting Star A shooting star occurs after an advance and indicates the price could start falling.
The formation is bearish because the price tried to rise significantly during the day, but then the sellers took over and pushed the price back down toward the open.
Traders typically wait to see what the next candle (period) does following a shooting star . If the price declines during the next period they may sell or short.
If the price rises after a shooting star , the formation ma
APOLLOTYRE Bears Getting Ready to Roll it Down!!!!!Chart pattern looks prudent and paving way for the above titled short view
REASONS
1. Apollotyre has been trading inside the Expanding Triangle ( shown below - Monthly wholesome view )
2. Now, it seems it has finished the upswing move and ready for downswing inside the channel .
3. Weekly time frame shows the Ascending channel in which it is travelling smoothly respecting the levels.
4. Shooting star weekly candle at the perfect trendline resistance adds probability to th
Shooting Star A shooting star occurs after an advance and indicates the price could start falling.
The formation is bearish because the price tried to rise significantly during the day, but then the sellers took over and pushed the price back down toward the open.
Traders typically wait to see what the next candle (period) does following a shooting star . If the price declines during the next period they may sell or short.
If the price rises after a shooting star , the formation m
Shooting Star A shooting star occurs after an advance and indicates the price could start falling.
The formation is bearish because the price tried to rise significantly during the day, but then the sellers took over and pushed the price back down toward the open.
Traders typically wait to see what the next candle (period) does following a shooting star . If the price declines during the next period they may sell or short.
If the price rises after a shooting star , the formation
Shooting Star A shooting star occurs after an advance and indicates the price could start falling.
The formation is bearish because the price tried to rise significantly during the day, but then the sellers took over and pushed the price back down toward the open.
Traders typically wait to see what the next candle (period) does following a shooting star . If the price declines during the next period they may sell or short.
If the price rises after a shooting star , the formation m
Shooting Star A shooting star occurs after an advance and indicates the price could start falling.
The formation is bearish because the price tried to rise significantly during the day, but then the sellers took over and pushed the price back down toward the open.
Traders typically wait to see what the next candle (period) does following a shooting star . If the price declines during the next period they may sell or short.
If the price rises after a shooting star , the format
Shooting Star A shooting star occurs after an advance and indicates the price could start falling.
The formation is bearish because the price tried to rise significantly during the day, but then the sellers took over and pushed the price back down toward the open.
Traders typically wait to see what the next candle (period) does following a shooting star . If the price declines during the next period they may sell or short.
If the price rises after a shooting star , the formation
Shooting Star A shooting star occurs after an advance and indicates the price could start falling.
The formation is bearish because the price tried to rise significantly during the day, but then the sellers took over and pushed the price back down toward the open.
Traders typically wait to see what the next candle (period) does following a shooting star . If the price declines during the next period they may sell or short.
If the price rises after a shooting star , the formati
Shooting StarA shooting star occurs after an advance and indicates the price could start falling.
The formation is bearish because the price tried to rise significantly during the day, but then the sellers took over and pushed the price back down toward the open.
Traders typically wait to see what the next candle (period) does following a shooting star . If the price declines during the next period they may sell or short.
If the price rises after a shooting star , the formation may
Shooting Star A shooting star occurs after an advance and indicates the price could start falling.
The formation is bearish because the price tried to rise significantly during the day, but then the sellers took over and pushed the price back down toward the open.
Traders typically wait to see what the next candle (period) does following a shooting star . If the price declines during the next period they may sell or short.
If the price rises after a shooting star , the formation
Dark cloud cover confirmation: shooting star, what's next?Last week, we saw a huge sell-off, that resulted in the formation of a shooting star. Such a pattern has major implications if it is seen at top of the trend. It depicts sentiment reversal.
Last, to last week we saw a dark cloud formation, now the following candle is a shooting star.
It clearly shows the overall sentiment.
Same thing you would observe if you see, the option chain. Very few positions are carried out for Monday
Calls are being added at an important price level.
17500, 17800, 18000
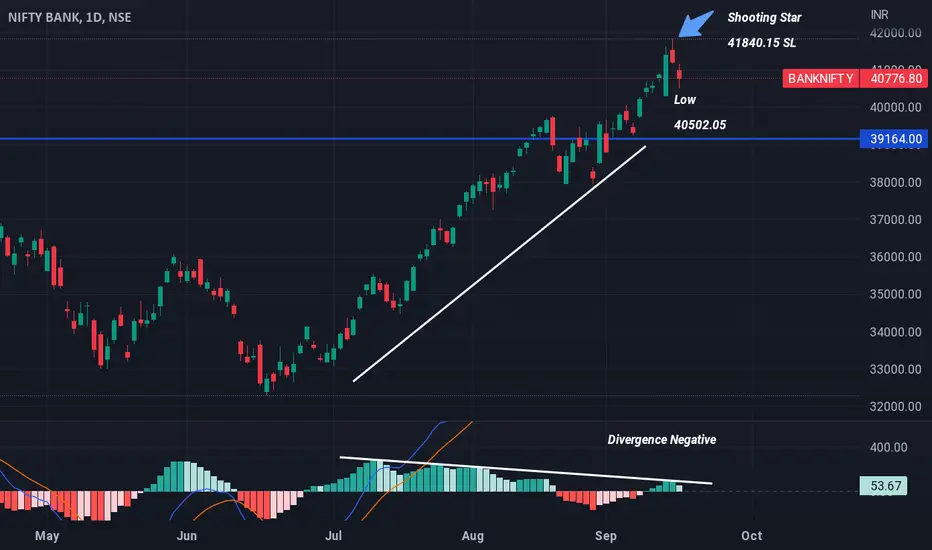
BankNifty Daily Chart Analysis On daily chart banknifty looks weak as it formed shooting Star pattern with negative divergence.
Details of SL , low of second candle and 1:1 target mentioned in the chart.
We can short when it breaks low of second candle. Just remember it's on daily chart it will take time.
One candle per day.