Shooting Star
Bearish Engulfing in NiftyNifty has formed bearish engulfing on daily basis and shooting star in a weekly chart.
Dual bearish candle at downtrend line showing weakness in Nifty.
RSI is in overbought zone and now started moving down from above 80 to 70 level.
Short term trend is still bullish but below 17700 or breaking below regression line, trend will reverse.
Nifty Short below 17700
Stop Loss above 18000
Target 1 - 16800
Target 2 - 15200
Shooting Star - Complete GuideWhat is the Shooting Star candlestick pattern?
A shooting star candlestick pattern is a chart formation that occurs when an asset’s market price is pushed up quite significantly, but then rejected and closed near the open price. This creates a long upper wick, a small lower wick and a small body.
The upper wick must take up at least half of the length of the candlestick for it to be considered a shooting star. And, it must appear at the top of an uptrend. As a result, the shooting star candle
MULTIPLE DOT IN BANKNIFTYHello every one if your zoom in the chart which was uploaded earlier, you can find a great multiple DOT level achieved this particular one chart.
for you ready reference particular chart attached. happy trading and have profitable week...
we are here to provide you 100% accurate chart and as we achieve the same thanks....
ACC (Bearish)ACC:
Industry: Cement and Cement Products
The stock is discounted at 17% from all time high levels.
Daily Chart:
1. Respecting its falling trendline
2. Forming RSI Bearish Divergence (Stock is forming HH and RSI is forming LL)
3. Formed Doji and Shooting Star (bearish candles) on trendline
Addl Points:
1. FII/FPI have decreased holdings from 13.76% to 12.75% in Mar 2022 qtr
2. Mutual Funds have increased holdings from 8.85% to 9.23% in Mar 2022 qtr.
Notes:
The above analysis is just f
Price Action Analysis with Candlesticks(Part-1)
Price is the cumulative result of all market information. Hence, technical analysts use price charts and chart patterns in their market study. candlesticks have become the most popular chart type for price action analysis.
we have 3 methods to identify price action with candlesticks.
1.One Price Bar (Pin Bar)
2.Two Price Bars (Inside and Outside Bar)
3. Three Price Bars (MS and ES)
In this post we discussed about One Price Bar only. we can post Remaining 2 concepts later.
Hindustan Unilever is showing signs of bearishness Hindustan Unilever is showing signs of bearishness
Reasons/Traits :
• Daily Trend far away from 20 EMA
• Uptrend is in pause mode
• Bearish Harami followed by two shooting stars/inverted hammer formed (Chances of going down)
• Since 17 sessions stock did not retrace
• Volume is decreasing
• RSI and MACD in overbought zone
• For a healthy uptrend retracement need to happen
What can happen next :
Scenario 1 : If we consider 6th Sep shooting star as retest then price going down below 2757 can ta
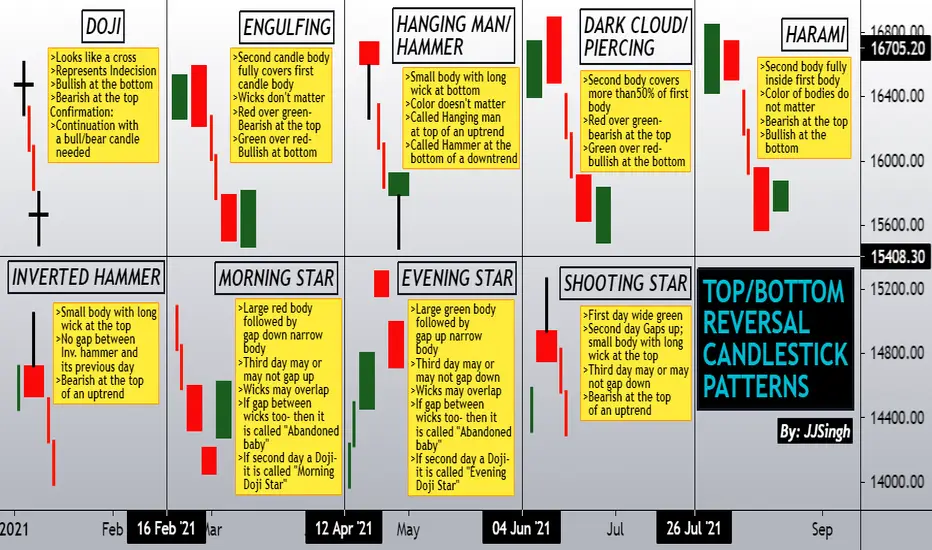
TOP/BOTTOM REVERSAL CANDLE PATTERNSHi
Its been a while since my last post. In this post I have represented selective candlestick reversal patterns.
In a candlestick, "body" represents the distance between candle OPEN and CLOSING price. Whereas "wicks" represent the entire range of the candle from TOP to the BOTTOM.
In most of these patterns only bodies are important. There are no conditions for wicks unless specifically mentioned like in abandoned baby star and (first two candles of) shooting star pattern. In an abandoned baby