EURO Ready For Another DIP? Short Target of 1000+Pips!Hey everyone! It’s been a minute, but I'm back with a HUGE swing opportunity on EUR/USD! 🔥
Zoom out on the Weekly TF and look at this setup we’ve got a clear declining triple top / rounding top pattern pushing right up against major trendline resistance! We are prime and ready for a massive markdown! 💥
⏳ The Play: This is a high-patience swing trade. Expect it to unfold over 2.5 to 3 months, so stick to the Weekly chart and let the trade work its magic! This is the ultimate test of trader discipline HOLD YOUR WINNERS! 💪
🎯 Risk/Reward Ratio: An insane 9.30 R:R!
⚡ Trigger: Wait for confirmation enter ONLY on a strong red candle breakdown.
🛑 Stop Loss: Above the entry candle or tailored to your risk management.
Let's catch this move! Drop your thoughts below! 👇
Supply and Demand
Midnifty Intraday Analysis for 22nd July 2026NSE:NIFTY_MID_SELECT
Index is near resistance and if the index sustain above 14850 then -
The upward movement may lead the Index near 14975 – 15000 resistance range and if the index crosses and sustains above this level then may reach 15150 – 15175 range.
On the contrary, The downward moment may drag the index to 14650 – 14625 support range and if this support is broken then index may tank near 14475 – 14450 range.
360 ONE WAM Ltd. (1W) – Technical AnalysisOverall Trend
The long-term trend remains bullish, as the stock has rallied significantly from the ₹400–500 zone to above ₹1,300. However, after this strong advance, the stock has entered a multi-month consolidation phase.
Chart Pattern
The price is trading inside a symmetrical triangle, characterized by:
Lower highs, indicating sellers are gradually pushing prices down.
Higher lows, showing buyers continue to accumulate at higher levels.
Declining price swings, suggesting volatility is contracting before a potential expansion.
This pattern reflects indecision between buyers and sellers and often precedes a strong directional move.
Current Price Action
Current Price: ₹1,113.70
The stock is trading near the middle of the triangle, where the risk-to-reward is generally less favorable.
Neither buyers nor sellers currently have a decisive advantage.
Key Resistance
Upper trendline: Approximately ₹1,170–1,200
A weekly close above this zone would indicate increasing bullish momentum.
Key Support
Lower trendline: Approximately ₹980–1,020
Holding above this support keeps the consolidation structure intact.
Bullish Scenario
A convincing weekly breakout above the upper trendline, supported by strong volume, could confirm the continuation of the primary uptrend.
Potential upside targets:
₹1,300
₹1,400
₹1,500+ if momentum remains strong.
Bearish Scenario
If the stock breaks below the lower trendline with a strong weekly close, it would invalidate the triangle pattern.
Possible downside targets:
₹900
₹850
₹780 in an extended correction.
Volume Observation
Volume confirmation is crucial.
High volume breakout increases the probability of a sustained move.
Low volume breakout carries a higher risk of becoming a false breakout.
Trading Strategy
Aggressive traders: Wait for a confirmed breakout above the upper trendline before initiating fresh long positions.
Conservative investors: Wait for both a breakout and a successful retest of the broken trendline before entering.
Avoid taking large positions while the stock remains inside the triangle, as false moves are common during consolidation.
Technical Outlook
Bias: Neutral to Bullish
The long-term structure remains positive, but the stock is currently in a consolidation phase. The next major trend will likely be determined by a decisive breakout from the symmetrical triangle. Until then, patience is preferable to anticipating the direction.
NIFTY DAILY / Short Range Level Analysis for 23rd Jul 2026🔕 SGMN SplD BULLISH Above => 24046.
🔕 SGMN SplD Bearish BELOW => 23993.
Mentioned analysis based on 2 consecutive candle close in 15 min Time Frame.
━━━━━🟥🟧🟨🟩🟦🟪⬛━━━━━
💥Level Interpretation / description:
✍🏻L#1: If the candle crossed & stays above the “Buy Gen”, it is treated / considered as Bullish bias. Cfm=> Confirmation.
L#2: Possibility / Probability of REVERSAL near 🔕RL/TF1 & 🔔RL/TF2
L#3: If the candle stays above “Sell Gen” but below “Buy Gen”, it is treated / considered as Sidewise. Aggressive Traders can take Long position near “Sell Gen” either retesting or crossed from Below & vice-versa i.e. can take Short position near “Buy Gen” either retesting or crossed downward from Above.
L#4: If the candle crossed & stays below the “Sell Gen”, it is treated / considered a Bearish bias.
L#5: Possibility / Probability of REVERSAL near 🔕RL/TF1 & 🔔RL/TF2
HZB (Buy side) & HZS (Sell side) => Hurdle Zone,
✍🏻 *** Specialty of “HZB#1, HZB#2 HZS#1 & HZS#2” is Sidewise (behaviour in Nature)
Rest Plotted and Mentioned on Chart
Color code Used:
Green, BLUE =. Positive bias.
Safron, RED =. Negative bias.
RED in Between Green means Trend Finder / Momentum Change
/ CYCLE Change and Vice Versa.
Notice One thing: HOW LEVELS are Working.
Use any Momentum Indicator / Oscillator or as you "USED to" to Take entry.
━━━━━🟥🟧🟨🟩🟦🟪⬛━━━━━
⚠️ DISCLAIMER:
The information, views, and ideas shared here are purely for educational and informational purposes only. They are not intended as investment advice or a recommendation to buy, sell, or hold any financial instruments. I am not a SEBI-registered financial adviser.
Trading and investing in the stock market involves risk, and you should do your own research and analysis. You are solely responsible for any decisions made based on this research.
"🔔As HARD EARNED MONEY IS YOUR's, So DECISION SHOULD HAVE TO BE YOUR's".
━━━━━🟥🟧🟨🟩🟦🟪⬛━━━━━
❇️ Follow notification about periodical View
💥 Do Comment for Stock WEEKLY Level Analysis.🚀
📊 Do you agree with this view?
✈️ HIT THE PLANE ICON if this technical observation resonates with you. It will Motivate me.
━━━━━🟥🟧🟨🟩🟦🟪⬛━━━━━
💡 If You LOOKING any CHART & want for Level and ANALYZE?
Share your desired stock names in the comments below! I will try to analyze the chart Levels, patterns and share my technical view (so far my Knowledge).
If Viewers think It can identify meaningful setups. Looking forward to hearing from all of you — let's keep this discussion going and help each other make better trading decisions.
___________🔕^^^⚫⚪^🙏🏼🙏🏼🙏🏼^⚪⚫^^^🔔___________
COSMOFIRST: Breakout or Liquidity Grab?NSE:COSMOFIRST
After months of recovery, Cosmo First is approaching a major resistance zone near ₹900-916, where historical supply is expected to emerge. While a breakout may attract momentum buyers, the real focus is on how price behaves after the breakout .
One possible scenario is a liquidity grab —a brief move above resistance to trigger breakout participation, followed by a controlled pullback. If the decline occurs on declining volume and finds support around the newly formed demand zone near ₹845–860, it would suggest supply absorption rather than distribution.
A successful reclaim of the breakout level with renewed buying pressure could pave the way for the next leg of the uptrend. ⭐⭐⭐⭐⭐
Key observations:
⭐ 📈 Higher High & Higher Low structure remains intact.
⭐ 📊 EMA alignment continues to improve, supporting the bullish trend.
⭐ 🔍 Watch for high volume on breakout and low volume on pullback.
⭐ 🎯 The quality of the retest is likely to be more important than the breakout itself.
⭐ ❌ Invalidation: Failure to hold the ₹845–850 demand zone after the breakout, especially on expanding selling volume, would invalidate the current bullish setup.
⭐ Patience is often rewarded. Let price confirm the story before drawing conclusions. ⭐
--------------------------------------------------------------------------------------------------------
Disclaimer
This chart is shared purely for educational and market observation purposes. It reflects personal analysis based on price action, volume, and market structure, and should not be considered financial, investment, or trading advice. Please conduct your own research and manage risk appropriately before making any trading or investment decisions.
The trendline is broken but not the demand zone!As we can see though the trendline has been broken down but the demand zone remains intact which shows there is still no confirmation of the further bearishness as it has closed above the demand zone. We may expect NIFTY to continue its bearishness if NIFTY breaks below its last day's low. Until then we can expect NIFTY to remain between the range. So, plan your trades accordingly and keep watching everyone.
NIFTY remains sideways yet another day! As we can see NIFTY remained sideways throughout the day exactly as analysed. It is likely to remain sideways until it breaks and sustains itself above or below either of the levels. Additionally, we can expect NIFTY to show a strong unidirectional move either side as it had been consolidating since last few months now, making both demand and supply zone weak. Hence break of either of the levels could show strong unidirectional move. So plan your trades accordingly and keep watching everyone.
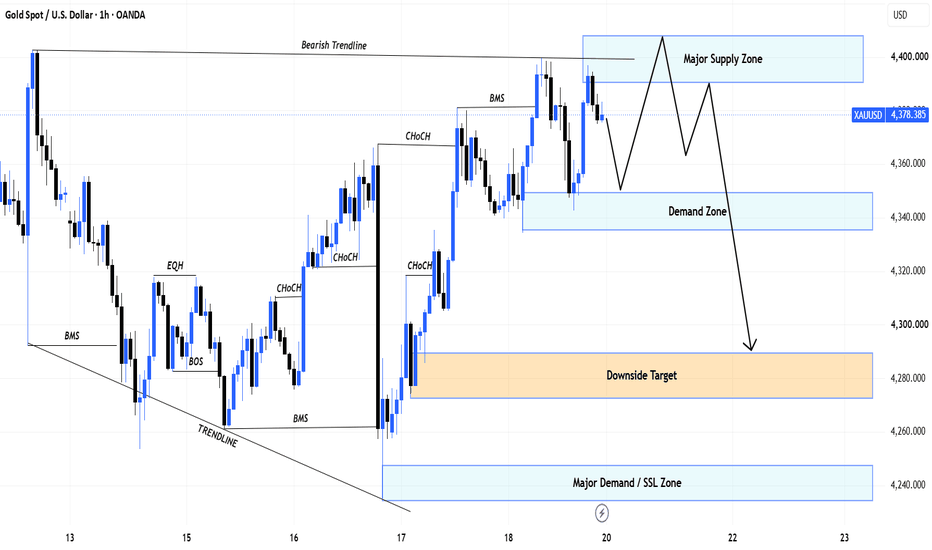
XAUUSD GOLD ANALYSIS ON (21 JUL 2026)#XAUUSD UPDATEDE
SELL LIMITED - 4078-4088
If price stay below 4110, then next target 4040,4010 and 3970 and above that 4150
Plan;If price break 4078-4088 area,and stay below 4080,we will place sell order in gold with target of 4040,4010 and 3970 & stop loss should be placed at 4110
Nifty Intraday Analysis for 22nd July 2026NSE:NIFTY
Index is near 24200 - 24250 resistance zone and if the index sustain above this resistance, then -
The upward movement may lead to 24400 – 24450 resistance range and if the index crosses and sustains above this level then may reach near 24650 – 24700 range.
On the contrary, The downward moment may drag the Index to 23950 – 23900 support range in downward momentum and if this support is broken then index may tank near 23700 – 23650 range.
Nifty Intraday Analysis for 21st July 2026NSE:NIFTY
Index is the range between 24000 - 24350 range and range bound moment is expected as long as the index will be in this range. If index breaks and sustain above 24350, then -
The upward movement may lead to 24450 – 24500 resistance range and if the index crosses and sustains above this level then may reach near 24700 – 24750 range.
On the contrary, The downward moment may drag the Index to 24000 – 23950 support range in downward momentum and if this support is broken then index may tank near 23750 – 23700 range.
Banknifty Intraday Analysis for 22nd July 2026NSE:BANKNIFTY
Index near 58000 - 58100 resistance if Index could not break and sustain above this resistance then break down below 57700 will drag to Index down.
The upward moment may lead the Index to 58500 – 58600 resistance range in upward momentum and if the index crosses and sustains above this level then may reach near 59200 – 59300 range.
On the contrary, The downward moment may drag the Index to 57200 – 57100 support range in downward momentum and if this support is broken then the index may tank near the 56500 – 56400 range.
NIFTY DAILY / Short Range Level Analysis for 22nd Jul 2026🔕 SGMN SplD BULLISH Above => 24257.
🔕 SGMN SplD Bearish BELOW => 24122.
Mentioned analysis based on 2 consecutive candle close in 15 min Time Frame.
━━━━━🟥🟧🟨🟩🟦🟪⬛━━━━━
💥Level Interpretation / description:
✍🏻L#1: If the candle crossed & stays above the “Buy Gen”, it is treated / considered as Bullish bias. Cfm=> Confirmation.
L#2: Possibility / Probability of REVERSAL near 🔕RL/TF1 & 🔔RL/TF2
L#3: If the candle stays above “Sell Gen” but below “Buy Gen”, it is treated / considered as Sidewise. Aggressive Traders can take Long position near “Sell Gen” either retesting or crossed from Below & vice-versa i.e. can take Short position near “Buy Gen” either retesting or crossed downward from Above.
L#4: If the candle crossed & stays below the “Sell Gen”, it is treated / considered a Bearish bias.
L#5: Possibility / Probability of REVERSAL near 🔕RL/TF1 & 🔔RL/TF2
HZB (Buy side) & HZS (Sell side) => Hurdle Zone,
✍🏻 *** Specialty of “HZB#1, HZB#2 HZS#1 & HZS#2” is Sidewise (behaviour in Nature)
Rest Plotted and Mentioned on Chart
Color code Used:
Green, BLUE =. Positive bias.
Safron, RED =. Negative bias.
RED in Between Green means Trend Finder / Momentum Change
/ CYCLE Change and Vice Versa.
Notice One thing: HOW LEVELS are Working.
Use any Momentum Indicator / Oscillator or as you "USED to" to Take entry.
━━━━━🟥🟧🟨🟩🟦🟪⬛━━━━━
⚠️ DISCLAIMER:
The information, views, and ideas shared here are purely for educational and informational purposes only. They are not intended as investment advice or a recommendation to buy, sell, or hold any financial instruments. I am not a SEBI-registered financial adviser.
Trading and investing in the stock market involves risk, and you should do your own research and analysis. You are solely responsible for any decisions made based on this research.
"🔔As HARD EARNED MONEY IS YOUR's, So DECISION SHOULD HAVE TO BE YOUR's".
━━━━━🟥🟧🟨🟩🟦🟪⬛━━━━━
❇️ Follow notification about periodical View
💥 Do Comment for Stock WEEKLY Level Analysis.🚀
📊 Do you agree with this view?
✈️ HIT THE PLANE ICON if this technical observation resonates with you. It will Motivate me.
━━━━━🟥🟧🟨🟩🟦🟪⬛━━━━━
💡 If You LOOKING any CHART & want for Level and ANALYZE?
Share your desired stock names in the comments below! I will try to analyze the chart Levels, patterns and share my technical view (so far my Knowledge).
If Viewers think It can identify meaningful setups. Looking forward to hearing from all of you — let's keep this discussion going and help each other make better trading decisions.
___________🔕^^^⚫⚪^🙏🏼🙏🏼🙏🏼^⚪⚫^^^🔔___________
Finnifty Intraday Analysis for 22nd July 2026NSE:CNXFINANCE
Highest Call OI in the Index is at 27500 strike, If Index sustain above 26500, rapid uptrend expected. If Index could not sustain above 26500 level then Index is expected to go down.
The upward movement may lead the Index to 26800 - 26850 resistance range and if the index crosses and sustains above this level then may reach near 27100 - 27150 range.
On the contrary, The downward moment may drag the to 26250 – 26200 support range and if this support too is broken then index may tank near 25950 – 25900 range.
Banknifty Intraday Analysis for 21st July 2026NSE:BANKNIFTY
Index is the range between 57300 - 58600 range and range bound moment is expected as long as the index will be in this range.
The upward moment may lead the Index to 58600 – 58700 resistance range in upward momentum and if the index crosses and sustains above this level then may reach near 59300 – 59400 range.
On the contrary, The downward moment may drag the Index to 57300 – 57200 support range in downward momentum and if this support is broken then the index may tank near the 56500 – 56400 range.
Midnifty Intraday Analysis for 21st July 2026NSE:NIFTY_MID_SELECT
Index is near resistance and if the index sustain above 14850 then -
The upward movement may lead the Index near 14950 – 14975 resistance range and if the index crosses and sustains above this level then may reach 15125 – 15150 range.
On the contrary, The downward moment may drag the index to 14625 – 14600 support range and if this support is broken then index may tank near 14450 – 14425 range.
Nifty Intraday Analysis for 23rd July 2026NSE:NIFTY
Highest Call Put OI is made at 24000 Strike which will play the crucial level until expiry. If Index sustains above 24050 then uptrend expected else downward move is inevitable.
The upward movement may lead to 24200 – 24250 resistance range and if the index crosses and sustains above this level then may reach near 24450 – 24500 range.
On the contrary, The downward moment may drag the Index to 23800 – 23750 support range in downward momentum and if this support is broken then index may tank near 23550 – 23500 range.
Banknifty Intraday Analysis for 23rd July 2026NSE:BANKNIFTY
Index is in downward momentum and uptrend expected if Index sustains above 57500 level.
The upward moment may lead the Index to 57800 – 57900 resistance range in upward momentum and if the index crosses and sustains above this level then may reach near 58500 – 58600 range.
On the contrary, The downward moment may drag the Index to 56500 – 56400 support range in downward momentum and if this support is broken then the index may tank near the 55700 – 55600 range.
Finnifty Intraday Analysis for 23rd July 2026NSE:CNXFINANCE
Index is in downward momentum and uptrend expected if Index sustains above 26300 level.
The upward movement may lead the Index to 26550 - 26600 resistance range and if the index crosses and sustains above this level then may reach near 26850 - 26900 range.
On the contrary, The downward moment may drag the to 25950 – 25900 support range and if this support too is broken then index may tank near 25650 – 25600 range.
Midnifty Intraday Analysis for 23rd July 2026NSE:NIFTY_MID_SELECT
Index is near 14700 resistance level as long as Index is below this level downward trend is inevitable.
The upward movement may lead the Index near 14775 – 14800 resistance range and if the index crosses and sustains above this level then may reach 14950 – 14975 range.
On the contrary, The downward moment may drag the index to 14475 – 14450 support range and if this support is broken then index may tank near 14300 – 14275 range.
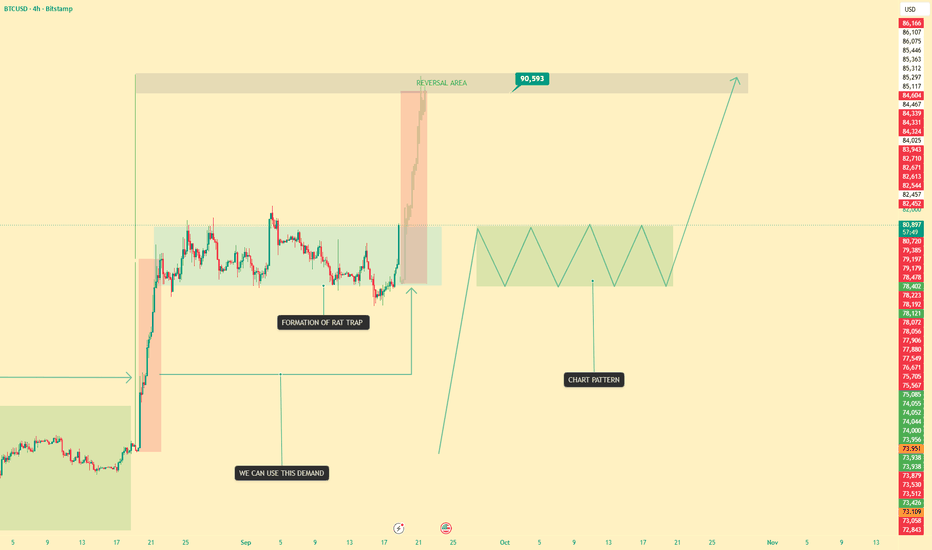
Bitcoin AnalysisIf the price breaks below 58,000–57,700, it could trigger a significant bearish move toward the 50,000–40,000 zone.
A decisive breakdown below 40,000 may open the path to the 20,000–15,000 range.
Until those key support levels are breached, the overall trend remains strong, with the potential to advance toward the 65,000–75,000 target in the near future.
Smart Money and Retail Traders Create Market TrendsHave you ever wondered why a market suddenly starts trending?
One day, price is moving sideways.
Then, without warning, it breaks out and begins a powerful move.
Retail traders often enter after the move becomes obvious. By that time, large market participants may already have been building positions.
This creates an interesting relationship between two major groups in financial markets:
Smart money and retail traders.
They don't always trade in the same way, and they don't always enter at the same time.
Understanding how their behavior interacts can help explain why markets trend, consolidate, reverse, and sometimes move in unexpected directions.
Who Are Smart Money and Retail Traders?
The term "smart money" is commonly used to describe large and experienced market participants.
This can include:
Banks
Hedge funds
Asset managers
Institutions
Professional trading firms
Retail traders are individual market participants trading with comparatively smaller positions.
The difference is not simply about who is smarter.
It is mostly about size, information, experience, and execution.
Large institutions often have the resources to analyze markets in greater depth and manage positions that are far too large for a typical retail trader.
But even institutions cannot predict the future with certainty.
They are still participants in the same market.
How Large Players Build Positions
Imagine an institution wants to buy a very large amount of an asset.
If it buys everything at once, price may move sharply higher, making the remaining purchases more expensive.
Instead, large participants may build positions gradually.
This can happen while price is moving sideways or during periods of uncertainty.
To the average trader, the market may look boring.
But beneath the surface, significant buying or selling may be taking place.
Eventually, when the balance between supply and demand shifts strongly enough, price begins to move.
This is where a trend can start.
Retail Traders Often Join Later
Retail traders frequently enter after a trend becomes visible.
A breakout occurs.
The chart looks bullish.
News becomes positive.
Social media starts discussing the move.
More traders notice the opportunity and begin buying.
Their participation adds further demand.
This can help accelerate the existing trend.
The same thing happens in reverse during downtrends.
As price falls, fear spreads.
Retail traders begin selling.
Stop losses are triggered.
Leverage positions may be liquidated.
The additional selling pressure can push price even lower.
In this way, retail participation can sometimes amplify a trend that has already begun.
The Psychology of the Crowd
Markets are heavily influenced by human emotion.
When prices rise, people become optimistic.
When prices continue rising, confidence turns into excitement.
Eventually, excitement can become greed.
The opposite happens during declines.
Uncertainty becomes fear.
Fear turns into panic.
These emotional cycles create predictable behavior among large groups of traders.
Smart money is not necessarily trying to "trick" retail traders.
However, large participants understand that markets are driven by liquidity and human behavior.
They know where traders are likely to place orders.
They know that obvious highs, lows, support levels, and resistance zones often attract significant activity.
Understanding this behavior can influence how large positions are executed.
Why Liquidity Matters
Liquidity is one of the most important pieces of the puzzle.
Large traders need other participants to take the opposite side of their transactions.
For example, an institution looking to sell a large position needs enough buyers willing to purchase from them.
This is one reason price often moves toward areas where many orders are concentrated.
These areas may include:
Previous highs
Previous lows
Equal highs and lows
Major support and resistance
Breakout levels
Psychological price levels
When price reaches these areas, trading activity can increase significantly.
Sometimes the resulting movement creates a breakout.
Other times, price briefly moves beyond the level before reversing.
This is why understanding liquidity can provide useful context when analyzing market behavior.
How Trends Become Self-Reinforcing
A trend often begins with a relatively small shift in supply and demand.
As price moves, more traders notice.
New participants enter.
Momentum traders join.
Breakout traders react.
The media begins covering the move.
Retail traders become increasingly interested.
Each new participant can add more buying or selling pressure.
The trend becomes self-reinforcing.
This is one reason markets can move much further than many traders initially expect.
The trend is no longer being driven by the original participants alone.
It is now being supported by an expanding crowd.
When the Crowd Becomes Too Confident
Trends eventually reach a point where optimism or pessimism becomes extreme.
At the top of a strong rally, almost everyone may already be bullish.
New buyers continue entering because they fear missing out.
But if most potential buyers have already entered, there may be less new demand available to push prices higher.
At the same time, experienced participants may begin taking profits.
The market becomes vulnerable to a change in sentiment.
The same principle applies during major sell-offs.
When fear reaches an extreme, sellers may become exhausted.
This is often where market cycles begin to change.
Smart Money vs. Retail Money Is Not Always a Battle
It's tempting to think of the market as a simple battle between institutions and retail traders.
Reality is much more complicated.
Institutions can also be wrong.
Retail traders can also identify trends early.
Sometimes both groups are buying.
Sometimes both are selling.
And sometimes different institutions have completely different opinions about the same asset.
The market is not a game where one group always wins.
It is a continuous auction involving millions of participants with different goals, time horizons, and strategies.
What Retail Traders Can Learn
Retail traders cannot compete with institutions on size.
They don't need to.
Their biggest advantage is flexibility.
A retail trader can enter or exit a position quickly.
They can focus on smaller opportunities.
They can remain patient and wait for the right setup.
Instead of trying to predict what large institutions are doing, traders can focus on observing what price is actually showing.
Look for changes in:
Market structure
Volume
Liquidity
Price action
Support and resistance
Trend strength
The goal is not to follow "smart money" blindly.
The goal is to understand the behavior of the market and react accordingly.
Final words
Market trends are not created by one group alone.
Large institutions may provide significant buying or selling pressure.
Retail traders can add momentum and amplify emotional moves.
News and sentiment can attract even more participants.
Together, these forces create the trends we see on our charts.
The most useful lesson is not to think of smart money and retail traders as two opposing teams.
Instead, think of the market as a constantly changing ecosystem of participants.
Some enter early.
Some enter late.
Some provide liquidity.
Some chase momentum.
Some take profits.
And some panic at exactly the wrong time.
When you begin to understand how these different participants interact, price movements start to make more sense.
Because behind every trend is a story.
A story of positioning, liquidity, psychology, and changing expectations.
And the chart is where that story is ultimately revealed.
L&T FINANCE LTD. | Resistance Breakout Retest | Bullish Continua📈 L&T FINANCE LTD. | Resistance Breakout Retest | Bullish Continuation Setup
L&T Finance has successfully broken above a major resistance zone and is now retesting the breakout level, a classic price action behavior that often strengthens the probability of trend continuation.
After a strong impulsive rally, the stock has pulled back toward the previous resistance, which is now acting as potential support. If buyers defend this zone, the next bullish leg could begin with increasing momentum.
🔍 Technical Highlights:
• Major Resistance Breakout
• Successful Breakout Retest in Progress
• Previous Resistance Turning Into Support
• Strong Bullish Market Structure
• Healthy Pullback After Impulsive Move
• Trend Continuation Setup
🎯 Upper Side Possible Targets:
✅ Target 1: ₹337
✅ Target 2: ₹400
As long as the price holds above the breakout zone around ₹300, the overall bullish structure remains intact. A strong bullish confirmation candle from this support area could provide a high-probability buying opportunity with a favorable risk-reward ratio.
📊 Market Psychology:
The breakout attracted momentum buyers, while the current pullback appears to be profit booking rather than trend weakness. If demand returns near the breakout level, buyers could regain control and push the stock toward the projected upside targets.
💬 Do you think L&T Finance will bounce from this breakout retest and continue its rally toward ₹337 and ₹400? Share your technical view below.
⚠️ Disclaimer:
This analysis is for educational purposes only and should not be considered financial advice. Always perform your own research and follow proper risk management before taking any trade.