VIDHIING — Accumulation Breakout & Demand Zone RetestNSE:VIDHIING
Technical Thesis & Setup Strategy
Vidhi Specialty Food Ingredients Ltd (VIDHIING) has completed a multi-month accumulation structure after undergoing a ~55% correction from its peak. The stock recently witnessed a high-volume absorption phase off the ₹258.60 base, confirming strong institutional demand (Smart Money Accumulation).
Following a Volatility Contraction Pattern (VCP) with diminishing selling volume across May–July, the price expanded aggressively to test the ₹349 li
Supply and Demand
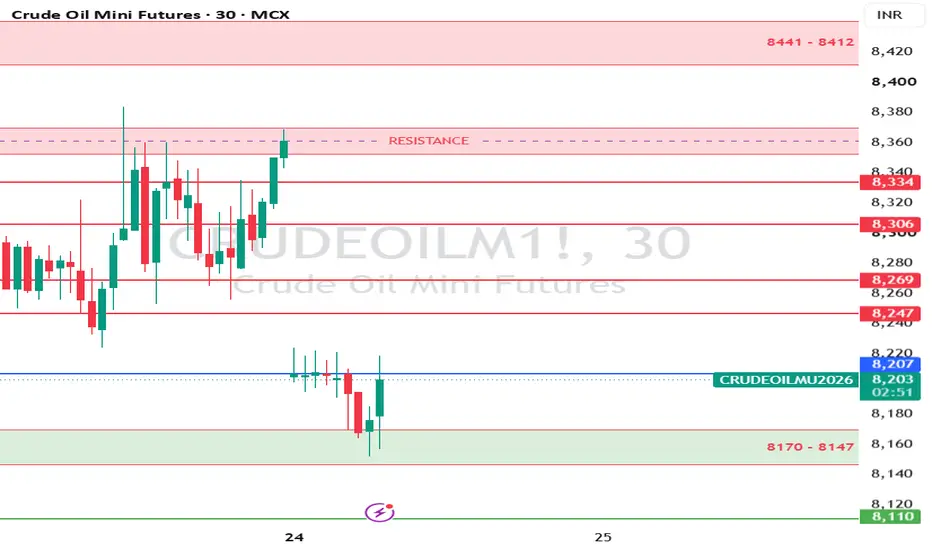
Crude Oil Intraday Setup: Eyeing 8,207 Breakout for Next Leg UpMCX Crude Oil (Mini) is currently trading around 8,188, experiencing a brief pullback after testing lower levels down to 8,157. A sustained breakout above 8,207 confirms bullish momentum on the intraday chart.
Key Technical Levels
Breakout Trigger: 8,207 (Immediate level to confirm upside extension)
Immediate Support Zone: 8,170 – 8,147
Major Base Support: 8,110
Bullish Upside Targets & Resistance Levels
If price holds above 8,207, expect sequential moves toward the following overhead re
THOMASCOOK 1D: Key Supply & Demand Zones Signal Swing Thomas Cook (India) Limited ( NSE:THOMASCOOK ) on the daily timeframe is currently trading near 113.17 following a strong +11.41% single-day expansion. Price has broken out of a tight triangular consolidation off its base and is testing an immediate overhead supply/resistance zone.
Immediate Supply Zone (115.00 – 118.00): Primary overhead resistance. The recent rejection high near 115.70 sits directly within this zone, marking the key intraday hurdle for momentum buyers.
Immediate Support
SHANTIGEAR 1H: Massive Vertical Expansion & Resistance Levels SeShanthi Gears Limited ( NSE:SHANTIGEAR ) on the 1-hour timeframe is currently trading at 464.25 (+19.99%), surging sharply out of a multi-week consolidation base near 390.00 – 400.00. The stock has locked into an upper circuit zone with heavy momentum.
Immediate Demand / Value Zone (460.60 – 464.25): Current consolidation zone holding the breakout momentum.
Primary Demand Base (390.00 – 400.00): Major structural demand zone from where the vertical rally originated.
Stop-Loss / Invalidation Le
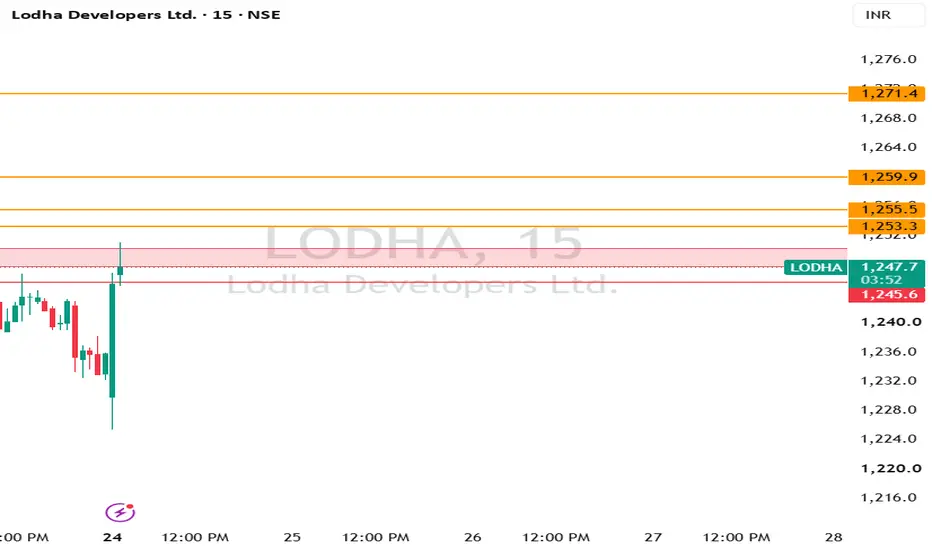
LODHA 15M: Key Support Retest Holds Before Bullish Continuation Lodha Developers Ltd. (LODHA) on the 15-minute timeframe is currently trading near 1,249.0 following a bullish bounce off local support. The broader structure remains bullish, with price coiling near the lower demand region, positioning for a potential continuation toward immediate overhead targets.
Immediate Supply Zone (1,253.3 – 1,255.5): Primary intraday resistance band. A decisive 15m candle close above 1,253.3 will serve as the immediate trigger confirming momentum expansion toward higher
NIFTY 30M: Trendline Breakout After 3-Day Consolidation Signals Nifty 50 on the 30-minute timeframe is trading near 24,308 following a clean trendline breakout after a 3-day tight consolidation phase. The broader structure has shifted firmly bullish, but price action offers a potential dip-buying opportunity on a retest of the broken trendline before expanding higher toward overhead resistance levels.
Immediate Supply Zone (24,330 – 24,350): Primary intraday resistance band. A sustained 15m/30m candle close above 24,333 confirms direct momentum expansio
NIFTY might remain between this zone for now!As we can see NIFTY is managing to hold itself above the important demand zone, we can expect NIFTY to remain bullish but we cannot ignore that there is a strong supply zone too which would not let NIFTY to show unidirectional upmove. So, we can expect NIFTY to remain sideways between this zone. So plan your trades accordingly and keep watching everyone.
Bank of Baroda (BANKBARODA) Chart AnalysisTechnical Outlook
Bank of Baroda is currently consolidating near the *240-251 zone* after a significant correction from the 320+ area. The recent price action shows repeated attempts to hold the lower support region while buyers continue to defend the 240-241 area at the same time, the stock has struggled to sustain moves above 251-252, creating a well-defined short-term range.
The chart also highlights an Expanding Ascending Triangle structure. In simple terms, price is making progressively
BTCUSD: Bullish Continuation SetupBTCUSD is showing a potentially strong bullish structure on the 4H timeframe. The market first went through a prolonged consolidation phase, where price remained within a defined range and accumulated liquidity. Following this consolidation, we can see a clear Supply-Demand Interchange, where the previous supply area is being challenged and potentially transitioning into a demand/support zone.
The strong impulsive move out of the consolidation further supports the idea that buyers have gained c
NZDUSD 15M: Key Supply & Demand Zones & ProjectedNZDUSD 15M: Key Supply & Demand Zones & Projected Head-and-Shoulders Setup
NZDUSD on the 15-minute timeframe is currently trading near 0.59562 after making a sharp local peak at the 0.59650 supply level. Price action shows a potential Head-and-Shoulders formation developing within the current consolidation structure.
Primary Supply Zone (0.59635 – 0.59650): Marked overhead resistance (red band). The recent sharp rejection at 0.59638 forms the "Head" of the pattern.
Immediate Demand Band (0.5
XAUUSD 15M: Key Supply & Demand Zones Signal Next DirectionalXAUUSD 15M: Key Supply & Demand Zones Signal Next Directional Move
Gold (XAUUSD) on the 15-minute chart is currently consolidating around the 4,494 level following a strong bullish expansion from the lower 4,400 region. Price recently encountered heavy selling pressure at the primary supply zone (4,514 – 4,522), triggering a pullback into the immediate support area.
Supply Zone (4,514 – 4,522): Key overhead resistance. A clean 15m candle close above 4,522 is required to confirm bullish cont
Nifty Intraday Analysis for 21st August 2026NSE:NIFTY
Index has support at 24000 and resistance at 24500 level and range bound moment is expected as long as the either side level is not broken.
The upward movement may lead to 24450 – 24500 resistance range and if the index crosses and sustains above this level then may reach near 24700 – 24750 range.
On the contrary, The downward moment may drag the Index to 24000 – 23950 support range in downward momentum and if this support is broken then index may tank near 23750 – 23700 ra
Banknifty Intraday Analysis for 21st August 2026NSE:BANKNIFTY
Index has support at 57000 and resistance at 58000 level and range bound moment is expected as long as the resistance is not broken.
The upward moment may lead the Index to 58200 – 58300 resistance range in upward momentum and if the index crosses and sustains above this level then may reach near 58900 – 59000 range.
On the contrary, The downward moment may drag the Index to 56800 – 56700 support range in downward momentum and if this support is broken then the index may tan
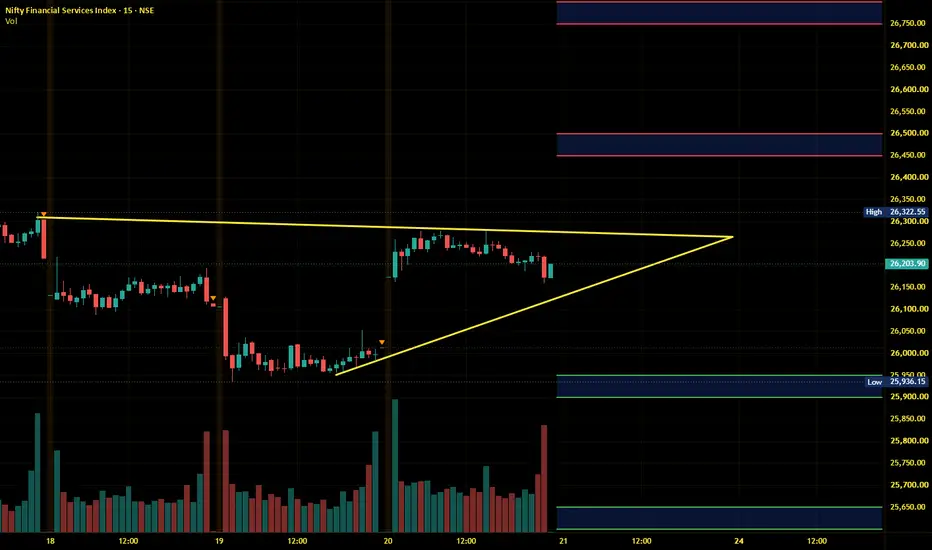
Finnifty Intraday Analysis for 21st August 2026NSE:CNXFINANCE
Index is in the 26200 - 26400 range and uptrend is expected when the Index breaks and sustains above this range.
The upward movement may lead the Index to 26450 - 26500 resistance range and if the index crosses and sustains above this level then may reach near 26750 - 26800 range.
On the contrary, The downward moment may drag the to 25950 – 25900 support range and if this support too is broken then index may tank near 25650 – 25600 range.
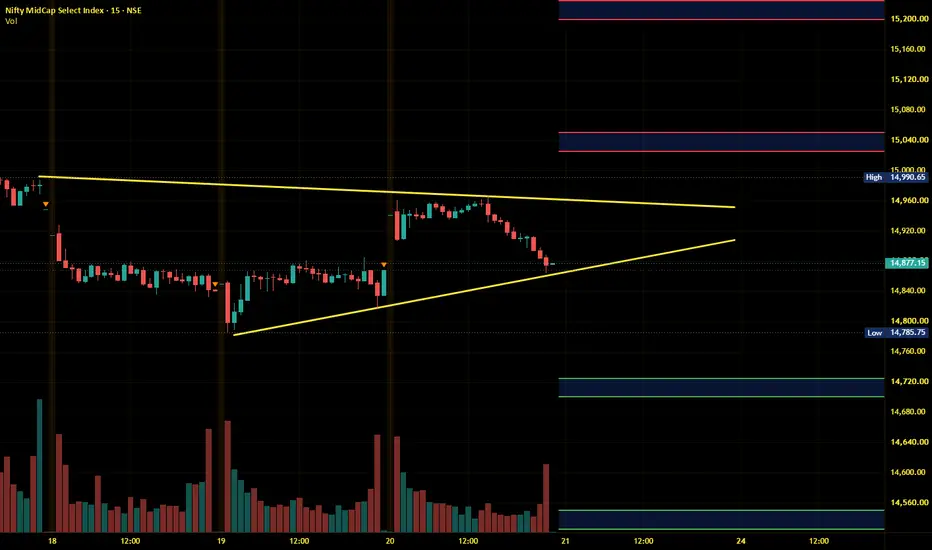
Midnifty Intraday Analysis for 21st August 2026NSE:NIFTY_MID_SELECT
The index is in the range of 14800 - 15000 and reversal is expected from either level as long as the range is not broken.
The upward movement may lead the Index near 15025 – 15050 resistance range and if the index crosses and sustains above this level then may reach 15200 – 15225 range.
On the contrary, The downward moment may drag the index to 14725 – 14675 support range and if this support is broken then index may tank near 14550 – 14525 range.
NZDCAD at Major Support - Will Buyers Push Toward 0,8100?NZDCAD has declined into an area that buyers have successfully defended several times before. Previous tests of this level produced strong rebounds, so it is not a zone to overlook.
Selling pressure is still present, but price is now trading near the bottom of its recent range. If sellers cannot break and hold below this support, the downside move may lose momentum quickly.
The idea is not to buy blindly at support. Better confirmation would be price holding above the zone and showing a clear bu
Nifty 50 Market outlook for Friday, 21 August 📊 NIFTY50 1H – CHART ANALYSIS
CMP: 24,232
🔻 Bias: Bearish
🔴 Resistance: 24,350–24,400
🟢 Support: 24,020–24,060
🎯 Major Support: 23,600–23,650
Price is consolidating near support after a sharp fall. A pullback toward 24,350–24,400 is possible, but rejection there can resume the downside.
Below 24,020 → 23,650
Above 24,400 → bearish view weakens.
XAUUSD Technical Analysis 20 AUGUST 2026The chart shows XAUUSD trading around $4,492.12, testing a major structural junction. The broader bias favors upside continuation due to two overlapping bullish patterns, but an immediate short-term pull or rejection is likely before the primary long expansion occurs.
Pattern & Structure OverviewHead & Shoulders (Inverse H&S): The chart shows a multi-session Inverse Head & Shoulders structure. The Left Shoulder rests around 4480.00, the Head swept bottom liquidity down to 4475.00, and the Ri
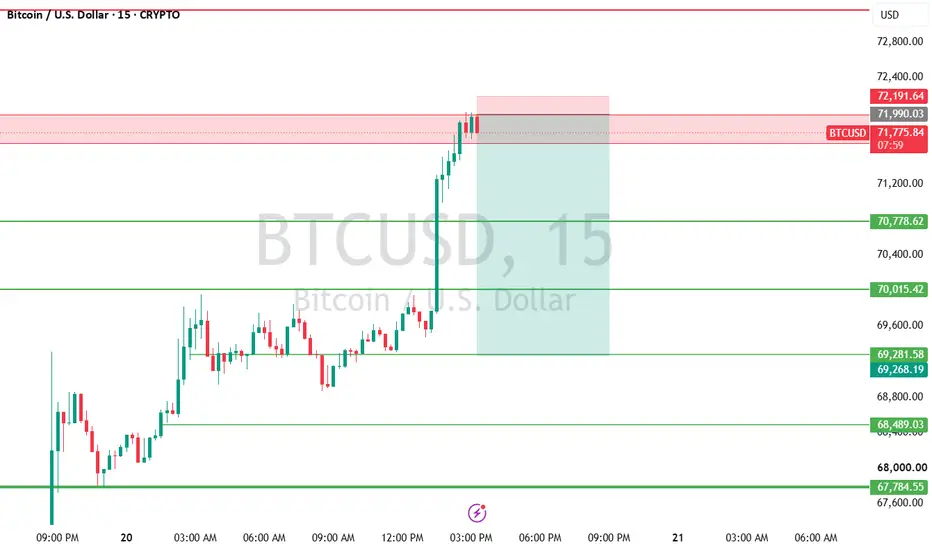
BTCUSD 15M: Key Supply & Demand Zones Signal Intraday Pullback BTCUSD 15M: Key Supply & Demand Zones Signal Intraday Pullback Setup
Bitcoin (BTCUSD) on the 15-minute timeframe is currently trading near 71,831 after sweeping recent monthly highs near 72,191. With price extended into a key overhead supply zone, a short-term intraday pullback setup is developing toward lower support bands.
Supply Zone (71,990 – 72,191): Primary overhead resistance. The recent rejection at 72,191.64 marks the local high, serving as the invalidation level for short intraday
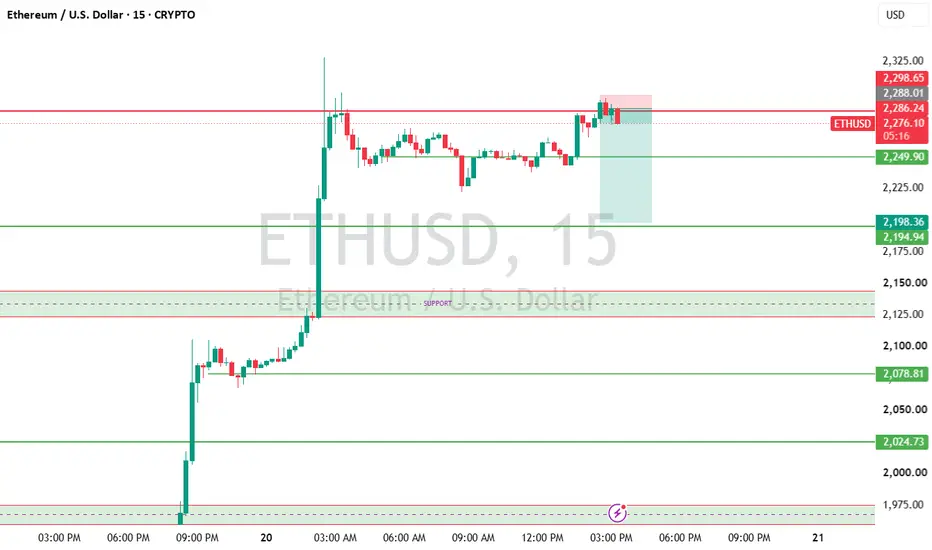
ETHUSD 15M: Key Supply & Demand Zones Signal Intraday Pullback ETHUSD 15M: Key Supply & Demand Zones Signal Intraday Pullback Setup
Ethereum (ETHUSD) on the 15-minute timeframe is currently trading near 2,278.41 after pushing into an overhead supply zone following a recent rally. With price reaching multi-week local high territory, a short-term intraday pullback setup is developing toward lower support levels.
Primary Supply Zone (2,286 – 2,296): Immediate overhead resistance (red band). The recent local high around 2,288.64 marks the upper boundary and
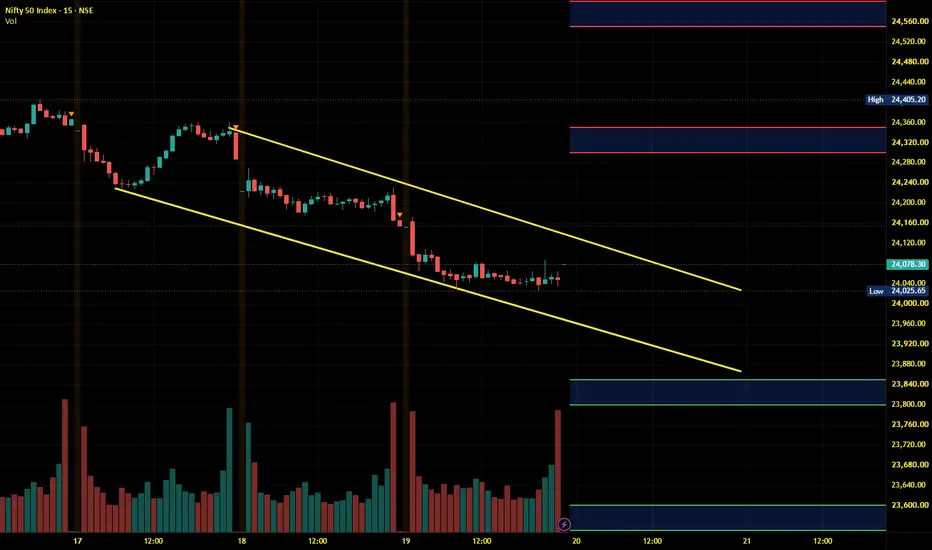
Nifty Intraday Analysis for 20th August 2026NSE:NIFTY
Index has support at 24000 and reversal from this level is expected as long as the support level is not broken.
The upward movement may lead to 24300 – 24350 resistance range and if the index crosses and sustains above this level then may reach near 24550 – 24600 range.
On the contrary, The downward moment may drag the Index to 23850 – 23800 support range in downward momentum and if this support is broken then index may tank near 23600 – 23550 range.
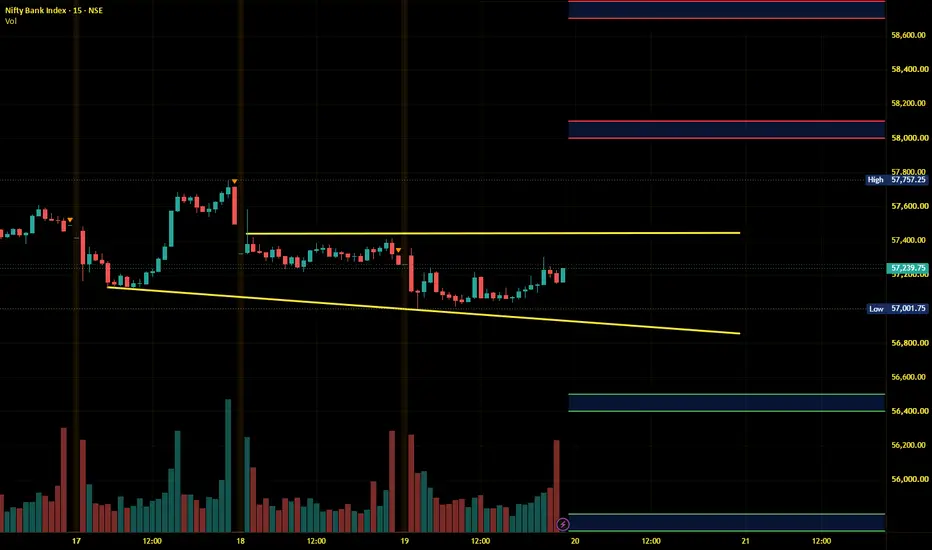
Banknifty Intraday Analysis for 20th August 2026NSE:BANKNIFTY
Index has support at 57000 and reversal from this level is expected as long as the support level is not broken.
The upward moment may lead the Index to 58000 – 58100 resistance range in upward momentum and if the index crosses and sustains above this level then may reach near 58700 – 58800 range.
On the contrary, The downward moment may drag the Index to 56500 – 56400 support range in downward momentum and if this support is broken then the index may tank near the 55800 – 55
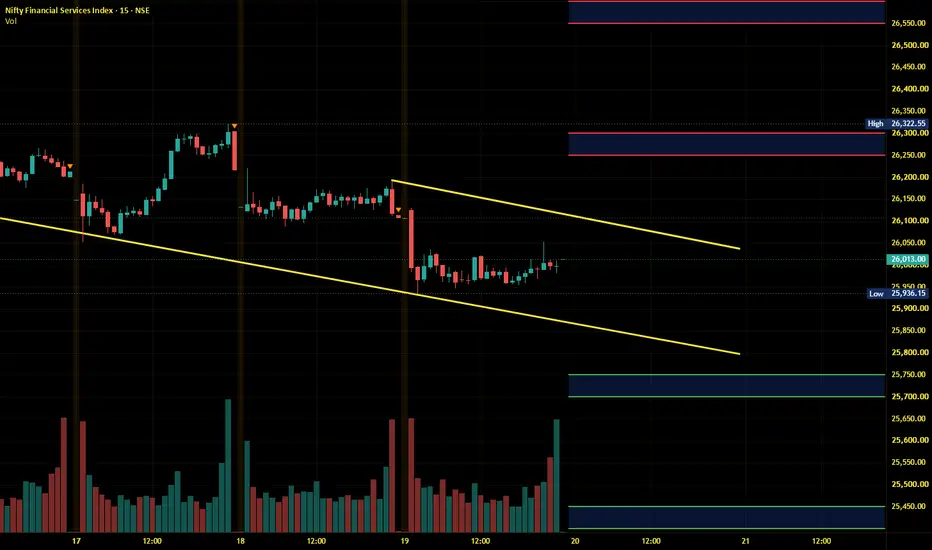
Finnifty Intraday Analysis for 209th August 2026NSE:CNXFINANCE
Index has support in the 26000 - 25950 range and reversal from this range is expected as long as the support range is not broken.
The upward movement may lead the Index to 26250 - 26300 resistance range and if the index crosses and sustains above this level then may reach near 26550 - 26600 range.
On the contrary, The downward moment may drag the to 25750 – 25700 support range and if this support too is broken then index may tank near 25450 – 25400 range.
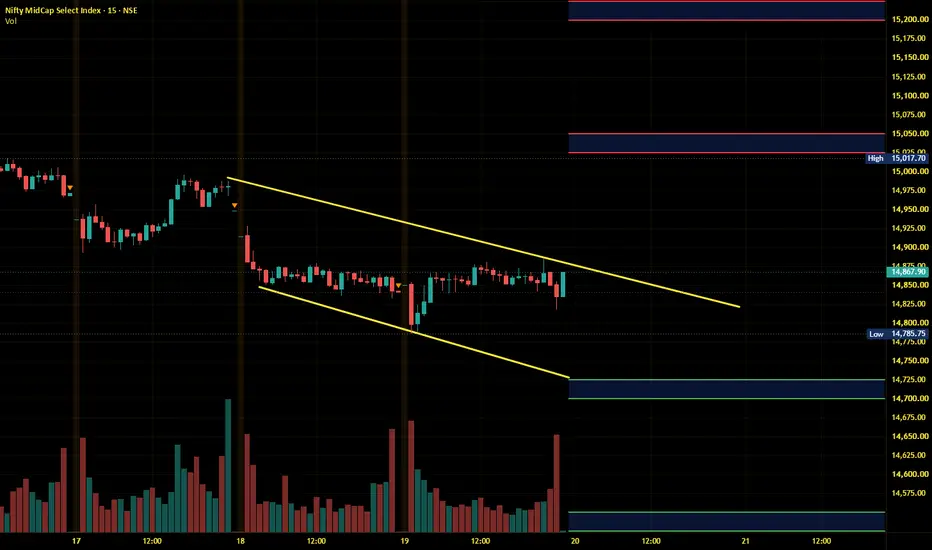
Midnifty Intraday Analysis for 20th August 2026NSE:NIFTY_MID_SELECT
The index is in the range of 14800 - 15000 and reversal is expected from either level as long as the range is not broken.
The upward movement may lead the Index near 15025 – 15050 resistance range and if the index crosses and sustains above this level then may reach 15200 – 15225 range.
On the contrary, The downward moment may drag the index to 14725 – 14675 support range and if this support is broken then index may tank near 14550 – 14525 range.