What is likely to happen when ATR levels & Swing levels matchStock in focus Voltas
Closing on 19-Aug was 1223
Swing support area 1190-1210
ATR on daily TF is 36
Entry / Exit Levels for 20-Aug
Method: Prev Close +/- ATR
1223 + 36 = 1259 (likely resistance area / sell area)
1223 - 36 = 1187 (this matches exactly with swing support area)
I shall look for buying Voltas near 1185
keeping SL at 1170 and tgt as 1218, 1222, 1232, 1242
Supply and Demand
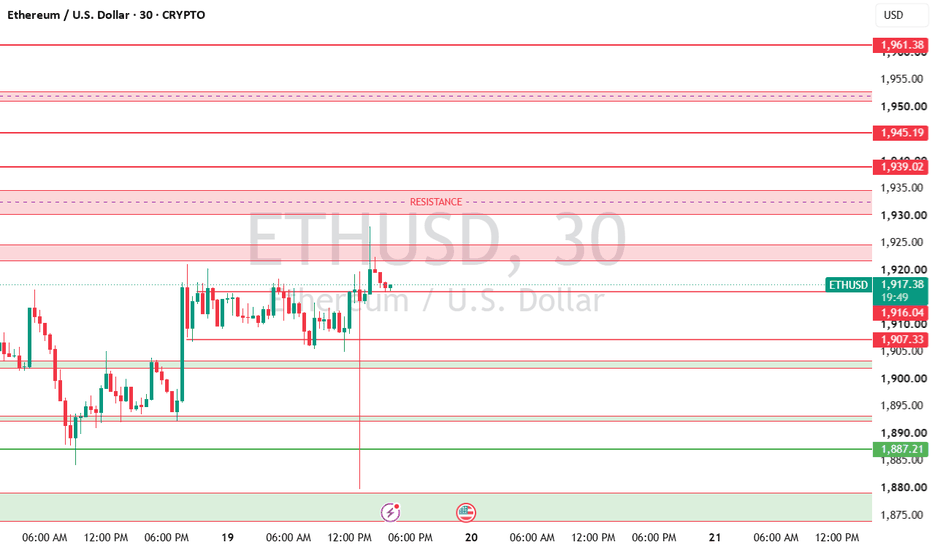
ETHUSD (30M) Long Setup: Rebullish Rebound Above 1,907 SupportETHUSD (30M) Long Setup: Rebullish Rebound Above 1,907 Support
The 30-minute ETHUSD chart is showing a favorable setup for long positions as price consolidates inside a key demand structure following a strong expansion higher. After breaking through local resistance and sweeping liquidity around 1,922, the price pulled back into a established support block between 1,907.33 – 1,916.04. The recent price action indicates buyers are defending the lower boundary of this range, forming higher lows an
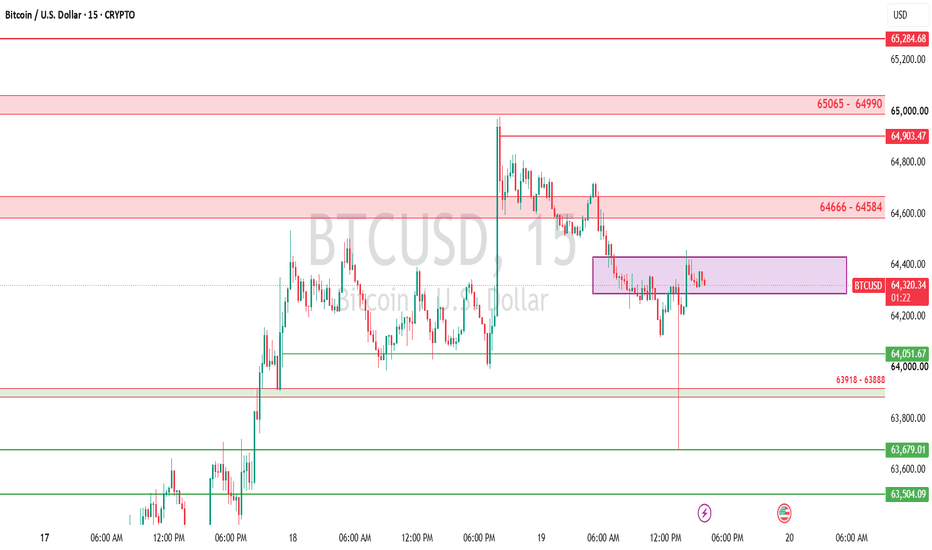
BTCUSD (15M) Short-to-Long Continuation Setup: Initial LiquidityBTCUSD (15M) Short-to-Long Continuation Setup: Initial Liquidity Sweep to Bullish Reversal
Market Context
The 15-minute BTCUSD chart shows an initial period of downside momentum driven by aggressive selling pressure taking out local stops. However, after reaching lower demand, the price structure shifts into a strong bullish recovery, reversing early losses as aggressive buyers absorb overhead supply and push the market higher.
Technical Breakdown
Initial Sell-Off Phase: Price encounters
XAUUSD Intraday Outlook & Key Levels (August 19, 2026)Gold is currently consolidating within a key liquidity range on the 15-minute timeframe, hovering around 4360. Price action is caught between recent supply levels near 4375–4408 and strong lower demand zones around 4334–4321. Traders should keep an eye on upcoming FOMC meeting minutes for near-term fundamental volatility.Key Technical LevelsResistance 2 (Major Overhead): 4408.00 – 4400.00 (Key supply zone)Resistance 1 (Immediate Hurdle): 4375.34 (Local swing high / breakout level)Current Trading
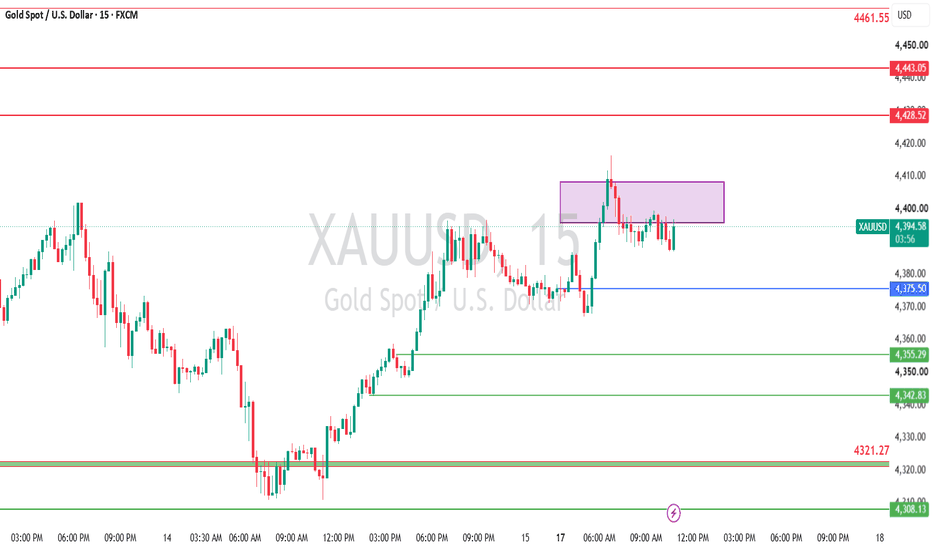
XAUUSD INTRADAY LEVELS ANALYSIS 17-04-2026Gold is currently trading around 4,394.95 USD (+0.17%), maintaining its bullish bias following a powerful upward move off the 4,320.00 base. After pushing past psychological resistance at 4,400.00 to hit a peak near 4,410.00, price action met sharp selling pressure, leaving a upper liquidity wick before pulling back into the current purple consolidation zone (4,395.00 – 4,405.00).
The recent 15-minute candles display tight-range body sizes with balanced wicks, signaling temporary equilibrium an
XAUUSD 15M Technical Analysis – Aug 18, 2026 | Day 02The chart shows Gold Spot / U.S. Dollar (XAUUSD) on a 15-minute timeframe, currently trading around $4,392.52. After reaching a recent peak near the $4,430 area near the D(R1) resistance level, price experienced a sharp sell-off down into a short-term consolidation zone near D(S2).
Immediate resistance above sits between $4,408.60 and $4,415.75, with major dynamic resistance further up along the red upper trendline near $4,439.39. Key support levels below are located around the $4,375.00–$4,377
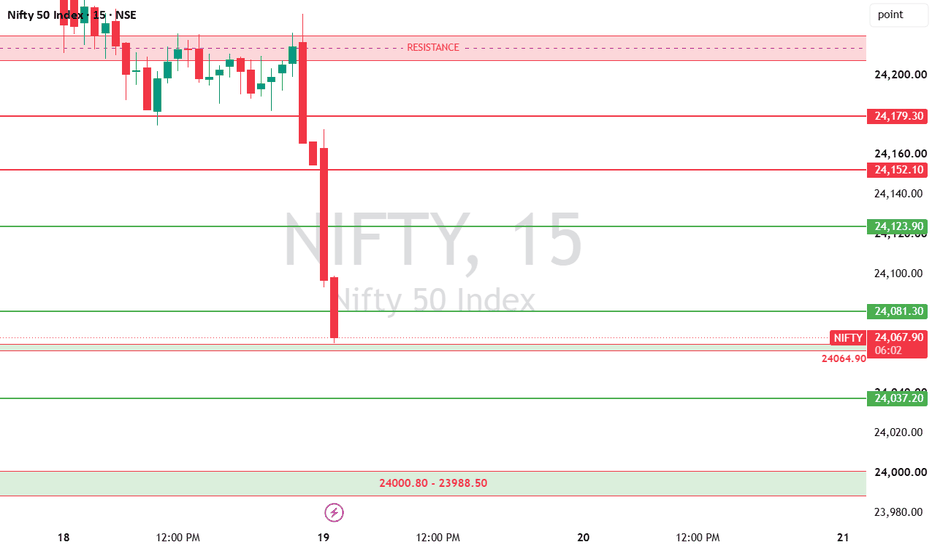
NIFTY 50 Intraday Outlook & Key Levels | August 19,2026Market Context & Price Action
NIFTY is currently displaying strong bearish momentum following a sharp rejection from the upper resistance zone near the 24,200 level. On the 15-minute timeframe, a significant sell-off candle broke down through intermediate support levels, taking price action below 24,123 and 24,081. The index is currently testing lower liquidity around the 24,071 mark as bears maintain control of the immediate market structure.
Key Trading Levels & Strategy
Immediate Resistan
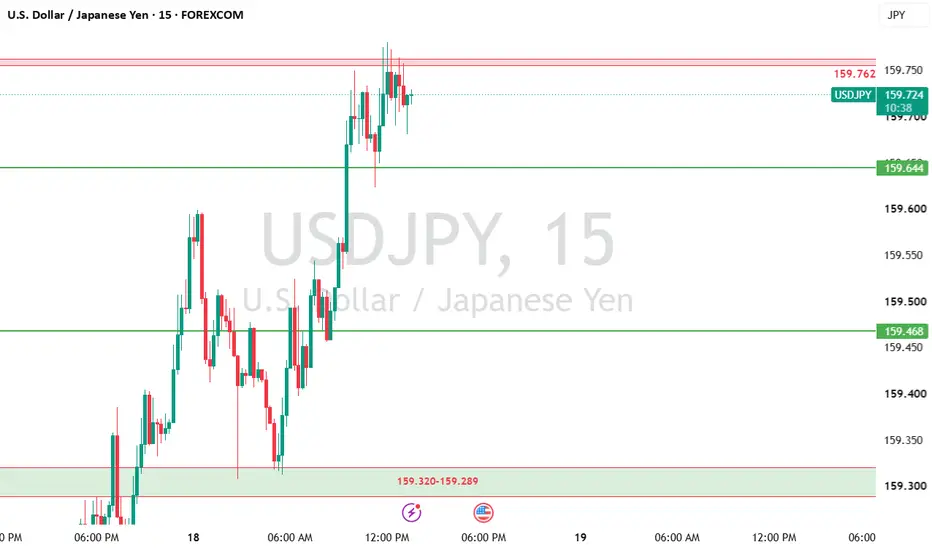
USD/JPY Intraday (18/08/2026) – Long Retest Setup Above 159.The USD/JPY 15-minute chart exhibits a strong bullish structure, highlighted by powerful impulsive expansion legs pushing higher out of lower base support around 159.320 – 159.289. Price recently experienced a sharp breakout higher, driving through intermediate resistance at 159.644 to test a local high near 159.762. Following this high, price is currently undergoing a slight healthy consolidation near 159.713, staying comfortably elevated above former breakout levels and indicating that buyers
EURUSD INTRADAY ANALYSIS 18/08/2026The EUR/USD 15-minute chart shows a recovery attempt following an initial downtrend, with price holding firmly above the key support zone around 1.15614 – 1.15700. After printing a local low near 1.1568, price action pushed back upward and is currently hovering around 1.15751. The clear breach above the minor intraday consolidation signals renewed buying interest, keeping price positioned for a potential continuation toward the intermediate resistance levels marked at 1.15872 and the higher supp
Nifty Intraday Analysis for 19th August 2026NSE:NIFTY
Index has broken 24250 and downward risk open. However, bounce from the support range is expected.
The upward movement may lead to 24350 – 24400 resistance range and if the index crosses and sustains above this level then may reach near 24600 – 24650 range.
On the contrary, The downward moment may drag the Index to 23950 – 23900 support range in downward momentum and if this support is broken then index may tank near 23700 – 23650 range.
Banknifty Intraday Analysis for 19th August 2026NSE:BANKNIFTY
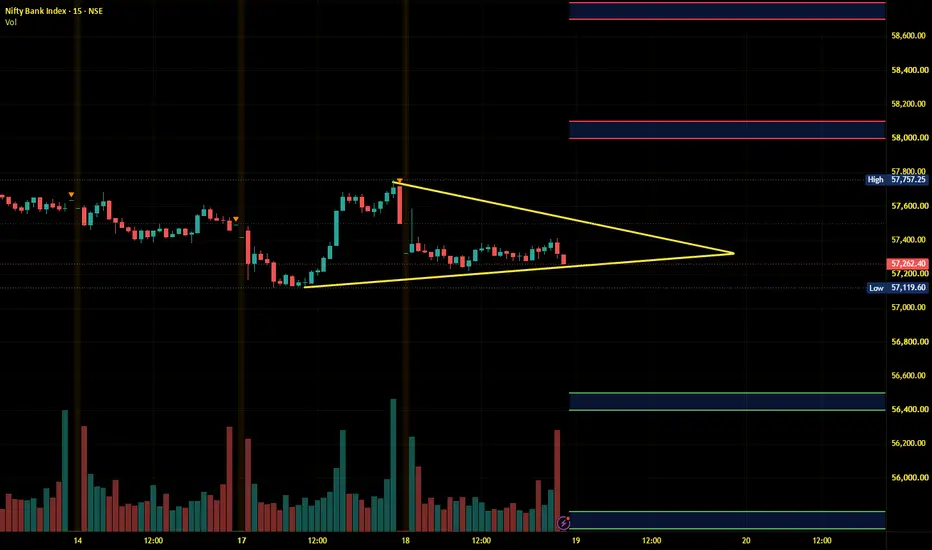
Index has strong resistance near 58000 and support near 57000 level and round bound moment expected as long as Index is in this range.
The upward moment may lead the Index to 58000 – 58100 resistance range in upward momentum and if the index crosses and sustains above this level then may reach near 58700 – 58800 range.
On the contrary, The downward moment may drag the Index to 56500 – 56400 support range in downward momentum and if this support is broken then the index may
Finnifty Intraday Analysis for 19th August 2026NSE:CNXFINANCE
The index is near 26000 support and range bound moment in 26000 - 26500 range expected and uptrend will be formed only when index breaks and sustains above 26500 resistance.
The upward movement may lead the Index to 26350 - 26400 resistance range and if the index crosses and sustains above this level then may reach near 26650 - 26700 range.
On the contrary, The downward moment may drag the to 25850 – 25800 support range and if this support too is broken then index may tank
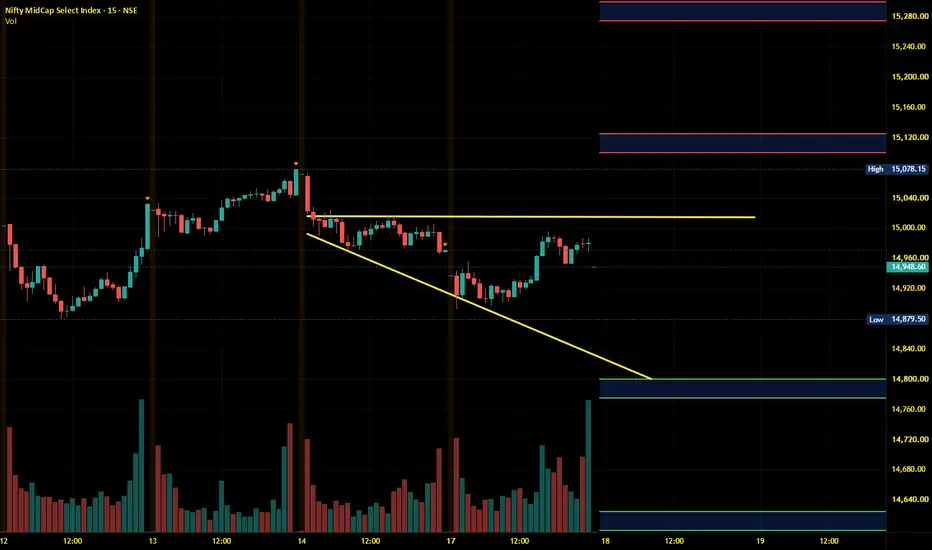
Midnifty Intraday Analysis for 19th August 2026NSE:NIFTY_MID_SELECT
The index has broken 14900 support which has opened downward risk as long as the Index is below the support.
The upward movement may lead the Index near 15000 – 15025 resistance range and if the index crosses and sustains above this level then may reach 15175 – 15200 range.
On the contrary, The downward moment may drag the index to 14700 – 14675 support range and if this support is broken then index may tank near 14525 – 14500 range.
XAUUSD Intraday Short Setup: Rejection Off Supply Zone, 19-08-26Looking at XAUUSD (15m), price action shows a clear intraday bearish bias following a sharp impulse drop from the upper supply region. We are currently observing a corrective pullback into key shorting levels.
🔑 Key Technical Zones
Supply Zone / Resistance (Sell Area): 4,367 - 4,372
Secondary Resistance: 4,382 and 4,405 - 4,407
Current Consolidation / Minor Pivot: Around 4,345
Demand Zone / Support (Target Area): 4,326
Extended Demand Target: 4,316 - 4,319
Major Key Support: 4
USDCAD SHOWING A GOOD UP MOVE WITH 1:8 RISK REWARDUSDCAD SHOWING A GOOD UP MOVE WITH 1:8 RISK REWARD
DUE TO THESE REASON
A. its following a rectangle pattern that stocked the market
which preventing the market to move any one direction now it trying to break the strong resistant lable
B. after the break of this rectangle it will boost the market potential for break
C. also its resisting from a strong neckline the neckline also got weeker ald the price is ready to break in the outer region
all of these reason are indicating the same thing its
Nifty Intraday Analysis for 18th August 2026NSE:NIFTY
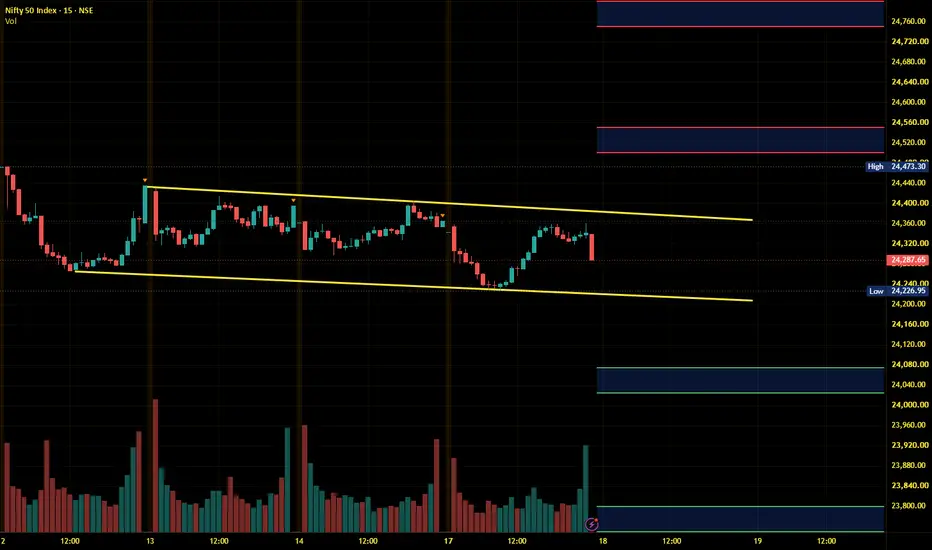
Index will be range bound as long as it is in the 24250 - 24500 range and trend will emerge on either side when index will break the range.
The upward movement may lead to 24500 – 24550 resistance range and if the index crosses and sustains above this level then may reach near 24750 – 24800 range.
On the contrary, The downward moment may drag the Index to 24075 – 24025 support range in downward momentum and if this support is broken then index may tank near 23800 – 23750 range
Banknifty Intraday Analysis for 18th August 2026NSE:BANKNIFTY
Index has strong resistance near 58000 - 58300 range and uptrend is expected only when the index breaks and sustains above this resistance range.
The upward moment may lead the Index to 58200 – 58300 resistance range in upward momentum and if the index crosses and sustains above this level then may reach near 58900 – 59000 range.
On the contrary, The downward moment may drag the Index to 56800 – 56700 support range in downward momentum and if this support is broken then the in
Finnifty Intraday Analysis for 18th August 2026NSE:CNXFINANCE
The index is near 26000 support and range bound moment in 26000 - 26500 range expected and uptrend will be formed only when index breaks and sustains above 26500 resistance.
The upward movement may lead the Index to 26475 - 26525 resistance range and if the index crosses and sustains above this level then may reach near 26800 - 26850 range.
On the contrary, The downward moment may drag the to 25950 – 25900 support range and if this support too is broken then index may tank
Midnifty Intraday Analysis for 18th August 2026NSE:NIFTY_MID_SELECT
Index has support near 14900 - 14875 range and uptrend is expected to continue as long as the index is above this support range.
The upward movement may lead the Index near 15100 – 15125 resistance range and if the index crosses and sustains above this level then may reach 15275 – 15300 range.
On the contrary, The downward moment may drag the index to 14800 – 14775 support range and if this support is broken then index may tank near 14625 – 14600 range.
BAJFINANCE: High-Probability SMC Retest at Demand ZoneNSE:BAJFINANCE
Market Structure & Setup Analysis:
Structure: Bajaj Finance has completed a clean structural breakout above multi-month All-Time High resistance (~₹1,100), sweeping Buy-Side Liquidity up to ₹1,176.4.
Smart Money Concept (SMC): Price is now conducting a controlled pullback into the daily Point of Interest (POI) / Demand Zone spanning ₹1,050 – ₹1,090, which aligns with the 20 EMA retest.
Volume & RSI Confluence: Volume has contracted sharply on the retracement (signalin
EUR/JPY 15M Intraday (18/08/2026) – Retest & Continuation to 185Date: August 18, 2026
The EUR/JPY 15-minute chart displays a decisive bullish market structure, characterized by higher highs and higher lows following a breakout from prior consolidation. Price action reflects strong buying momentum after clearing the key intermediate level at 184.656, rallying upward to test a session high of 184.904 . Buyers remain firmly in control, driving price toward the primary overhead resistance targets marked at 185.056 and the higher supply zone spanning 185.1
NIFTY Outlook | 18 August 2026 | Expiry Day CautionMarket View
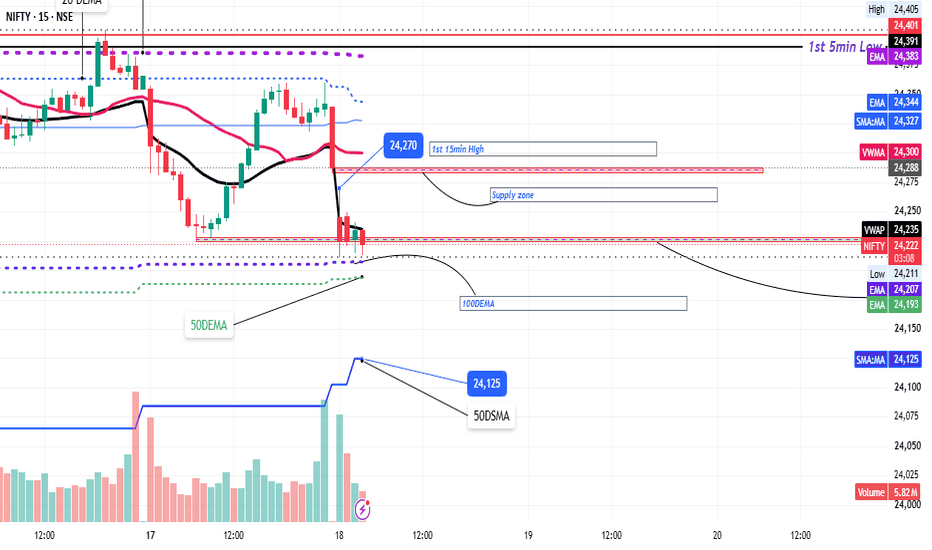
NIFTY is currently displaying negative price action, but the market has not yet confirmed a bearish breakdown.
Yesterday's support zone was retested, and despite the weakness, the index has not managed to close below this critical support area on the 15-minute timeframe. This suggests that selling pressure exists, but it has not yet been strong enough to trigger a confirmed downside move.
As today is weekly expiry, traders should expect increased volatility, false breakouts, and p
NIFTY 50 Index 15M Technical Analysis – Aug 18, 2026The chart shows the Nifty 50 Index on a 15-minute timeframe, currently trading around 24,225.75. Price has experienced a sharp downward move after failing to sustain higher levels, driving directly into your purple Point of Interest (POI) zone at 24,223–24,207. A clean break below this POI will confirm continuation for your short setup toward lower support targets.
Overhead resistance zones and lines (red) are stacked above at 24,274–24,254, 24,306.45, 24,329.00, 24,357–24,343, and 24,427–24,