Midnifty Intraday Analysis for 14th August 2026NSE:NIFTY_MID_SELECT
Index is at All Time High and upended is expected to continue as long as index is above 14900 level.
The upward movement may lead the Index near 15225 – 15250 resistance range and if the index crosses and sustains above this level then may reach 15400 – 15425 range.
On the contrary, The downward moment may drag the index to 14925 – 14900 support range and if this support is broken then index may tank near 14750 – 14725 range.
Supply and Demand
Fortis Healthcare – Short SetupType: Short Trade
Entry: ₹922.45
Stop Loss: ₹941.20
Target: ₹874.65
Risk–Reward: 1 : 2.5
Analysis:
Price is approaching a strong confluence zone aligning with VAH, Weekly SMA 50 & 21, and Daily SMA 21. The rejection from this area suggests potential downside continuation. Volume confirms selling pressure after a failed attempt to reclaim the moving averages.
Trade Plan:
Wait for price confirmation below ₹922.45 before entry.
Maintain SL at ₹941.20
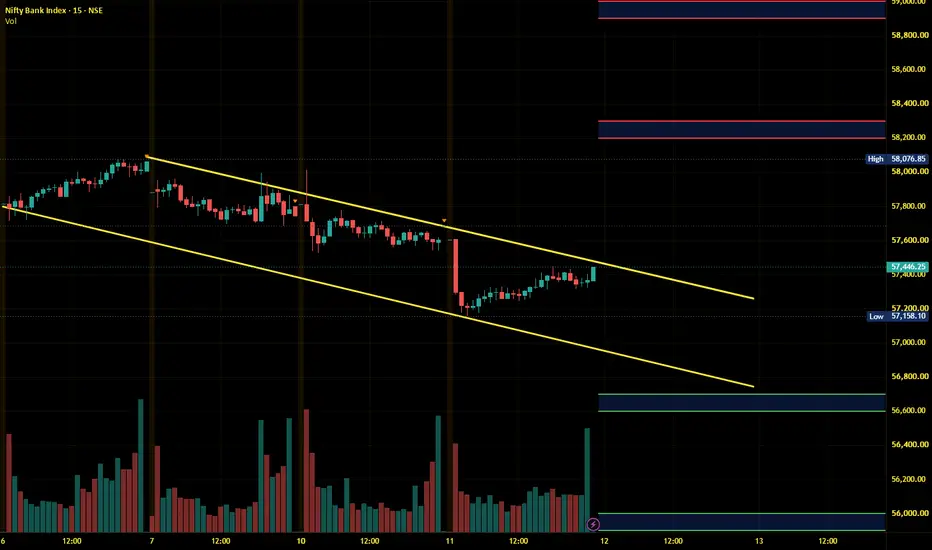
JUST MY VIEWRight now BankNifty is consolidating , most probably it will grab (RUN) LIQUIDITY on the downside and then continue to move till PDA i.e. ~ 56,300 . After that we can expect a big upside move . The move will be faster or not depends on the current move if the selling is sluggish the buying will be expeditious. That`s it from my side not any financial advice just for educational purpose, before investing do your own research first, thank you.
XAUUSD GOLD ANALYSIS ON (13 AUG 2026)#XAUUSD UPDATEDE
SELL LIMITED - 4400-4415
If price stay below 4450, then next target 4360,4320 and 4275 and above that 4500
Plan;If price break 4400-4415 area,and stay below 4400,we will place sell order in gold with target of 4360,4320 and 4275 & stop loss should be placed at 4450
Bullish Setup – SBI Cards & Payment Services LtdZone is currently aligning with the Daily SMA 21, Weekly SMA 21, and Weekly EMA 9.
Technical Highlights:
Price respecting the ascending channel structure.
EMA 9 crossing above SMA 21, signaling short-term bullish momentum.
Confluence zone offers a strong buy-on-dip opportunity.
Trade Idea:
Bias: Bullish continuation as long as price holds above ₹647.
A breakout above ₹667 could trigger momentum toward ₹680 and beyond.
Max Financial Services Ltd – Short SetupAnalysis Overview:
Price is currently respecting a bearish structure, forming lower highs and lower lows. The chart highlights a supply zone in confluence with VAH, DEMA 50, and Weekly EMA 8, creating a strong resistance cluster. This setup suggests a potential continuation of the downtrend from the recent swing high.
Key Technical Highlights:
Confluence Zone: ₹1,573–₹1,595 (VAH + DEMA 50 + Weekly EMA 8).
Trend: Price remains below all major moving averages, confirming bearish momentum.
Fi
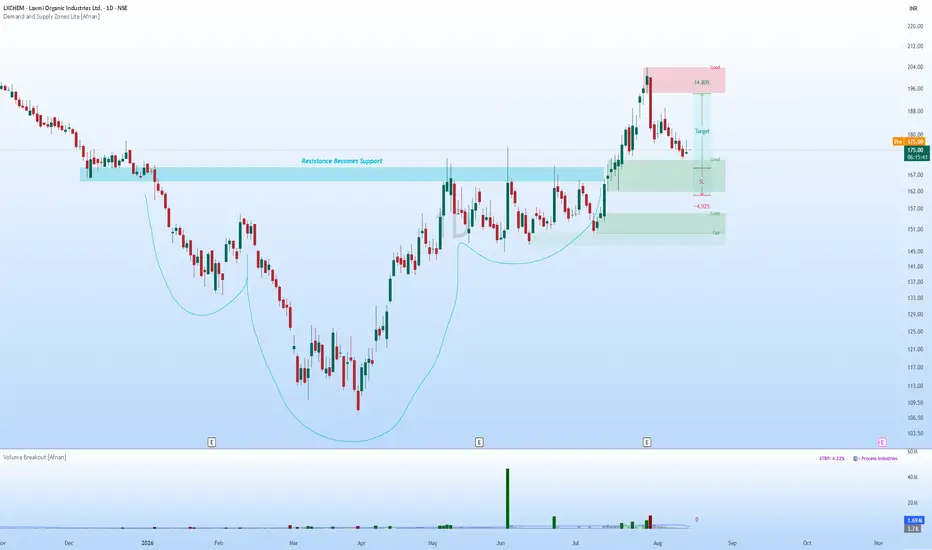
LAXMINDIA: Price Back at Demand — A Good Risk-Reward Setup?Laxmi Organic Industries is currently trading around ₹174 and has pulled back toward the Good Demand Zone . After the recent bullish move, this retest makes the zone important again.
🔥 Demand Zone in Focus 🔥
The Good Demand Zone is the main reason this area is important. It was formed before a strong bullish departure, showing that price moved away from the zone with considerable strength. That type of move suggests a meaningful demand–supply imbalance existed at the origin.
Now price has
We are still above the trendline! As we can see despite the weakness, NIFTY managed to close above the trendline. Showing strength. Hence we should stand by our analysis of buying the dip as long as trendline is respected. Hence as long as we are above the trendline, every dip can be bought. So plan your trades accordingly and keep watching everyone.
NIFTY DAILY / Short Range Level Analysis: 14th AUG 2026🔕 SGMN SplD BULLISH Above => 24436.
🔕 SGMN SplD Bearish BELOW => 24357.
Mentioned analysis based on 2 consecutive candle close in 15 min Time Frame.
━━━━━🟥🟧🟨🟩🟦🟪⬛━━━━━
💥Level Interpretation / description:
✍🏻L#1: If the candle crossed & stays above the “Buy Gen”, it is treated / considered as Bullish bias. Cfm=> Confirmation.
L#2: Possibility / Probability of REVERSAL near 🔕RL/TF1 & 🔔RL/TF2
L#3: If the candle stays above “Sell Gen” but below “Buy Gen”, it is treated / considered as Sid
Nifty Intraday Analysis for 13th August 2026NSE:NIFTY
Index has downside risk as long as it is below 24500 - 24600 range.
The upward movement may lead to 24700 – 24750 resistance range and if the index crosses and sustains above this level then may reach near 24950 – 25000 range.
On the contrary, The downward moment may drag the Index to 24225 – 24175 support range in downward momentum and if this support is broken then index may tank near 23950 – 23900 range.
Banknifty Intraday Analysis for 13th August 2026NSE:BANKNIFTY
The highest Call and Put OI is built up at 58000 strike which will act as resistance as long as it is not broken.
The upward moment may lead the Index to 58600 – 58700 resistance range in upward momentum and if the index crosses and sustains above this level then may reach near 59300 – 59400 range.
On the contrary, The downward moment may drag the Index to 57200 – 57100 support range in downward momentum and if this support is broken then the index may tank near the 56500 – 56
Finnifty Intraday Analysis for 13th August 2026NSE:CNXFINANCE
The index is near 26400 support and uptrend is expected.
The upward movement may lead the Index to 26700 - 26750 resistance range and if the index crosses and sustains above this level then may reach near 27000 - 27050 range.
On the contrary, The downward moment may drag the to 26150 – 26100 support range and if this support too is broken then index may tank near 25850 – 25800 range.
Midnifty Intraday Analysis for 13th August 2026NSE:NIFTY_MID_SELECT
Index is at All Time High and 15000 resistance is broken and upended is expected to continue as long as index is above 14800 level.
The upward movement may lead the Index near 15175 – 15200 resistance range and if the index crosses and sustains above this level then may reach 15350 – 15375 range.
On the contrary, The downward moment may drag the index to 14875 – 14850 support range and if this support is broken then index may tank near 14700 – 14675 range.
Part 1: The Market Remembers Where It Was HurtMarkets have a memory. Not in the way people do, of course, but price often reacts around the same areas where it reacted strongly in the past.
This is why an old rejection zone can become important again.
Imagine a stock moving from ₹400 to ₹500. Buyers are excited and keep pushing the price higher. But when the stock reaches around ₹500, sellers suddenly become aggressive. The price struggles to move above that area and eventually falls back to ₹450.
That ₹500 area has now become important.
Strong REJECTION from the trendline as expected! As we can see NIFTY showed a strong recover which was very well anticipated as there were two important supports which has been protecting NIFTY which is both a demand zone and a trendline support. Hence as long as we are above the trendline and above the demand zone! Every dip can be bought! So plan your trades accordingly and keep watching everyone.
NIFTY DAILY / Short Range Level Analysis: 13th AUG 2026🔕 SGMN SplD BULLISH Above => 24476.
🔕 SGMN SplD Bearish BELOW => 24398.
Mentioned analysis based on 2 consecutive candle close in 15 min Time Frame.
━━━━━🟥🟧🟨🟩🟦🟪⬛━━━━━
💥Level Interpretation / description:
✍🏻L#1: If the candle crossed & stays above the “Buy Gen”, it is treated / considered as Bullish bias. Cfm=> Confirmation.
L#2: Possibility / Probability of REVERSAL near 🔕RL/TF1 & 🔔RL/TF2
L#3: If the candle stays above “Sell Gen” but below “Buy Gen”, it is treated / considered as Sid
NACLIND : Rally Has Created an Interesting Demand Opportunity!NACL Industries is now pulling back toward an established demand zone after a powerful bullish move.
🔥 Why This Demand Zone Matters 🔥
The highlighted zone was formed after a relatively short base, followed by a strong bullish departure. Price did not spend much time around the origin before moving sharply higher.
That behaviour is important because when price moves away aggressively from a base, it provides evidence of a meaningful supply-demand imbalance.
• Strong bullish departure from t
GREAVESCOT: Strong Demand Zone Could Be Setting Up the Next moveGreaves Cotton has corrected sharply after a strong rally and is now approaching a high-quality demand zone . This is where the chart becomes interesting because price is returning to an area that previously produced strong bullish expansion.
📊 Why This Demand Zone Matters 📊
The demand zone has several qualities that make it worth watching:
• Strong bullish move originated from this area
• Good leg-out with strong follow-through
• The move from the zone led to a significant rally
• Price has
Nifty Intraday Analysis for 12th August 2026NSE:NIFTY
Index has downside risk as long as it is below 24500 - 24600 range.
The upward movement may lead to 24700 – 24750 resistance range and if the index crosses and sustains above this level then may reach near 24950 – 25000 range.
On the contrary, The downward moment may drag the Index to 24250 – 24200 support range in downward momentum and if this support is broken then index may tank near 24000 – 23950 range.
Banknifty Intraday Analysis for 12th August 2026NSE:BANKNIFTY
The highest Call and Put OI is built up at 58000 strike which will act as resistance as long as it is not broken and Index has downside risk as long as it is below 57500.
The upward moment may lead the Index to 58200 – 58300 resistance range in upward momentum and if the index crosses and sustains above this level then may reach near 58900 – 59000 range.
On the contrary, The downward moment may drag the Index to 56700 – 56600 support range in downward momentum and if this supp
Finnifty Intraday Analysis for 12th August 2026NSE:CNXFINANCE
Index has downside risk as long as it is below the 26500 - 26700 range.
The upward movement may lead the Index to 26700 - 26750 resistance range and if the index crosses and sustains above this level then may reach near 27000 - 27050 range.
On the contrary, The downward moment may drag the to 26150 – 26100 support range and if this support too is broken then index may tank near 25850 – 25800 range.
Midnifty Intraday Analysis for 12th August 2026NSE:NIFTY_MID_SELECT
Index is near breakout and uptrend is expected to continue as long as the index is above 14800 level.
The upward movement may lead the Index near 15150 – 15175 resistance range and if the index crosses and sustains above this level then may reach 15325 – 15350 range.
On the contrary, The downward moment may drag the index to 14825 – 14800 support range and if this support is broken then index may tank near 14650 – 14625 range.
TCS — False Breakdown at BAL, Long Towards VASetup:
TCS spent early August rotating inside a defined balance area on the 1H chart (~2,300–2,500). Price broke down sharply below the balance area low on Aug 12, making a new swing low near 2,296, and is now showing signs of reclaiming back into the range — currently trading near 2,340. This looks like a potential failed breakdown, where the market rejects the move outside the balance area and rotates back toward value.
Key Levels:
BAL: 2,322
BAH: 2,494
VAH: 2,460
VAL: 2,430
Trade Plan: