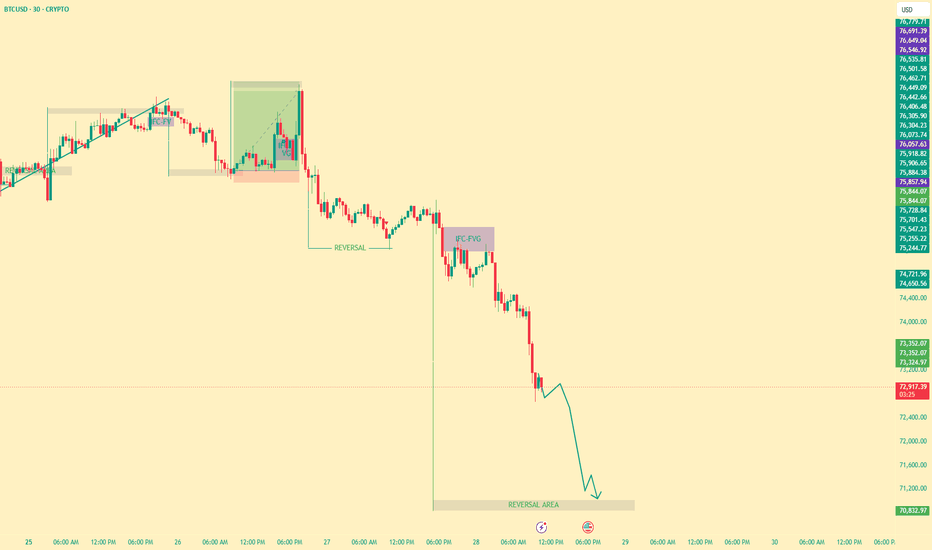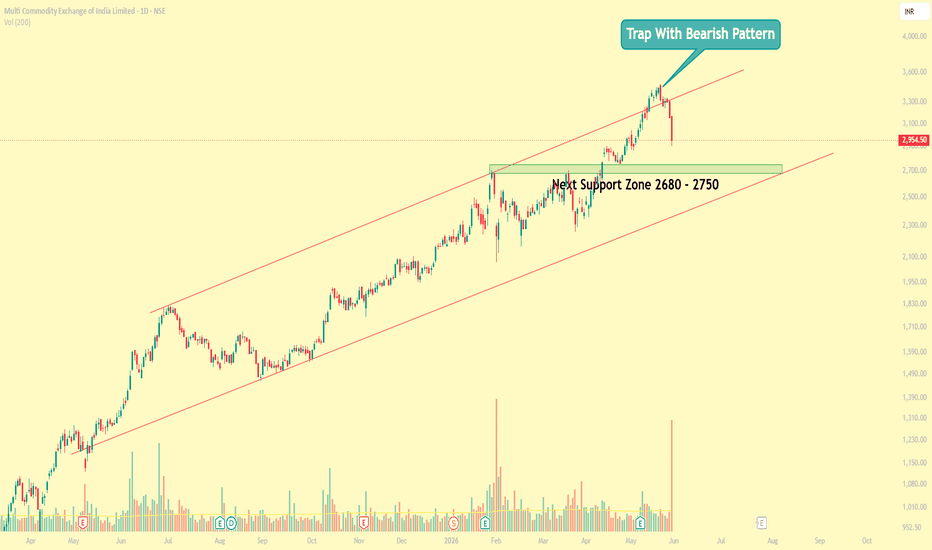
Simple analysis trap with confirmed bearish candle stick pattern.
first break rising channel breakout and then price not move fast and not up side.
price go sideways and gave down mov this bearish candle stick pattern.
now,
next support is 2650- 2750.
please do your own research before talking any trade.
I am not financial advisor.
Please feel free to ask any questions.
Supply and Demand
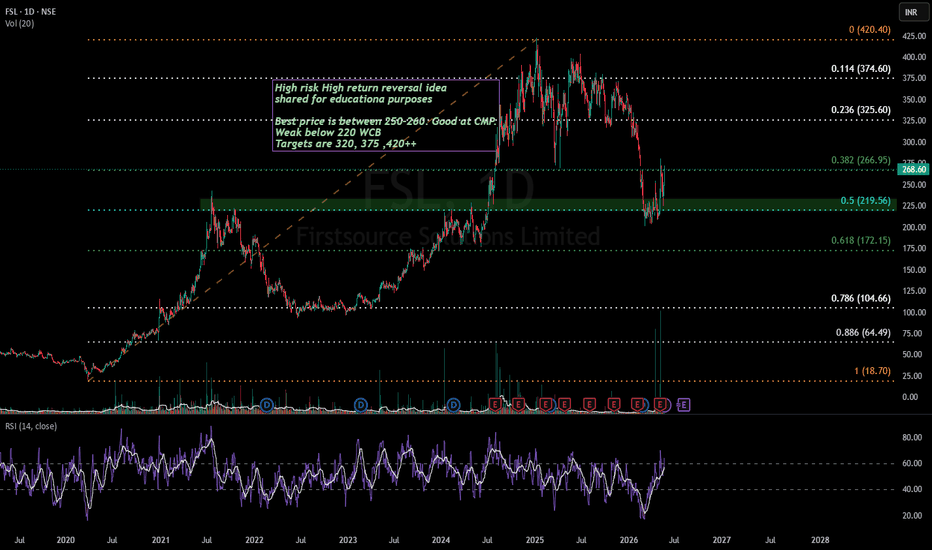
Firstsource looks to be cranked up for ATH levels!Uncertainty in global economy is causing a slowdown in overall IT industry.
However, FSL is looking all good for a strong reversal.
The volume at 50% Fib retracement support is an indicator of the same.
Q4 Revenue & EBITDA posted by company is at record high.
Stock can be one of the earliest stock to reach ATH if IT sector starts to recover. Don't miss to keep this in your watchlist.
The risk is around 15% and reward is more than 50%.
This is not a recommendation and is strictly for educational purposes
XAUUSD GOLD ANALYSIS ON (28 MAY 2026)#XAUUSD UPDATE...!!!
Current price = 4387
If price stay above 4370 then next target 4410,4430 and 4460 and below that 4320
Plan1;If price break 4390-4385 area,and stay above 4390 we will placed buy order in gold with target of 4410,4430 and 4360 & stop loss should be placed at 4470
NIFTY DAILY / Short Range Level Analysis for 29th May 2026๐ SGMN SplD BULLISH Above => 23974.
๐ SGMN SplD Bearish BELOW => 23843.
โโโโโ๐ฅ๐ง๐จ๐ฉ๐ฆ๐ชโฌโโโโโ
๐ฅLevel Interpretation / description:
โ๐ปL#1: If the candle crossed & stays above the โBuy Genโ, it is treated / considered as Bullish bias. Cfm=> Confirmation.
L#2: Possibility / Probability of REVERSAL near ๐RL/TF1 & ๐RL/TF2
L#3: If the candle stays above โSell Genโ but below โBuy Genโ, it is treated / considered as Sidewise. Aggressive Traders can take Long position near โSell Genโ either retesting or crossed from Below & vice-versa i.e. can take Short position near โBuy Genโ either retesting or crossed downward from Above.
L#4: If the candle crossed & stays below the โSell Genโ, it is treated / considered a Bearish bias.
L#5: Possibility / Probability of REVERSAL near ๐RL/TF1 & ๐RL/TF2
HZB (Buy side) & HZS (Sell side) => Hurdle Zone,
โ๐ป *** Specialty of โHZB#1, HZB#2 HZS#1 & HZS#2โ is Sidewise (behaviour in Nature)
Rest Plotted and Mentioned on Chart
Color code Used:
Green, BLUE =. Positive bias.
Safron, RED =. Negative bias.
RED in Between Green means Trend Finder / Momentum Change
/ CYCLE Change and Vice Versa.
Notice One thing: HOW LEVELS are Working.
Use any Momentum Indicator / Oscillator or as you "USED to" to Take entry.
โโโโโ๐ฅ๐ง๐จ๐ฉ๐ฆ๐ชโฌโโโโโ
โ ๏ธ DISCLAIMER:
The information, views, and ideas shared here are purely for educational and informational purposes only. They are not intended as investment advice or a recommendation to buy, sell, or hold any financial instruments. I am not a SEBI-registered financial adviser.
Trading and investing in the stock market involves risk, and you should do your own research and analysis. You are solely responsible for any decisions made based on this research.
"๐As HARD EARNED MONEY IS YOUR's, So DECISION SHOULD HAVE TO BE YOUR's".
โโโโโ๐ฅ๐ง๐จ๐ฉ๐ฆ๐ชโฌโโโโโ
โ๏ธ Follow notification about periodical View
๐ฅ Do Comment for Stock WEEKLY Level Analysis.๐
๐ Do you agree with this view?
โ๏ธ HIT THE PLANE ICON if this technical observation resonates with you. It will Motivate me.
โโโโโ๐ฅ๐ง๐จ๐ฉ๐ฆ๐ชโฌโโโโโ
๐ก If You LOOKING any CHART & want for Level and ANALYZE?
Share your desired stock names in the comments below! I will try to analyze the chart Levels, patterns and share my technical view (so far my Knowledge).
If Viewers think It can identify meaningful setups. Looking forward to hearing from all of you โ let's keep this discussion going and help each other make better trading decisions.
___________๐^^^โซโช^๐๐ผ๐๐ผ๐๐ผ^โชโซ^^^๐___________
We are still above our demand zone.As we can see NIFTY despite the weakness, managed to close itself above the demand zone, showing strength. Hence, we can expect NIFTY to remain bullish until it manages to sustain itself above 23800 levels. The agreement to open Hormuz can act as a catalyst to further make NIFTY more bullish. So plan your trades accordingly and keep watching everyone.
Nifty Intraday Analysis for 27th May 2026NSE:NIFTY
Slight volatility is expected due to the expiry of F&O contracts on the BSE. However, developments in the US-Iran negotiations in Doha will fuel momentum in either direction.
Upward movement may lead to 24100 โ 24150 resistance range and if the index crosses and sustains above this level then may reach near 24350 โ 24400 range.
On the contrary, the index may drag to 23700 โ 23650 support range in downward momentum and if this support is broken then index may tank near 23450 โ 23400 range.
Banknifty Intraday Analysis for 27th May 2026NSE:BANKNIFTY
Slight volatility is expected due to the expiry of F&O contracts on the BSE. However, developments in the US-Iran negotiations in Doha will fuel momentum in either direction.
Any upward moment may lead the Index to 55800 โ 55900 resistance range in upward momentum and if the index crosses and sustains above this level then may reach near 56500 โ 56600 range.
On the contrary, Index is near 55000 - 54900 support zone and if this support is broken then Index may drag to 54400 โ 54300 support range in downward momentum and if this support is broken then index may tank near 53600 โ 53500 range.
Finnifty Intraday Analysis for 27th May 2026 NSE:CNXFINANCE
Slight volatility is expected due to the expiry of F&O contracts on the BSE. However, developments in the US-Iran negotiations in Doha will fuel momentum in either direction.
The index is near the 26000 resistance zone and if this resistance is broken then upward movement may lead the Index to 26200 - 26250 resistance range and if index crosses and sustains above this level then may reach near 26500 - 26550 range which seems unlikely.
On the contrary, any downward moment, Index may drag to 25650 โ 25600 support range and if this support too is broken then index may tank near 25350 โ 25300 range.
Midnifty Intraday Analysis for 27th May 2026NSE:NIFTY_MID_SELECT
Slight volatility is expected due to the expiry of F&O contracts on the BSE. However, developments in the US-Iran negotiations in Doha will fuel momentum in either direction.
Upward movement may lead the Index near 14825 โ 14850 resistance range and if the index crosses and sustains above this level then may reach 14975 โ 15000 range.
On the contrary, a downward moment may drag the index to 14525 โ 14500 support range and if this support is broken then index may tank near 14350 โ 14325 range.
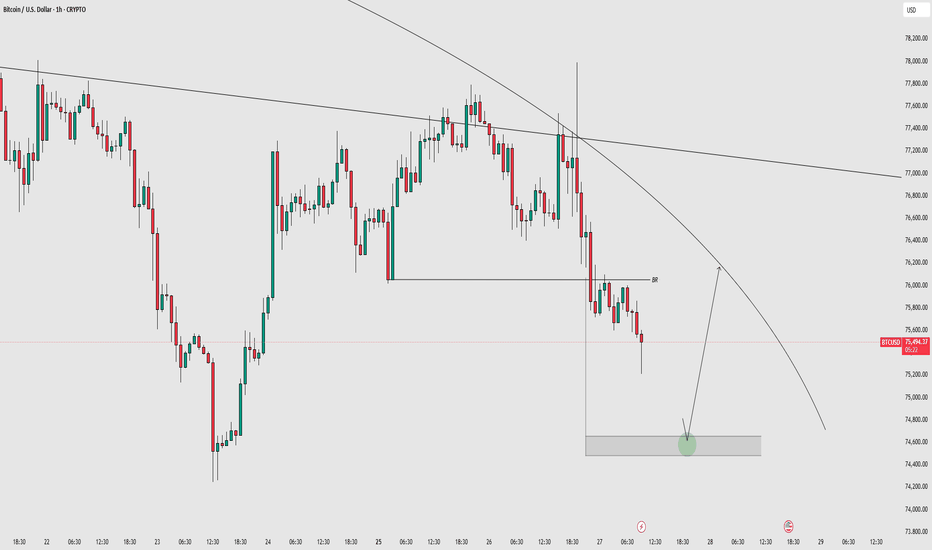
BTCUSD 1H โ BR Reversal Zone AnalysisOn the 1H timeframe, the market successfully broke the previous low and continued moving toward the downside, which clearly shows that bearish pressure is still active in the market.
For this setup, I used the BR Concept to identify a possible reversal area. After the low breakout, I measured the structure from the top side and projected a 2X range to create a clean reversal zone. Another way to understand it is that I used the demand area of the breakout structure and added equal supply pressure based on body measurement. This is one of the main ways BR setups are analyzed.
Now the main focus is very simple โ if the market reaches the marked reversal zone and forms any strong positive confirmation candle such as:
Bullish Engulfing
Strong Rejection Candle
Any Positive Confirmation Pattern
then the market could give a temporary upside reaction or pullback from this area. ๐
At the moment, the overall structure still looks bearish because the market already broke the low and supply pressure remains strong. That is why I am only watching for confirmation inside the reversal zone before expecting any upside move.
Now letโs see whether the market respects the BR reversal zone or continues following the bearish trend. ๐ฅ
Concepts Used :
โ
BR Concept
โ
Low Breakout
โ
2X Body Measurement
โ
Reversal Zone
โ
Supply & Demand
โ
MMC Concept
This analysis is based on the MMC concepts designed by Candle King. His concepts have helped me understand reversal structures and market behavior much more clearly.
We are bullish as long as we are above 23800 As we can see NIFTY strongly rejected but since since it is still above our demand zone, makes us still bullish now. Hence as long as NIFTY manages to sustain itself above 23800, every fall can brought technically! So plan your trades accordingly and keep watching everyone.
SENSEX WEEKLY EXP. / Short Range Level Analysis: 26th May 2026๐ SGMN SplD BULLISH Above => 76228.
๐ SGMN SplD Bearish BELOW => 75801.
โโโโโ๐ฅ๐ง๐จ๐ฉ๐ฆ๐ชโฌโโโโโ
๐ฅLevel Interpretation / description:
โ๐ปL#1: If the candle crossed & stays above the โBuy Genโ, it is treated / considered as Bullish bias. Cfm=> Confirmation.
L#2: Possibility / Probability of REVERSAL near ๐RL/TF1 & ๐RL/TF2
L#3: If the candle stays above โSell Genโ but below โBuy Genโ, it is treated / considered as Sidewise. Aggressive Traders can take Long position near โSell Genโ either retesting or crossed from Below & vice-versa i.e. can take Short position near โBuy Genโ either retesting or crossed downward from Above.
L#4: If the candle crossed & stays below the โSell Genโ, it is treated / considered a Bearish bias.
L#5: Possibility / Probability of REVERSAL near ๐RL/TF1 & ๐RL/TF2
HZB (Buy side) & HZS (Sell side) => Hurdle Zone,
โ๐ป *** Specialty of โHZB#1, HZB#2 HZS#1 & HZS#2โ is Sidewise (behaviour in Nature)
Rest Plotted and Mentioned on Chart
Color code Used:
Green, BLUE =. Positive bias.
Safron, RED =. Negative bias.
RED in Between Green means Trend Finder / Momentum Change
/ CYCLE Change and Vice Versa.
Notice One thing: HOW LEVELS are Working.
Use any Momentum Indicator / Oscillator or as you "USED to" to Take entry.
โโโโโ๐ฅ๐ง๐จ๐ฉ๐ฆ๐ชโฌโโโโโ
โ ๏ธ DISCLAIMER:
The information, views, and ideas shared here are purely for educational and informational purposes only. They are not intended as investment advice or a recommendation to buy, sell, or hold any financial instruments. I am not a SEBI-registered financial adviser.
Trading and investing in the stock market involves risk, and you should do your own research and analysis. You are solely responsible for any decisions made based on this research.
"๐As HARD EARNED MONEY IS YOUR's, So DECISION SHOULD HAVE TO BE YOUR's".
โโโโโ๐ฅ๐ง๐จ๐ฉ๐ฆ๐ชโฌโโโโโ
โ๏ธ Follow notification about periodical View
๐ฅ Do Comment for Stock WEEKLY Level Analysis.๐
๐ Do you agree with this view?
โ๏ธ HIT THE PLANE ICON if this technical observation resonates with you. It will Motivate me.
โโโโโ๐ฅ๐ง๐จ๐ฉ๐ฆ๐ชโฌโโโโโ
๐ก If You LOOKING any CHART & want for Level and ANALYZE?
Share your desired stock names in the comments below! I will try to analyze the chart Levels, patterns and share my technical view (so far my Knowledge).
If Viewers think It can identify meaningful setups. Looking forward to hearing from all of you โ let's keep this discussion going and help each other make better trading decisions.
___________๐^^^โซโช^๐๐ผ๐๐ผ๐๐ผ^โชโซ^^^๐___________
NIFTY DAILY / Short Range Level Analysis for 27th May 2026๐ SGMN SplD BULLISH Above => 23981 .
๐ SGMN SplD Bearish BELOW => 23849.
โโโโโ๐ฅ๐ง๐จ๐ฉ๐ฆ๐ชโฌโโโโโ
๐ฅLevel Interpretation / description:
โ๐ปL#1: If the candle crossed & stays above the โBuy Genโ, it is treated / considered as Bullish bias. Cfm=> Confirmation.
L#2: Possibility / Probability of REVERSAL near ๐RL/TF1 & ๐RL/TF2
L#3: If the candle stays above โSell Genโ but below โBuy Genโ, it is treated / considered as Sidewise. Aggressive Traders can take Long position near โSell Genโ either retesting or crossed from Below & vice-versa i.e. can take Short position near โBuy Genโ either retesting or crossed downward from Above.
L#4: If the candle crossed & stays below the โSell Genโ, it is treated / considered a Bearish bias.
L#5: Possibility / Probability of REVERSAL near ๐RL/TF1 & ๐RL/TF2
HZB (Buy side) & HZS (Sell side) => Hurdle Zone,
โ๐ป *** Specialty of โHZB#1, HZB#2 HZS#1 & HZS#2โ is Sidewise (behaviour in Nature)
Rest Plotted and Mentioned on Chart
Color code Used:
Green, BLUE =. Positive bias.
Safron, RED =. Negative bias.
RED in Between Green means Trend Finder / Momentum Change
/ CYCLE Change and Vice Versa.
Notice One thing: HOW LEVELS are Working.
Use any Momentum Indicator / Oscillator or as you "USED to" to Take entry.
โโโโโ๐ฅ๐ง๐จ๐ฉ๐ฆ๐ชโฌโโโโโ
โ ๏ธ DISCLAIMER:
The information, views, and ideas shared here are purely for educational and informational purposes only. They are not intended as investment advice or a recommendation to buy, sell, or hold any financial instruments. I am not a SEBI-registered financial adviser.
Trading and investing in the stock market involves risk, and you should do your own research and analysis. You are solely responsible for any decisions made based on this research.
"๐As HARD EARNED MONEY IS YOUR's, So DECISION SHOULD HAVE TO BE YOUR's".
โโโโโ๐ฅ๐ง๐จ๐ฉ๐ฆ๐ชโฌโโโโโ
โ๏ธ Follow notification about periodical View
๐ฅ Do Comment for Stock WEEKLY Level Analysis.๐
๐ Do you agree with this view?
โ๏ธ HIT THE PLANE ICON if this technical observation resonates with you. It will Motivate me.
โโโโโ๐ฅ๐ง๐จ๐ฉ๐ฆ๐ชโฌโโโโโ
๐ก If You LOOKING any CHART & want for Level and ANALYZE?
Share your desired stock names in the comments below! I will try to analyze the chart Levels, patterns and share my technical view (so far my Knowledge).
If Viewers think It can identify meaningful setups. Looking forward to hearing from all of you โ let's keep this discussion going and help each other make better trading decisions.
___________๐^^^โซโช^๐๐ผ๐๐ผ๐๐ผ^โชโซ^^^๐___________
Nifty Intraday Analysis for 26th May 2026NSE:NIFTY
Volatility is expected due to the expiry of F&O contracts on the NSE. However, developments in the US-Iran negotiations in Doha will fuel momentum in either direction.
Index may face resistance near 24250 โ 24300 resistance range and if the index crosses and sustains above this level then may reach near 24500 โ 24550 range.
On the contrary, the index may drag to 23800 โ 23750 support range in downward momentum and if this support is broken then index may tank near 23550 โ 23500 range.
Banknifty Intraday Analysis for 26th May 2026NSE:BANKNIFTY
Volatility is expected due to the expiry of F&O contracts on the NSE. However, developments in the US-Iran negotiations in Doha will fuel momentum in either direction.
Index may face resistance near 56000 โ 56100 resistance range in upward momentum and if the index crosses and sustains above this level then may reach near 56700 โ 56800 range.
On the contrary, Index may drag to 54600 โ 54500 support range in downward momentum and if this support is broken then index may tank near 53800 โ 53700 range.
Finnifty Intraday Analysis for 26th May 2026 NSE:CNXFINANCE
Volatility is expected due to the expiry of F&O contracts on the NSE. However, developments in the US-Iran negotiations in Doha will fuel momentum in either direction.
index is near 26250 - 26300 resistance zone and upward momentum seems limited. However, if this resistance is broken then upward movement may lead the Index to 26400 - 26450 resistance range and if index crosses and sustains above this level then may reach near 26750 - 26800 range which seems unlikely.
On the contrary, Index may drag to 25800 โ 25750 support range and if this support too is broken then index may tank near 25450 โ 25400 range.
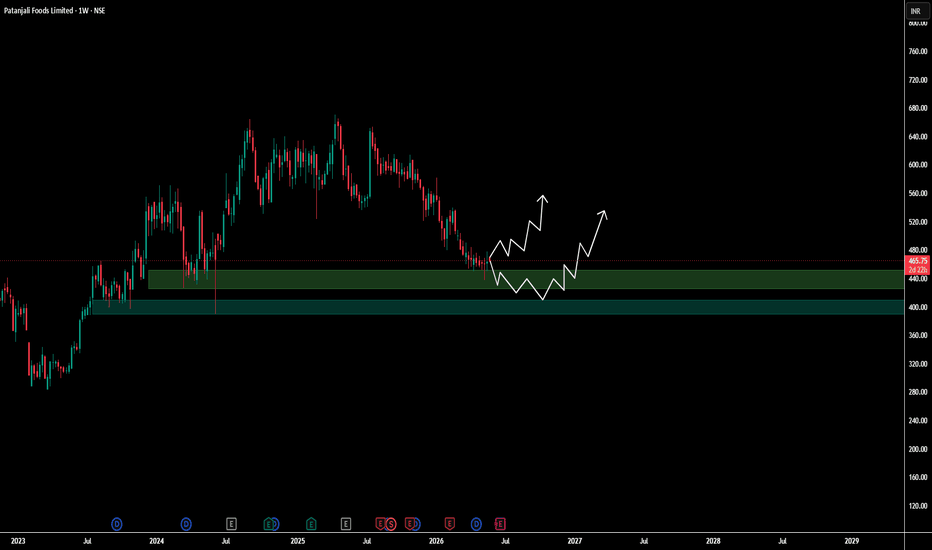
Patanjali Foods Ltd. โ Weekly Chart AnalysisPrice is currently trading near a major weekly demand zone around โน430โโน440. This level has acted as strong support multiple times in the past, making it a key area to watch.
As long as the stock holds above this zone, chances of a medium-term reversal remain strong.
A successful bounce can push price toward โน520โโน560 initially.
Major resistance is placed near โน650โโน670, where strong supply is visible on the weekly timeframe.
If support breaks decisively below โน430, bearish pressure may continue in the short term.
Technical View:
The stock is approaching an important decision zone after a prolonged correction. Watch for bullish confirmation and volume expansion before aggressive entries.
Key Levels:
Support: โน430โโน440
Resistance 1: โน520โโน560
Major Resistance: โน650โโน670
Disclaimer:
This analysis is for educational purposes only and not financial advice. Please manage risk properly and do your own research before investing or trading.
Midnifty Intraday Analysis for 26th May 2026NSE:NIFTY_MID_SELECT
Volatility is expected due to the expiry of F&O contracts on the NSE. However, developments in the US-Iran negotiations in Doha will fuel momentum in either direction.
Index is near 14500 support and if this support is respected then upward movement may lead the Index near 14725 โ 14750 resistance range and if the index crosses and sustains above this level then may reach 14925 โ 14950 range.
On the contrary, if 14500 support is broken then index may drag to 14375 โ 14350 support range and if this support is broken then index may tank near 14175 โ 14150 range.
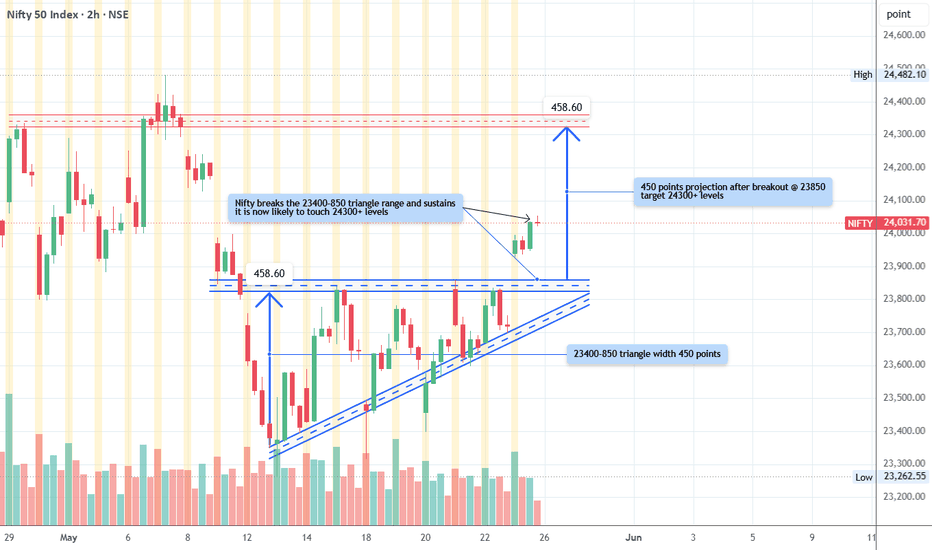
Nifty captures 24K... whats the next target?Since 11th May, Nifty has been spending time in the 23400 to 23850 zone. It did try to break free at 850 levels multiple times, forming a triangle of 450 points.
On 25th May, it captured the 24K level and finally closed above it.
Levels shown on chart for the next likely move.
A respite in taxation in trading can make NIFTY more bullish!As we can see, NIFTY showed a strong recovery in the closing hours which was due to a hint in Finance minister's statement that could show respite in taxation. This respite in taxation is a big news as this could attract more investors and give existing investors more room to trade, which could create a positive sentiment, which could lead NIFTY to further upmove. Additionally, Technicallly, as long as NIFTY manages to sustain itself above 23850, every dip can be bought, sp plan your trades accordingly and keep watching everyone.
Nifty Intraday Analysis for 25th May 2026NSE:NIFTY
Positive news regarding the resolution of the West Asia conflict will boost upside momentum. However, volatility is expected due to the unwinding of F&O positions ahead of the May month contract expiry, scheduled for Tuesday on the NSE and Wednesday on the BSE.
Index is near 23850 resistance and if this resistance is broken then upward movement may lead the Index to 23975 โ 24025 resistance range and if the index crosses and sustains above this level then may reach near 24275 โ 24325 range.
On the contrary, the index may drag to 24475 โ 23425 support range and if this support is broken then index may tank near 23175 โ 23125 range.