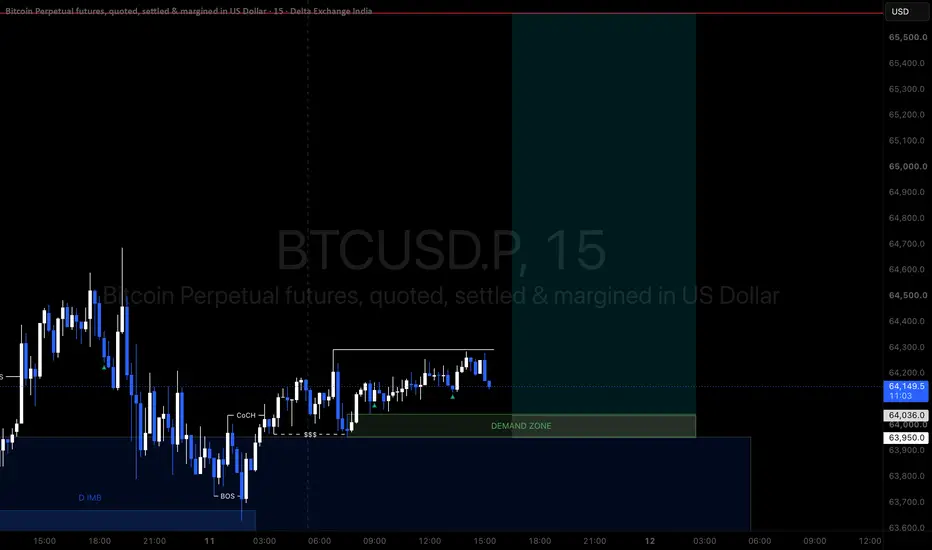
Supply and Demand
Dell**DELL Technologies — Technical View: Bearish Bias Building**
It appears to be transitioning from a strong impulsive uptrend into a distribution phase following its recent all-time high.
*CMP: $434.97*
Dell registered an all-time high of $469.47 on 1st June, followed by a **bearish tweezer top** formation on 2nd June, with the second candle closing at $469.19 — a classic reversal signal at elevated levels. Since this formation, the stock has struggled to sustain those highs, reinforcing the c
BIRLA SOFT Birlasoft – Attractive Risk-Reward Near Monthly Support
- Birlasoft is currently trading near a strong monthly support zone, making it an attractive accumulation opportunity.
Trade Setup:
~Buy Zone: ₹285–290
~Stop Loss: ₹265–268
~Target: ₹340–345
- Stock appears to be showing early signs of recovery after a prolonged correction. If the current support level holds and buying momentum continues,Birlasoft has the potential to recover towards the ₹340–345 zone in the near to medium term.
- A di
BANKNIFTY DAILY/ Short Range Level Analysis for 13th Jul 2026🔕 SGMN SplD BULLISH Above => 58262.
🔕 SGMN SplD Bearish BELOW => 57844.
Mentioned analysis based on 2 consecutive candle close in 15 min Time Frame.
━━━━━🟥🟧🟨🟩🟦🟪⬛━━━━━
💥Level Interpretation / description:
✍🏻L#1: If the candle crossed & stays above the “Buy Gen”, it is treated / considered as Bullish bias. Cfm=> Confirmation.
L#2: Possibility / Probability of REVERSAL near 🔕RL/TF1 & 🔔RL/TF2
L#3: If the candle stays above “Sell Gen” but below “Buy Gen”, it is treated / considered as Si
BANKNIFTY WEEKLY/ Short Range Level Analysis: 13th-17th Jul 2026🔔SGMN SplWP BULLISH Above => 58591.
🔔 SGMN SplWP Bearish BELOW => 57396.
Mentioned analysis based on 2 consecutive candle close in 15 min Time Frame.
━━━━━🟥🟧🟨🟩🟦🟪⬛━━━━━
💥Level Interpretation / description:
✍🏻L#1: If the candle crossed & stays above the “Buy Gen”, it is treated / considered as Bullish bias. Cfm=> Confirmation.
L#2: Possibility / Probability of REVERSAL near 🔕RL/TF1 & 🔔RL/TF2
L#3: If the candle stays above “Sell Gen” but below “Buy Gen”, it is treated / considered as
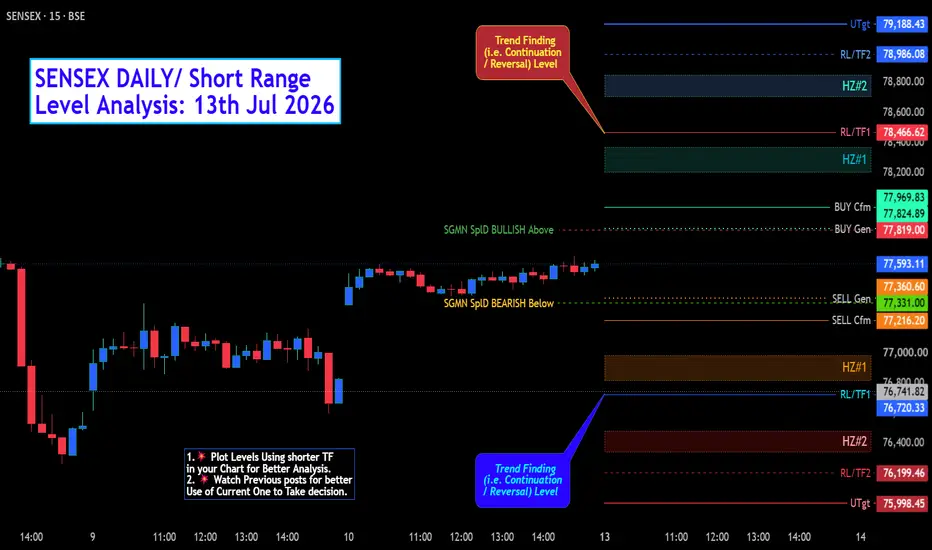
SENSEX DAILY/ Short Range Level Analysis: 13th Jul 2026🔕 SGMN SplD BULLISH Above => 77819
🔕 SGMN SplD Bearish BELOW => 77331.
Mentioned analysis based on 2 consecutive candle close in 15 min Time Frame.
━━━━━🟥🟧🟨🟩🟦🟪⬛━━━━━
💥Level Interpretation / description:
✍🏻L#1: If the candle crossed & stays above the “Buy Gen”, it is treated / considered as Bullish bias. Cfm=> Confirmation.
L#2: Possibility / Probability of REVERSAL near 🔕RL/TF1 & 🔔RL/TF2
L#3: If the candle stays above “Sell Gen” but below “Buy Gen”, it is treated / considered as Si
SENSEX WEEKLY/ POSITIONAL Level Analysis: 13th-17th Jul 2026.🔔 SGMN SplD BULLISH Above => 78457.
🔔 SGMN SplD Bearish BELOW => 76425.
Mentioned analysis based on 2 consecutive candle close in 15 min Time Frame.
━━━━━🟥🟧🟨🟩🟦🟪⬛━━━━━
💥Level Interpretation / description:
✍🏻L#1: If the candle crossed & stays above the “Buy Gen”, it is treated / considered as Bullish bias. Cfm=> Confirmation.
L#2: Possibility / Probability of REVERSAL near 🔕RL/TF1 & 🔔RL/TF2
L#3: If the candle stays above “Sell Gen” but below “Buy Gen”, it is treated / considered as S
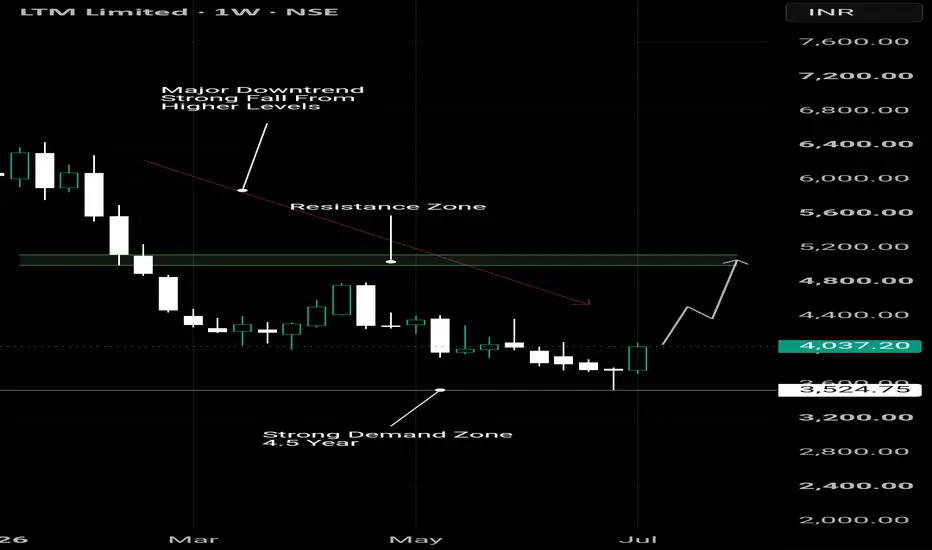
LTM on Watch!🚨 LTM on Watch! 👀
After a 4.5-year Strong Demand Zone bounce, the chart is finally showing signs of life. ✅
🎯 Next major hurdle: ₹5,000–₹5,100
If buyers sustain momentum, this setup could get very interesting.
📌 Bookmark this tweet and revisit in a few weeks to see how the chart played out.
What's your view?
Bullish | Bearish — Tell me why in the replies. 👇
🚨 Disclaimer: Not SEBI Registered. This is for educational purposes only, not a buy/sell recommendation.
#LTM #StockMarket #Trading
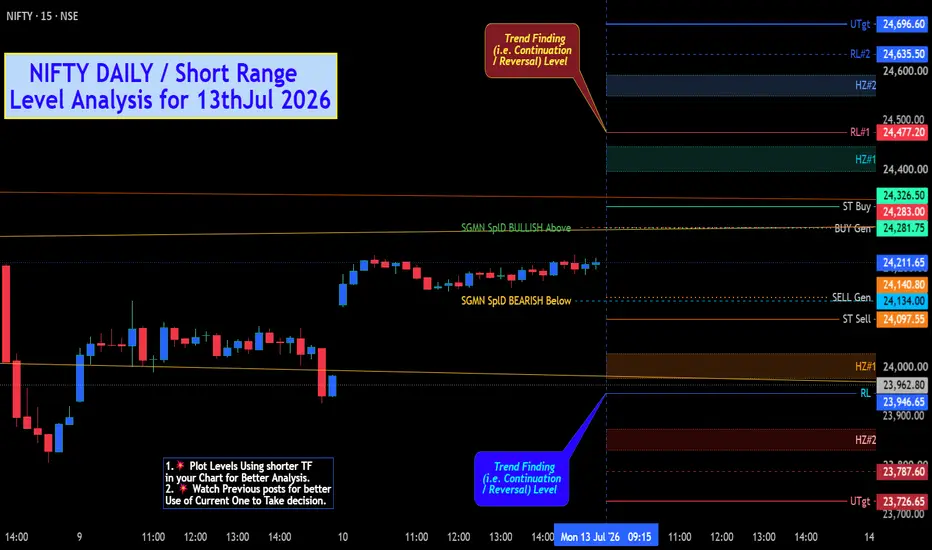
NIFTY DAILY / Short Range Level Analysis for 13thJul 2026.🔕 SGMN SplD BULLISH Above => 24283.
🔕 SGMN SplD Bearish BELOW => 24134.
Mentioned analysis based on 2 consecutive candle close in 15 min Time Frame.
━━━━━🟥🟧🟨🟩🟦🟪⬛━━━━━
💥Level Interpretation / description:
✍🏻L#1: If the candle crossed & stays above the “Buy Gen”, it is treated / considered as Bullish bias. Cfm=> Confirmation.
L#2: Possibility / Probability of REVERSAL near 🔕RL/TF1 & 🔔RL/TF2
L#3: If the candle stays above “Sell Gen” but below “Buy Gen”, it is treated / considered as S
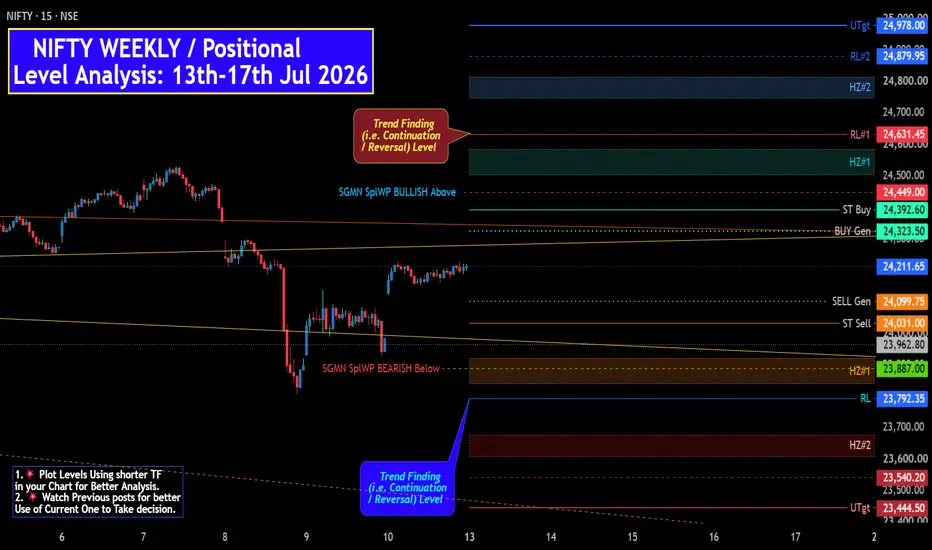
NIFTY WEEKLY / Positional Level Analysis: 13th-17th Jul 2026.🔔 SGMN SplWP BULLISH Above => 24449.
🔔 SGMN SplWP Bearish BELOW => 23887.
Mentioned analysis based on 2 consecutive candle close in 15 min Time Frame.
━━━━━🟥🟧🟨🟩🟦🟪⬛━━━━━
💥Level Interpretation / description:
✍🏻L#1: If the candle crossed & stays above the “Buy Gen”, it is treated / considered as Bullish bias. Cfm=> Confirmation.
L#2: Possibility / Probability of REVERSAL near 🔕RL/TF1 & 🔔RL/TF2
L#3: If the candle stays above “Sell Gen” but below “Buy Gen”, it is treated / considered as
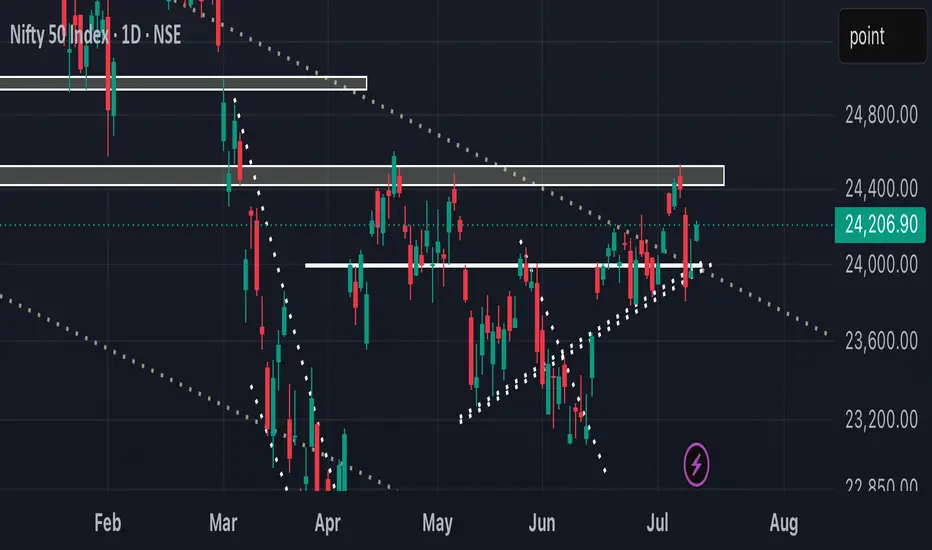
A flat opening can show another strong upmove! As we can see NIFTY couldn’t break below 23800 levels and took support at our trendline support and recovered. We are still somewhat weak below the supply zone above but we can see a box like structure around current zone hence a flat opening and break above 24230 can show 24400++ in no time. So plan your trades accordingly and keep watching everyone.
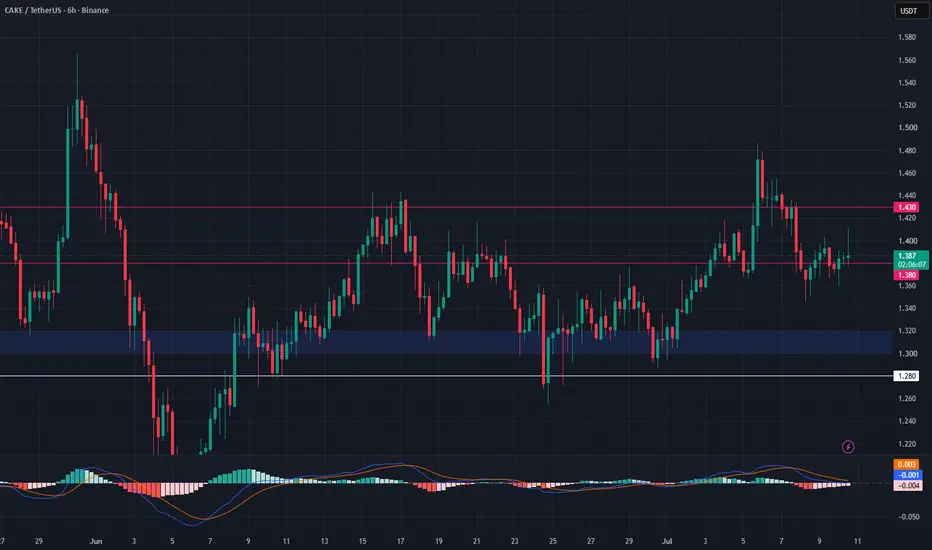
CAKE Maintains Bullish Structure—Pullback Entry Near Key SupportCAKE is up 14% since our previous analysis and continues to form higher lows.
A pullback toward the $1.30–$1.32 support zone may offer a better entry than chasing the current price.
Trading Levels:
Entry: $1.30–$1.32
TP1: $1.38
TP2: $1.43
Stop Loss: $1.28
Bullish while support holds.
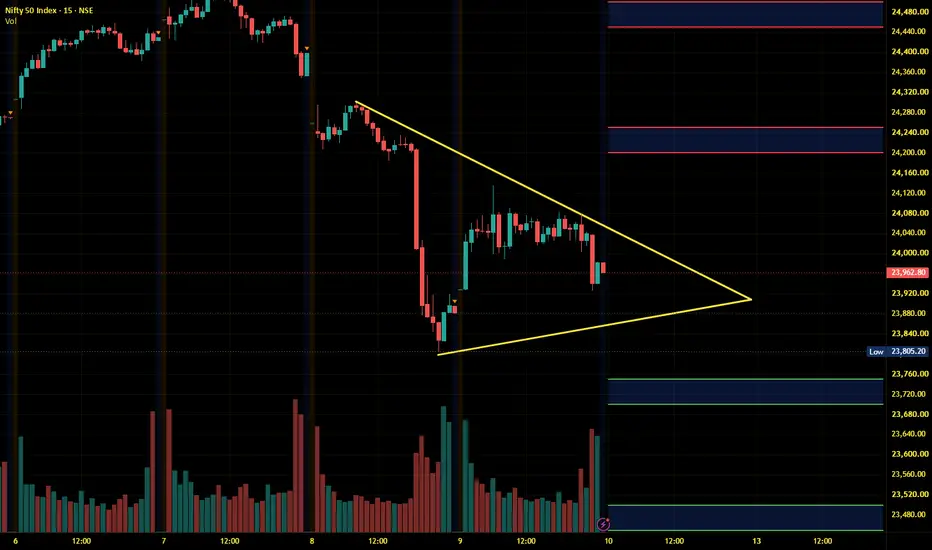
Nifty Intraday Analysis for 10th July 2026NSE:NIFTY
Global uncertainty has increased due to a fresh escalation between the US and Iran, which is expected to trigger market volatility. Consequently, markets may edge lower ahead of the weekend if the conflict intensifies further. However, any positive signals from either side before the closing bell could lift market sentiment.
The upward movement may lead to 24200 – 24250 resistance range and if the index crosses and sustains above this level then may reach near 24450 – 24500 range
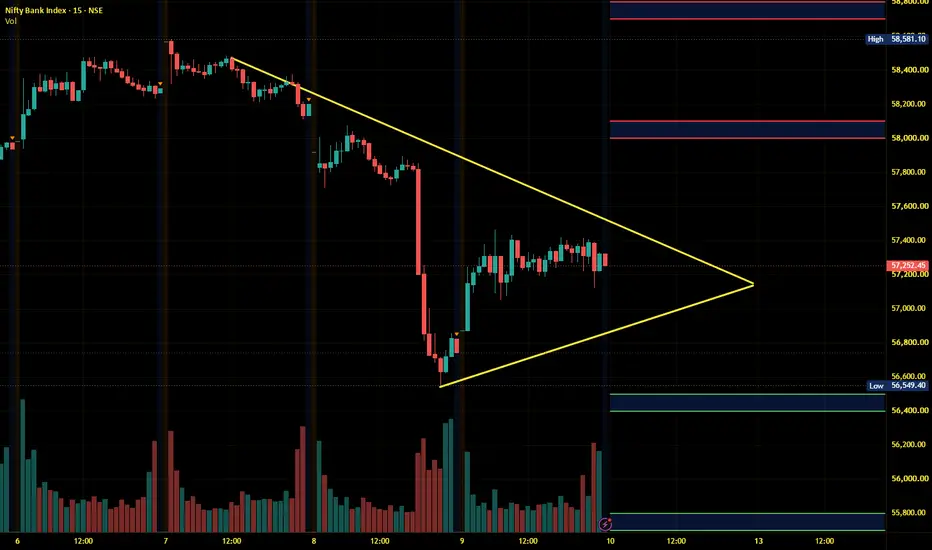
Banknifty Intraday Analysis for 10th July 2026NSE:BANKNIFTY
Global uncertainty has increased due to a fresh escalation between the US and Iran, which is expected to trigger market volatility. Consequently, markets may edge lower ahead of the weekend if the conflict intensifies further. However, any positive signals from either side before the closing bell could lift market sentiment.
The upward moment may lead the Index to 58000 – 58100 resistance range in upward momentum and if the index crosses and sustains above this level then may
Finnifty Intraday Analysis for 10th July 2026NSE:CNXFINANCE
Global uncertainty has increased due to a fresh escalation between the US and Iran, which is expected to trigger market volatility. Consequently, markets may edge lower ahead of the weekend if the conflict intensifies further. However, any positive signals from either side before the closing bell could lift market sentiment.
The upward movement may lead the Index to 26750 - 26800 resistance range and if the index crosses and sustains above this level then may reach near 27050
Midnifty Intraday Analysis for 10th July 2026NSE:NIFTY_MID_SELECT
Global uncertainty has increased due to a fresh escalation between the US and Iran, which is expected to trigger market volatility. Consequently, markets may edge lower ahead of the weekend if the conflict intensifies further. However, any positive signals from either side before the closing bell could lift market sentiment.
The upward movement may lead the Index near 14800 – 14825 resistance range and if the index crosses and sustains above this level then may reach 1