SENSEX DAILYY/ Short Range Level Analysis: 08th Jul 2026.🔕 SGMN SplD BULLISH Above => 78365.
🔕 SGMN SplD Bearish BELOW => 78008.
Mentioned analysis based on 2 consecutive candle close in 15 min Time Frame.
━━━━━🟥🟧🟨🟩🟦🟪⬛━━━━━
💥Level Interpretation / description:
✍🏻L#1: If the candle crossed & stays above the “Buy Gen”, it is treated / considered as Bullish bias. Cfm=> Confirmation.
L#2: Possibility / Probability of REVERSAL near 🔕RL/TF1 & 🔔RL/TF2
L#3: If the candle stays above “Sell Gen” but below “Buy Gen”, it is treated / considered as Side
Supply and Demand
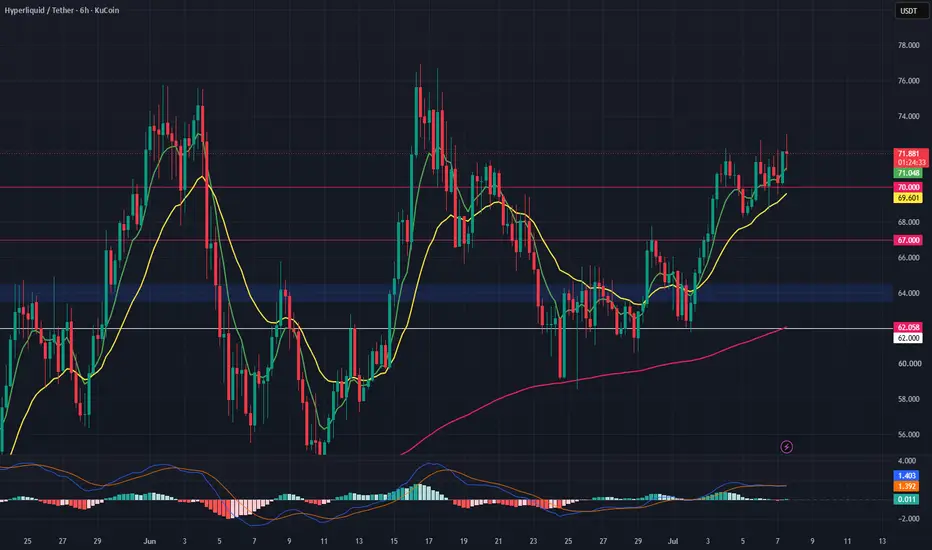
HYPE Bullish Structure Holding — Pullback Entry SetupHYPE remains one of the strongest charts in the market after breaking out of its multi-week downtrend.
The price is now holding above all key moving averages, which keeps the overall structure bullish. However, instead of chasing the rally, the better setup is to wait for a pullback into the $64.50 support zone.
If geopolitical tensions create a temporary sell-off and this level continues to hold, it could present a high-probability entry for a continuation move toward the recent highs.
Trade
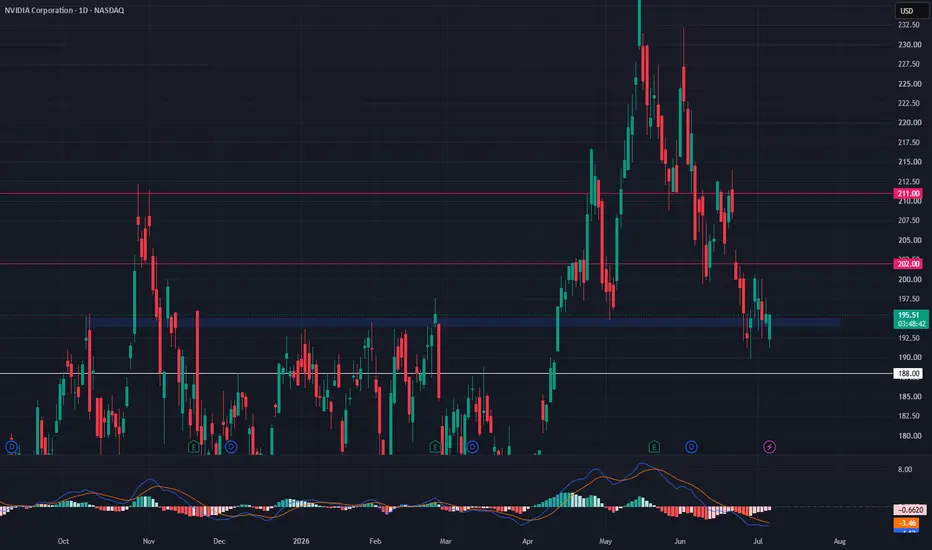
NVDA Holding Key Support as AI Ecosystem StrengthensNVIDIA NASDAQ:NVDA recently introduced a new partnership program that allows AI startups to exchange high-performance computing capacity for a share of their future product and cloud revenue. This move further strengthens NVIDIA’s position as a major player in the AI ecosystem.
From a technical perspective, NVDA is currently sitting near a key support level. If buyers continue to defend this zone and geopolitical risks remain controlled, the stock could regain momentum and move back toward it
BANKNIFTY DAILY / Short Range Level Analysis for 08th Jul 2026🔕 SGMN SplD BULLISH Above => 58361.
🔕 SGMN SplD Bearish BELOW => 58049.
Mentioned analysis based on 2 consecutive candle close in 15 min Time Frame.
━━━━━🟥🟧🟨🟩🟦🟪⬛━━━━━
💥Level Interpretation / description:
✍🏻L#1: If the candle crossed & stays above the “Buy Gen”, it is treated / considered as Bullish bias. Cfm=> Confirmation.
L#2: Possibility / Probability of REVERSAL near 🔕RL/TF1 & 🔔RL/TF2
L#3: If the candle stays above “Sell Gen” but below “Buy Gen”, it is treated / considered as S
NIFTY DAILY / Short Range Level Analysis for 08th Jul 2026🔕 SGMN SplD BULLISH Above => 24430.
🔕 SGMN SplD Bearish BELOW => 24334.
Mentioned analysis based on 2 consecutive candle close in 15 min Time Frame.
━━━━━🟥🟧🟨🟩🟦🟪⬛━━━━━
💥Level Interpretation / description:
✍🏻L#1: If the candle crossed & stays above the “Buy Gen”, it is treated / considered as Bullish bias. Cfm=> Confirmation.
L#2: Possibility / Probability of REVERSAL near 🔕RL/TF1 & 🔔RL/TF2
L#3: If the candle stays above “Sell Gen” but below “Buy Gen”, it is treated / considered as S
INFO EDGE The stock has already delivered a strong breakout. Instead of chasing the rally, it would be prudent to wait for a healthy retest before considering a fresh entry.
Ideal Buy Zone: ₹1,085–1,090
Stop Loss: Below ₹985
Target: ₹1,380–1,400 and above
Patience is key. Allow the stock to retrace toward the suggested buy zone and confirm support before entering the trade. Always manage your position size according to your risk tolerance.
This analysis is for educational purposes only and should not
Nifty Intraday Analysis for 07th July 2026NSE:NIFTY
The uptrend will likely continue, but expect volatility due to the weekly option expiry.
The upward movement may lead to 24650 – 24700 resistance range and if the index crosses and sustains above this level then may reach near 24900 – 24950 range.
On the contrary, a downward moment may drag the Index to 24200 – 24150 support range in downward momentum and if this support is broken then index may tank near 23950 – 23900 range.
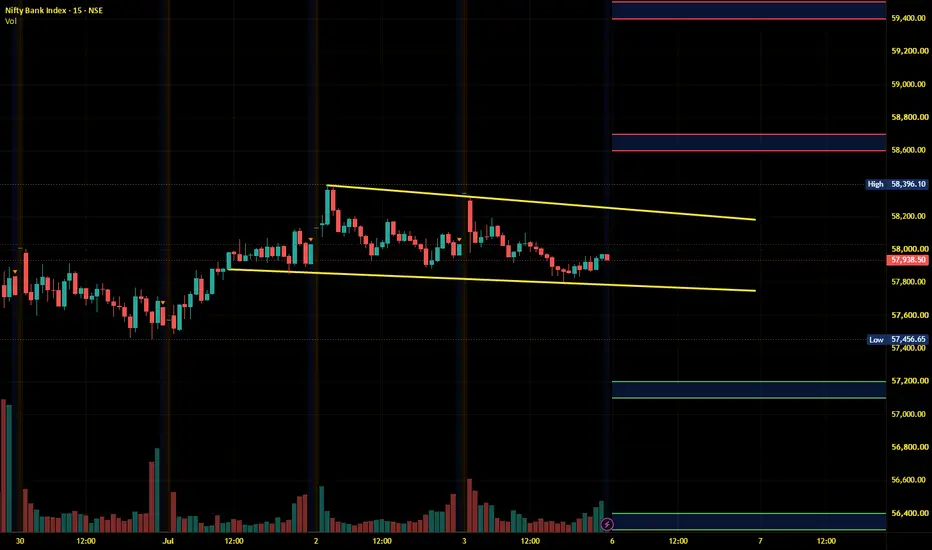
Banknifty Intraday Analysis for 07th July 2026NSE:BANKNIFTY
The uptrend is expected to continue; therefore, any gap-down opening will be seen as a fresh entry opportunity.
The upward moment may lead the Index to 58900 – 59000 resistance range in upward momentum and if the index crosses and sustains above this level then may reach near 59600 – 59700 range.
On the contrary, a downward moment may drag the Index to 57700 – 57600 support range in downward momentum and if this support is broken then the index may tank near the 57000 – 56900
Finnifty Intraday Analysis for 07th July 2026NSE:CNXFINANCE
The uptrend is expected to continue; therefore, any gap-down opening will be seen as a fresh entry opportunity.
The upward movement may lead the Index to 27250 - 27300 resistance range and if the index crosses and sustains above this level then may reach near 27550 - 27600 range.
On the contrary, a downward moment may drag the to 26750 – 26700 support range and if this support too is broken then index may tank near 26450 – 26400 range.
Midnifty Intraday Analysis for 0 7th July 2026NSE:NIFTY_MID_SELECT
The uptrend is expected to continue; therefore, any gap-down opening will be seen as a fresh entry opportunity.
The upward movement may lead the Index near 14775 – 14800 resistance range and if the index crosses and sustains above this level then may reach 14975 – 15000 range.
On the contrary, a downward moment may drag the index to 14475 – 14450 support range and if this support is broken then index may tank near 14275 – 14250 range.
PREDICTION ON BTCUSD 4H TFBITSTAMP:BTCUSD is currently trading inside a high-probability reversal area, which also aligns with a major Support-Resistance (SR) interchange level. This is a significant zone because it previously acted as support before turning into resistance, and from this exact region the market experienced a strong impulsive decline. The current retest suggests that sellers may once again defend this level.
The rejection around the reversal area strengthens the bearish case for the week. If this resi
NIFTY at very crucial zone!As we can see NIFTY is back at very crucial zone which is both an important supply zone and a psychological level. Since, this zone has been tested multiple times now, making it weaker hence we can expect a strong upmove if NIFTY manages to close above the given zone. Until the NIFTY can remain sideways to volatile so plan your trades accordingly and keep watching everyone.
AUDUSD getting ready for a rally?After a decline of 5.6% that we saw form 6th may 2026 to 30th June 2026, price has formed a bottoming formation at a strong Support, from where it has seen bounce backs earlier, after the breakout of the bearish trendline and sustaining comfortably above the neckline we might expect a good rally from the current levels.
Important levels:
0.6921 is an immediate support and below it 0.6883 can act as strong support. where as no any significant resistance is seen below 0.7041.
Structurally AUDUSD
Nifty Intraday Analysis for 06th July 2026NSE:NIFTY
The uptrend is expected to continue; therefore, any gap-down opening will be seen as a fresh entry opportunity.
The upward movement may lead to 24500 – 24550 resistance range and if the index crosses and sustains above this level then may reach near 24750 – 24800 range.
On the contrary, a downward moment may drag the Index to 24050 – 24000 support range in downward momentum and if this support is broken then index may tank near 23800 – 23750 range.
Banknifty Intraday Analysis for 06th July 2026NSE:BANKNIFTY
The uptrend is expected to continue; therefore, any gap-down opening will be seen as a fresh entry opportunity.
The upward moment may lead the Index to 58600 – 58700 resistance range in upward momentum and if the index crosses and sustains above this level then may reach near 59400 – 59500 range.
On the contrary, a downward moment may drag the Index to 57200 – 57100 support range in downward momentum and if this support is broken then the index may tank near the 56400 – 56300
Finnifty Intraday Analysis for 06th July 2026NSE:CNXFINANCE
The uptrend is expected to continue; therefore, any gap-down opening will be seen as a fresh entry opportunity.
The upward movement may lead the Index to 27100 - 27150 resistance range and if the index crosses and sustains above this level then may reach near 27400 - 27450 range.
On the contrary, a downward moment may drag the to 26600 – 26550 support range and if this support too is broken then index may tank near 26300 – 26250 range.
Midnifty Intraday Analysis for 0 6th July 2026NSE:NIFTY_MID_SELECT
The uptrend is expected to continue; therefore, any gap-down opening will be seen as a fresh entry opportunity.
The upward movement may lead the Index near 14700 – 14725 resistance range and if the index crosses and sustains above this level then may reach 14900 – 14925 range.
On the contrary, a downward moment may drag the index to 14400 – 14375 support range and if this support is broken then index may tank near 14200 – 14175 range.
Nifty50 View for Tomorrow | Tuesday, 7 July📊 NIFTY – 2H Chart Analysis
• Price is trading just below the 24,500–24,600 supply zone.
• Rejection has started, but 24,370 is the key level to watch.
• As long as price holds above 24,370, the structure remains stable.
• A decisive break below 24,370 can trigger fresh selling pressure.
• Until then, avoid aggressive trades inside this zone.
🎯 Wait for confirmation. React to price, don't predict it.
NIFTY WEEKLY EXP. Level Analysis for 07th Jul 2026🔕 SGMN SplD BULLISH Above => 24489.
🔕 SGMN SplD Bearish BELOW => 24375.
Mentioned analysis based on 2 consecutive candle close in 15 min Time Frame.
━━━━━🟥🟧🟨🟩🟦🟪⬛━━━━━
💥Level Interpretation / description:
✍🏻L#1: If the candle crossed & stays above the “Buy Gen”, it is treated / considered as Bullish bias. Cfm=> Confirmation.
L#2: Possibility / Probability of REVERSAL near 🔕RL/TF1 & 🔔RL/TF2
L#3: If the candle stays above “Sell Gen” but below “Buy Gen”, it is treated / considered as Side
NIFTY must close above 24500 for stronger upmove!!As we can see despite the break NIFTY opened with a gap ruining the structure due to which no continuation of upmove was seen. Now that we have close above the structure, we can expect NIFTY to stay bullish but we still have a major resistance and supply zone around 24500 levels which is also a psychological level. Hence as long as we can below that level we can expect NIFTY to remain volatile unless it closes above confirming the upmove so plan your trades accordingly and keep watching everyone
EURUSD Technical Analysis (15m Timeframe) — Bullish📊 EURUSD Technical Analysis (15m Timeframe) — Bullish Continuation Setup 🚀
🔍 Market Structure & Technical Overview:
Looking at the 15-minute chart of EURUSD, the market has recently shifted its character (CHOCH) to the upside, signaling a strong shift from a bearish to a bullish order flow.
Following the aggressive bullish impulse, the price entered a corrective phase, forming a descending channel/trendline to mitigate internal liquidity. Currently, the price has tapped into a key internal deman
SENSEX DAILYY/ Short Range Level Analysis: 06th Jul 2026🔕 SGMN SplD BULLISH Above => 77964.
🔕 SGMN SplD Bearish BELOW => 77572.
Mentioned analysis based on 2 consecutive candle close in 15 min Time Frame.
━━━━━🟥🟧🟨🟩🟦🟪⬛━━━━━
💥Level Interpretation / description:
✍🏻L#1: If the candle crossed & stays above the “Buy Gen”, it is treated / considered as Bullish bias. Cfm=> Confirmation.
L#2: Possibility / Probability of REVERSAL near 🔕RL/TF1 & 🔔RL/TF2
L#3: If the candle stays above “Sell Gen” but below “Buy Gen”, it is treated / considered as Side
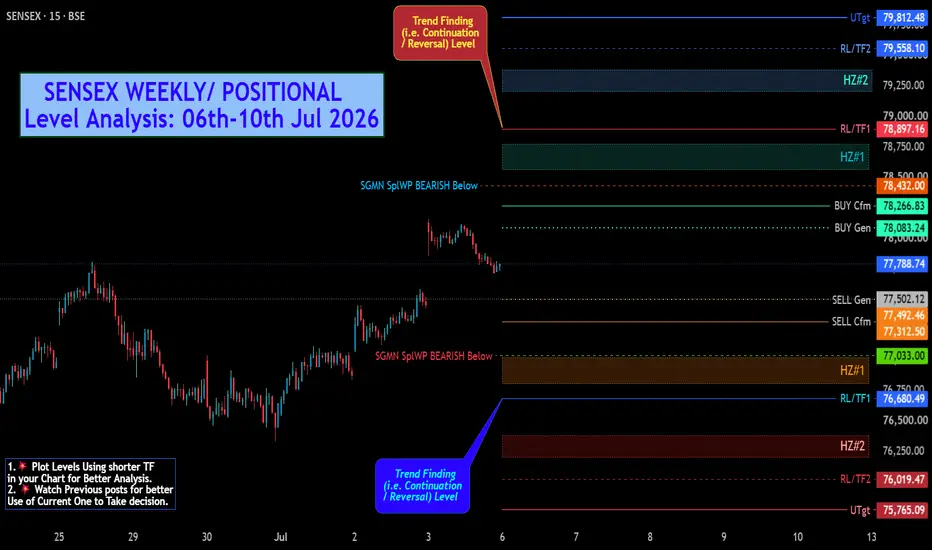
SENSEX WEEKLY/ POSITIONAL Level Analysis: 06th-10th Jul 2026🔔 SGMN SplD BULLISH Above => 78432.
🔔 SGMN SplD Bearish BELOW => 77033.
Mentioned analysis based on 2 consecutive candle close in 15 min Time Frame.
━━━━━🟥🟧🟨🟩🟦🟪⬛━━━━━
💥Level Interpretation / description:
✍🏻L#1: If the candle crossed & stays above the “Buy Gen”, it is treated / considered as Bullish bias. Cfm=> Confirmation.
L#2: Possibility / Probability of REVERSAL near 🔕RL/TF1 & 🔔RL/TF2
L#3: If the candle stays above “Sell Gen” but below “Buy Gen”, it is treated / considered as S