Banknifty Intraday Analysis for 02nd July 2026NSE:BANKNIFTY
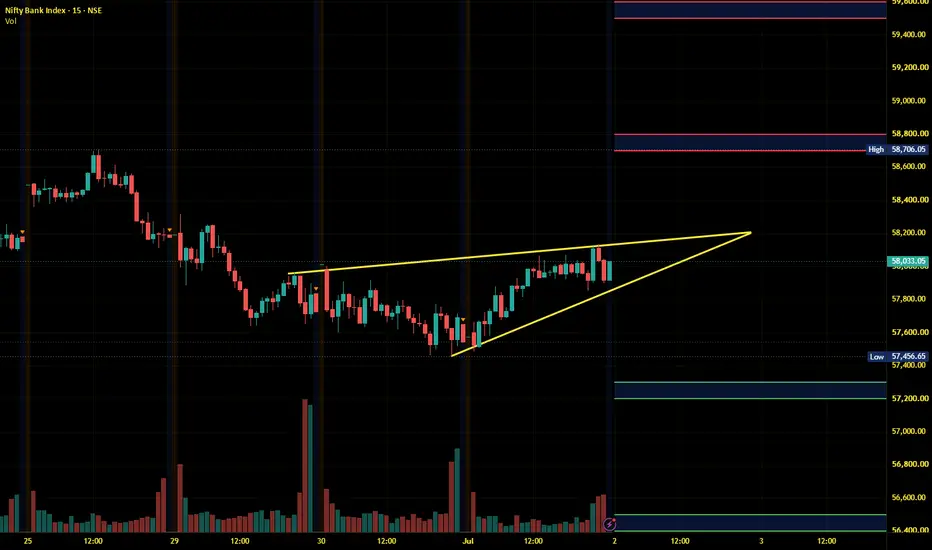
The uptrend should continue, with a reversal expected from support levels if the market drops.
The upward moment may lead the Index to 58700 – 58800 resistance range in upward momentum and if the index crosses and sustains above this level then may reach near 59500 – 59600 range.
On the contrary, a downward moment may drag the Index to 57300 – 57200 support range in downward momentum and if this support is broken then the index may tank near the 56500 – 56400 range.
Supply and Demand
Finnifty Intraday Analysis for 02nd July 2026NSE:CNXFINANCE
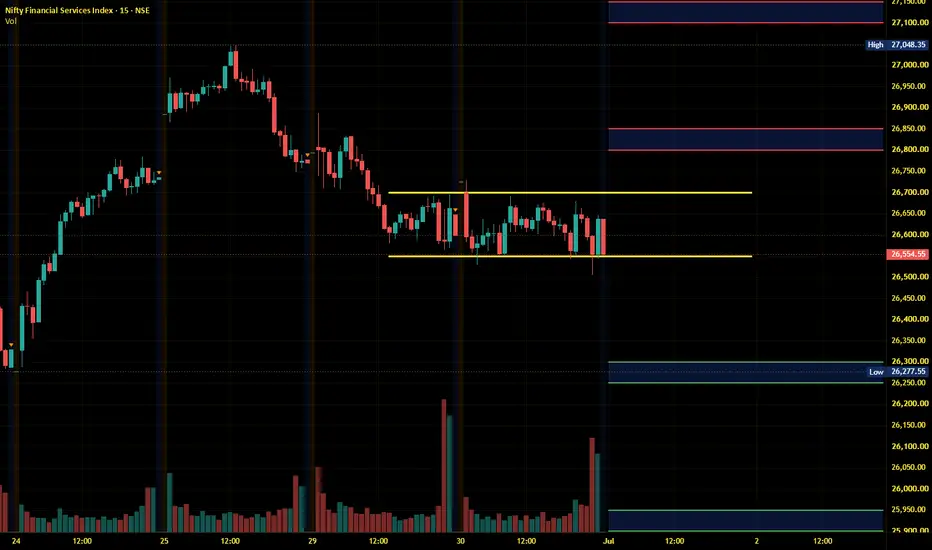
The uptrend should continue, with a reversal expected from support levels if the market drops.
The upward movement may lead the Index to 27050 - 27100 resistance range and if the index crosses and sustains above this level then may reach near 27350 - 27400 range.
On the contrary, a downward moment may drag the to 26550 – 26500 support range and if this support too is broken then index may tank near 26250 – 26200 range.
Midnifty Intraday Analysis for 02nd July 2026NSE:NIFTY_MID_SELECT
The uptrend should continue, with a reversal expected from support levels if the market drops.
The upward movement may lead the Index near 14700 – 14725 resistance range and if the index crosses and sustains above this level then may reach 14900 – 14925 range.
On the contrary, a downward moment may drag the index to 14400 – 14375 support range and if this support is broken then index may tank near 14200 – 14175 range.
5Paisa Capital: Multi-Year C Curve Formation5Paisa Capital: Multi-Year C Curve Formation | Positional Setup 📈
5Paisa Capital appears to be forming a large multi-year rounding bottom (Cup pattern/C Curve) after a prolonged correction from 2024 highs.
Key Observations:
• Price has spent nearly 2+ years in accumulation, creating a strong base.
• The right side of the cup is now developing with improving momentum.
• Major resistance / neckline lies in the 384–426 zone.
This zone is critical — a decisive breakout with volume can trigger th
NIFTY must break and close above either of the trendlineAs we can see NIFTY reversed as expected because of the trendline support below. Now that we between the two important trendline support and resistance, we may see NIFTY showing a strong breakout or breakdown on the break of either of the trendline. We must keep a close watch the movement could be quick which could be unidirectional so keep watching and plan your trades accordingly.
IGB 10Y Monthly UpdateIGB 10Y has seen one of the biggest rallies in recent years, moving about 25 bps in May (around 39 bps from its recent high of 7.14%). MPC commentary and policy measures to attract foreign capital—such as concessional forex swaps for raising ECBs by PSUs and full hedging-cost benefits to AD banks for raising FCNR(B) deposits—have raised hopes of stronger foreign currency reserves (expected inflows of roughly $75 billion), and bond yields responded positively. In addition, tax benefits announced
SENSEX DAILY/ Short Range Level Analysis for 02nd Jul 2026🔕 SGMN SplD BULLISH Above => 77105.
🔕 SGMN SplD Bearish BELOW => 76749.
Mentioned analysis based on 2 consecutive candle close in 15 min Time Frame.
━━━━━🟥🟧🟨🟩🟦🟪⬛━━━━━
💥Level Interpretation / description:
✍🏻L#1: If the candle crossed & stays above the “Buy Gen”, it is treated / considered as Bullish bias. Cfm=> Confirmation.
L#2: Possibility / Probability of REVERSAL near 🔕RL/TF1 & 🔔RL/TF2
L#3: If the candle stays above “Sell Gen” but below “Buy Gen”, it is treated / considered as S
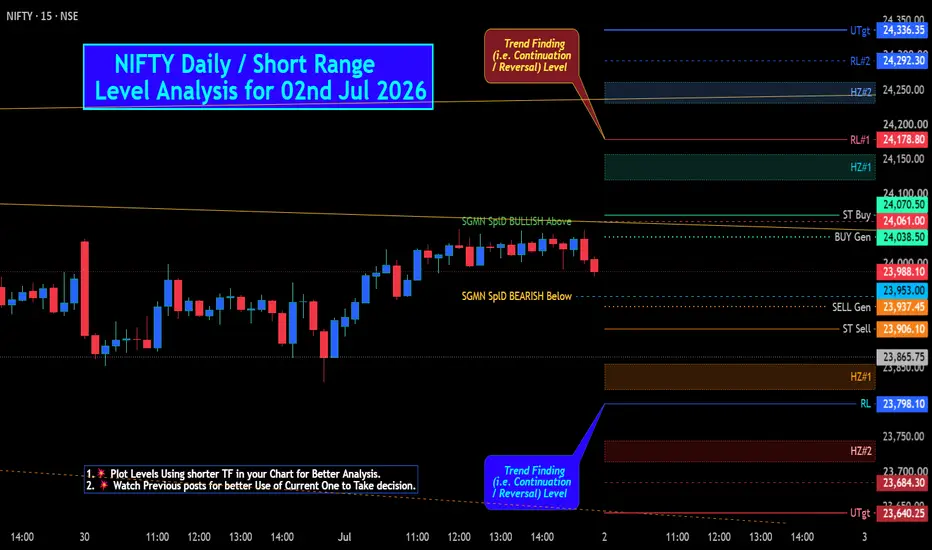
NIFTY Daily / Short Range Level Analysis for 02nd Jul 2026.🔕 SGMN SplD BULLISH Above => 24061.
🔕 SGMN SplD Bearish BELOW => 23953.
Mentioned analysis based on 2 consecutive candle close in 15 min Time Fr ame.
━━━━━🟥🟧🟨🟩🟦🟪⬛━━━━━
💥Level Interpretation / description:
✍🏻L#1: If the candle crossed & stays above the “Buy Gen”, it is treated / considered as Bullish bias. Cfm=> Confirmation.
L#2: Possibility / Probability of REVERSAL near 🔕RL/TF1 & 🔔RL/TF2
L#3: If the candle stays above “Sell Gen” but below “Buy Gen”, it is treated / considered as S
Nifty50 View for Tomorrow | 02 July📊 NIFTY – 2H CHART ANALYSIS
CMP: 23,988
• The sharp recovery has slowed down. • Price is now moving inside a consolidation zone (23,800–24,250). • Buyers are holding the range, but they still haven't broken the upper boundary.
🟢 Bullish View
A sustained move above 24,250 can attract fresh buying.
If that happens, the next target is 24,500–24,600.
🔴 Bearish View
If 23,800 breaks on a closing basis, the range will fail.
That can lead to a move back towards 23,600–23,500.
My View
Right
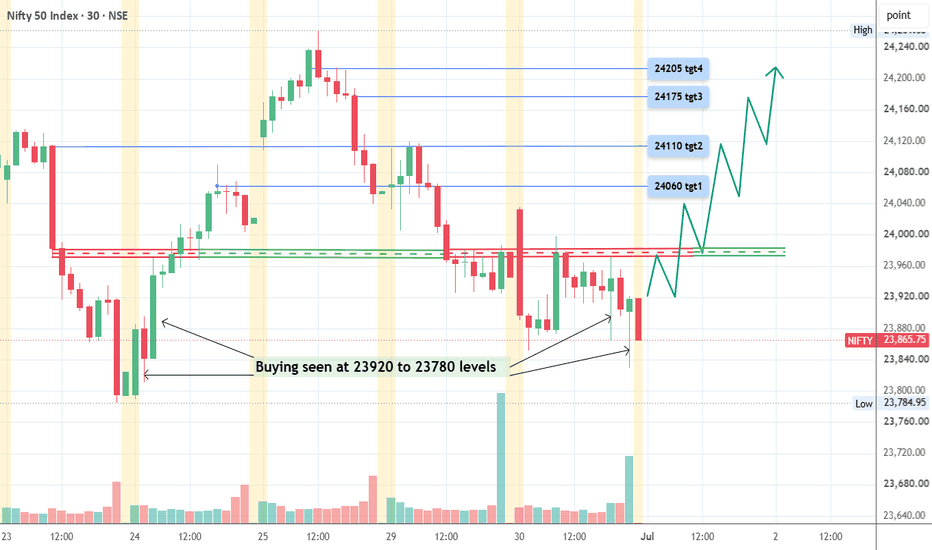
Nifty Intraday Analysis for 01st July 2026NSE:NIFTY
Market is expected to bounce on at the start of July '2026 Month F&O contract.
The upward movement may lead to 24100 – 24150 resistance range and if the index crosses and sustains above this level then may reach near 24350 – 24400 range.
On the contrary, a downward moment may drag the Index to 23650 – 23600 support range in downward momentum and if this support is broken then index may tank near 23400 – 23350 range.
Banknifty Intraday Analysis for 01st July 2026NSE:BANKNIFTY
Market is expected to bounce on at the start of July '2026 Month F&O contract.
The upward moment may lead the Index to 58250 – 58350 resistance range in upward momentum and if the index crosses and sustains above this level then may reach near 59050 – 59150 range.
On the contrary, a downward moment may drag the Index to 56850 – 56750 support range in downward momentum and if this support is broken then the index may tank near the 56050 – 55950 range.
Finnifty Intraday Analysis for 01st July 2026NSE:CNXFINANCE
Market is expected to bounce on at the start of July '2026 Month F&O contract.
The upward movement may lead the Index to 26800 - 26850 resistance range and if the index crosses and sustains above this level then may reach near 27100 - 27150 range.
On the contrary, a downward moment may drag the to 26300 – 26250 support range and if this support too is broken then index may tank near 25950 – 25900 range.
Midnifty Intraday Analysis for 01st July 2026NSE:NIFTY_MID_SELECT
Market is expected to bounce on at the start of July '2026 Month F&O contract.
The upward movement may lead the Index near 14600 – 14625 resistance range and if the index crosses and sustains above this level then may reach 14800 – 14825 range.
On the contrary, a downward moment may drag the index to 14300 – 14275 support range and if this support is broken then index may tank near 14100 – 14075 range.
Gold (XAUUSD) outlook & trade setup for 01-07-2026
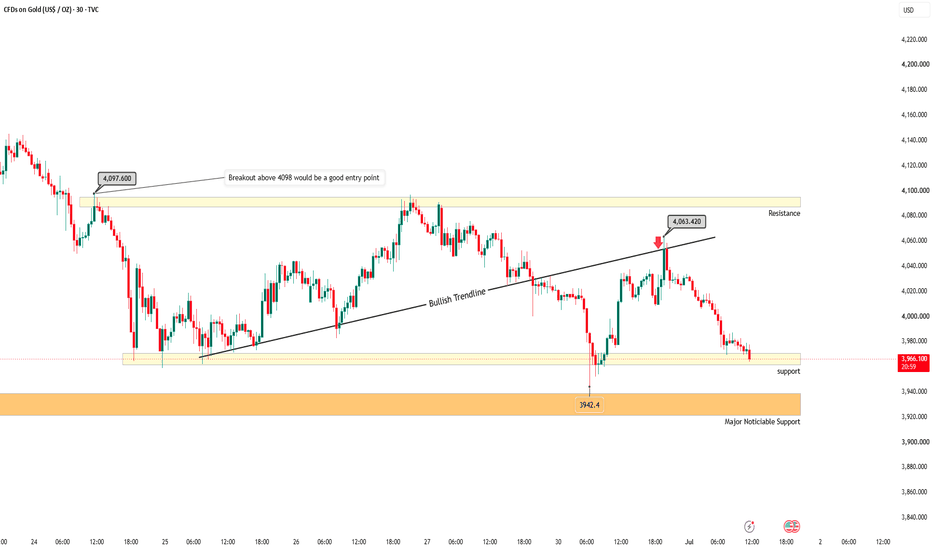
Gold is consolidating in a side way direction form last 6 trading sessions, and has shown multiple bounce backs form the support zone of ~3960, and has seen bearish pressure at 4097 levels, bullish trendline within the range, which was acting as support earlier has rejected an up-move after price had broken below it (marked by red arrow), overall trends is bearish, price might see a bounce back form the current support levels after a consolidation, but only if price breaks below the consolidati
Nifty Intraday Analysis for 30th June 2026NSE:NIFTY
High volatility with swing on either side expected on NSE F&O expiry day.
The upward movement may lead to 24150 – 24200 resistance range and if the index crosses and sustains above this level then may reach near 24400 – 24450 range.
On the contrary, a downward moment may drag the Index to 23750 – 23700 support range in downward momentum and if this support is broken then index may tank near 23500 – 23450 range.
Banknifty Intraday Analysis for 30th June 2026NSE:BANKNIFTY
High volatility with swing on either side expected on NSE F&O expiry day.
The upward moment may lead the Index to 58400 – 58500 resistance range in upward momentum and if the index crosses and sustains above this level then may reach near 59200 – 59300 range.
On the contrary, a downward moment may drag the Index to 57000 – 56900 support range in downward momentum and if this support is broken then the index may tank near the 56200 – 56100 range.
Finnifty Intraday Analysis for 30th June 2026NSE:CNXFINANCE
High volatility with swing on either side expected on NSE F&O expiry day.
The upward movement may lead the Index to 26850 - 26900 resistance range and if the index crosses and sustains above this level then may reach near 27150 - 27200 range.
On the contrary, a downward moment may drag the to 26350 – 26300 support range and if this support too is broken then index may tank near 26000 – 25950 range.
Midnifty Intraday Analysis for 30th June 2026NSE:NIFTY_MID_SELECT
High volatility with swing on either side expected on NSE F&O expiry day.
The upward movement may lead the Index near 14525 – 14550 resistance range and if the index crosses and sustains above this level then may reach 14725 – 14750 range.
On the contrary, a downward moment may drag the index to 14225 – 14200 support range and if this support is broken then index may tank near 14050 – 14025 range.
NIFTY Daily / Short Range Level Analysis for 01st Jul 2026🔕 SGMN SplD BULLISH Above => 23921.
🔕 SGMN SplD Bearish BELOW => 23814.
Mentioned analysis based on 2 consecutive candle close in 15 min Time Frame.
━━━━━🟥🟧🟨🟩🟦🟪⬛━━━━━
💥Level Interpretation / description:
✍🏻L#1: If the candle crossed & stays above the “Buy Gen”, it is treated / considered as Bullish bias. Cfm=> Confirmation.
L#2: Possibility / Probability of REVERSAL near 🔕RL/TF1 & 🔔RL/TF2
L#3: If the candle stays above “Sell Gen” but below “Buy Gen”, it is treated / considered as S
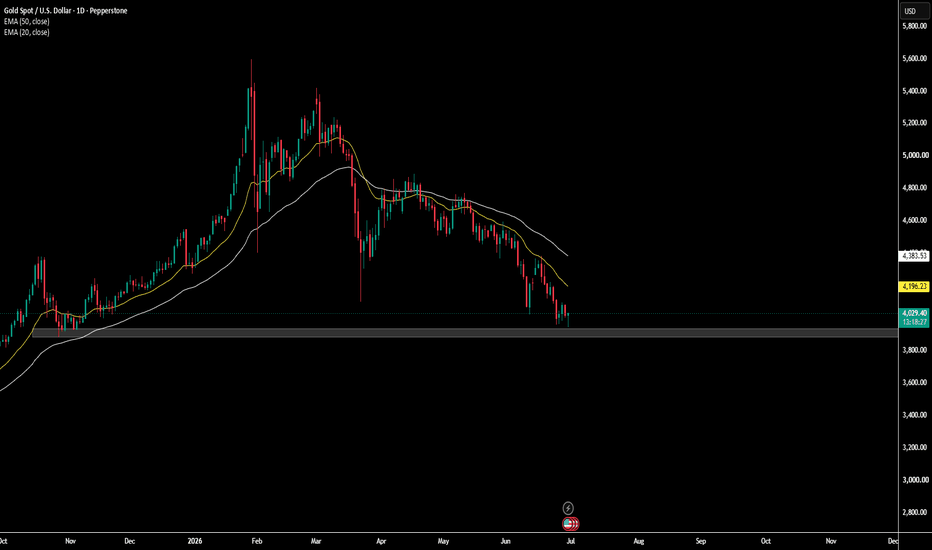
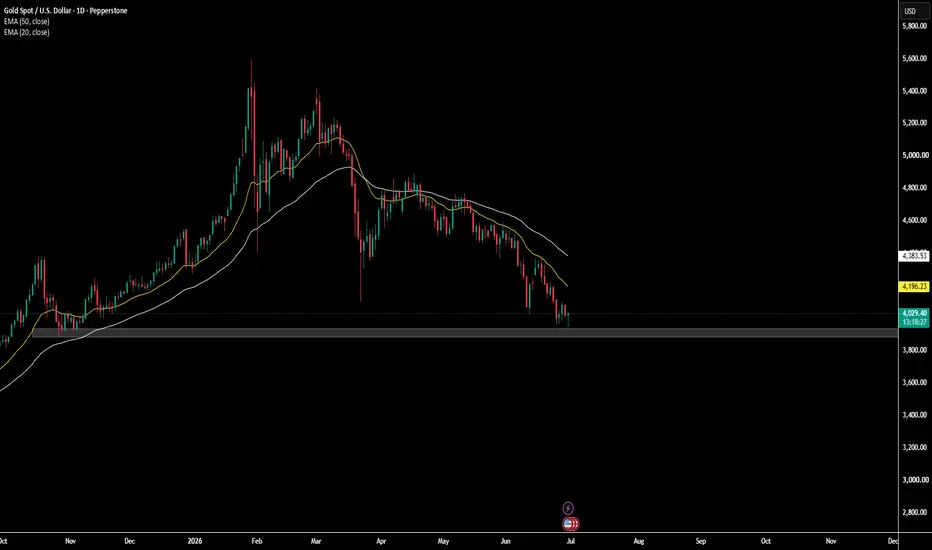
XAUUSD (Gold) — Daily | At Major Support After Record Quarterly Price: ~$4,030 | ATH: $5,602 (Jan 29, 2026) | Down ~14% this quarter — steepest on record.
Gold is sitting right at a key zone: the bottom of a falling channel + a horizontal demand area ($3,900–$3,950). This is the first real test of that zone since price broke above it last year.
Bullish case
Strong support confluence at $3,900–3,950 (channel + demand zone)
Big drop = oversold, bounce is likely even in a downtrend
Central banks + physical buyers still accumulating gold
US-Iran tension is pau
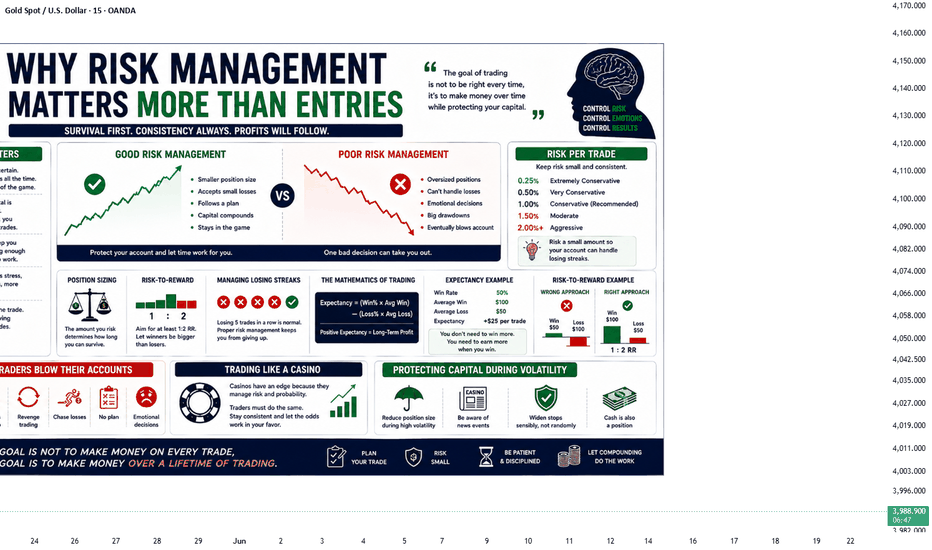
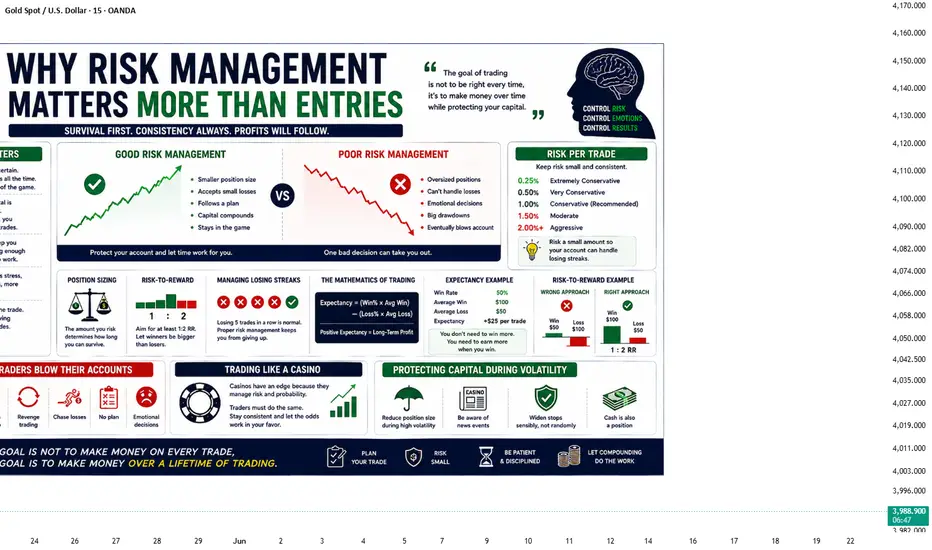
Risk Management Ask a group of traders what separates successful traders from unsuccessful ones, and many will mention strategy.
Some believe the answer is finding the perfect indicator.
Others search endlessly for the best chart pattern or the highest win-rate trading system.
While these things have value, they are not what determines long-term success.
The truth is much simpler.
A great entry cannot save poor risk management, but good risk management can survive imperfect entries.
This is one of the mos
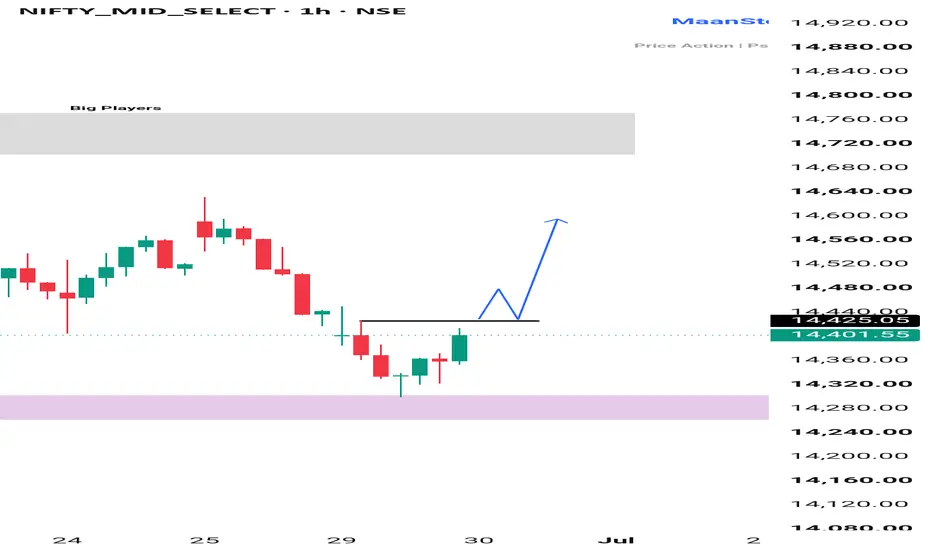
MIDCAP NIFTY ANALYSIS FOR TUESDAY 📊 MIDCAP NIFTY – Monthly Expiry Outlook (30 June)
CMP: 14,402
🔹 Midcap Nifty has bounced from the 14,280–14,320 demand zone. The next move depends on whether buyers can reclaim the breakout level.
Bullish View 🟢
• Demand zone should continue to hold.
• A break and hourly close above 14,425 can attract fresh buying.
• Upside targets: 14,550–14,600.
Bearish View 🔴
• If 14,280 breaks on a closing basis, the structure turns weak.
• Downside targets: 14,200–14,100.
⚠️ Expiry Reminder:
Midcap can