NIFTY Daily / Short Range Level Analysis for 01st Jul 2026🔕 SGMN SplD BULLISH Above => 23921.
🔕 SGMN SplD Bearish BELOW => 23814.
Mentioned analysis based on 2 consecutive candle close in 15 min Time Frame.
━━━━━🟥🟧🟨🟩🟦🟪⬛━━━━━
💥Level Interpretation / description:
✍🏻L#1: If the candle crossed & stays above the “Buy Gen”, it is treated / considered as Bullish bias. Cfm=> Confirmation.
L#2: Possibility / Probability of REVERSAL near 🔕RL/TF1 & 🔔RL/TF2
L#3: If the candle stays above “Sell Gen” but below “Buy Gen”, it is treated / considered as S
Supply and Demand
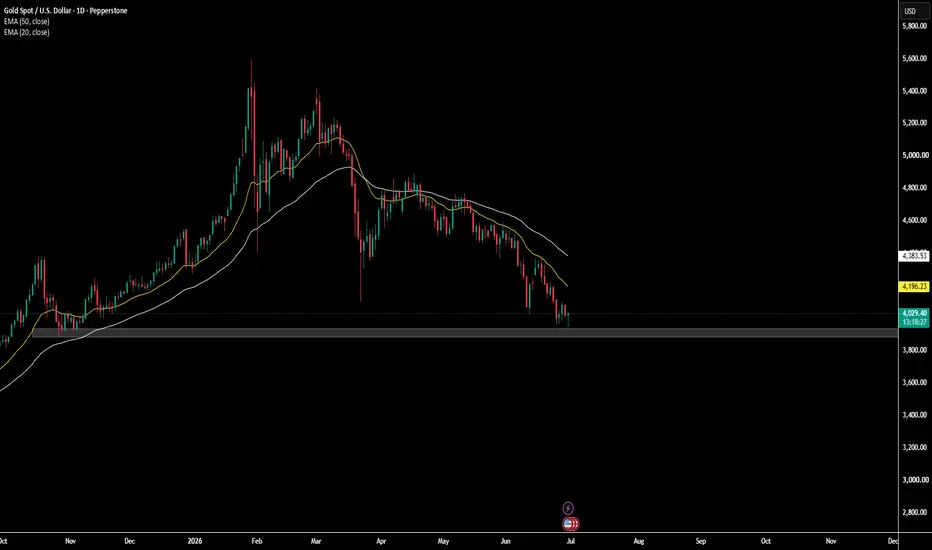
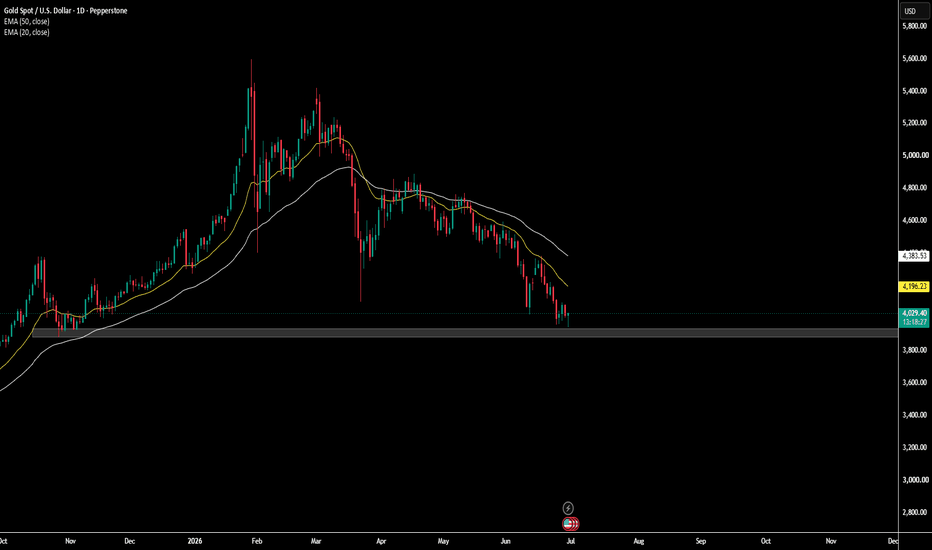
XAUUSD (Gold) — Daily | At Major Support After Record Quarterly Price: ~$4,030 | ATH: $5,602 (Jan 29, 2026) | Down ~14% this quarter — steepest on record.
Gold is sitting right at a key zone: the bottom of a falling channel + a horizontal demand area ($3,900–$3,950). This is the first real test of that zone since price broke above it last year.
Bullish case
Strong support confluence at $3,900–3,950 (channel + demand zone)
Big drop = oversold, bounce is likely even in a downtrend
Central banks + physical buyers still accumulating gold
US-Iran tension is pau
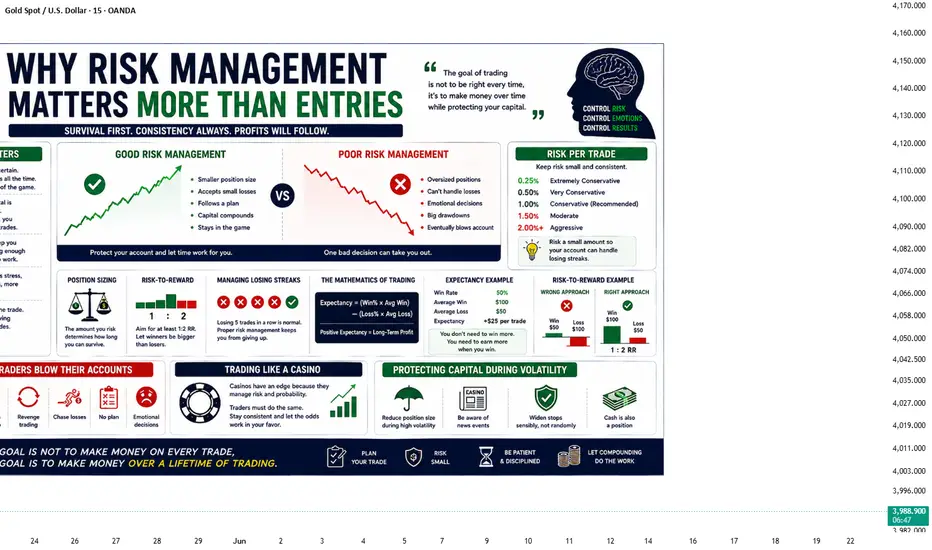
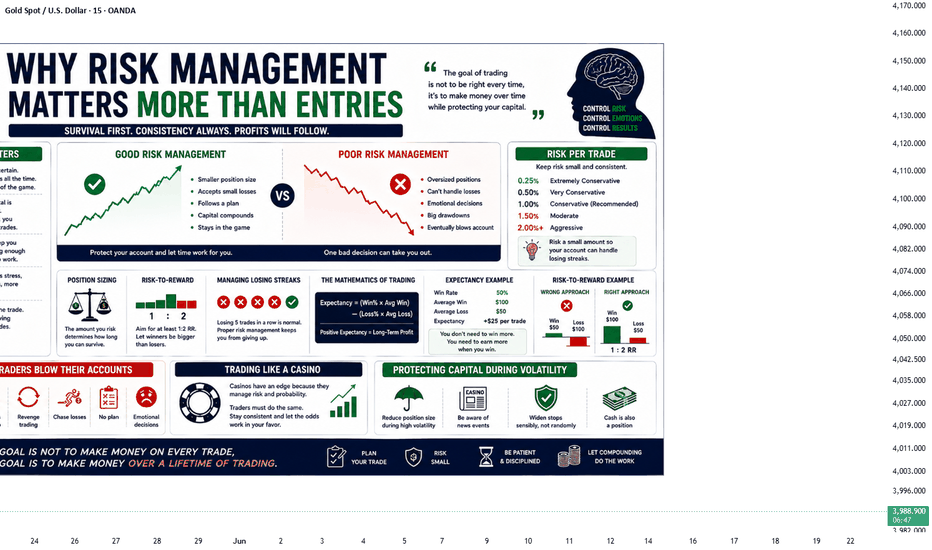
Risk Management Ask a group of traders what separates successful traders from unsuccessful ones, and many will mention strategy.
Some believe the answer is finding the perfect indicator.
Others search endlessly for the best chart pattern or the highest win-rate trading system.
While these things have value, they are not what determines long-term success.
The truth is much simpler.
A great entry cannot save poor risk management, but good risk management can survive imperfect entries.
This is one of the mos
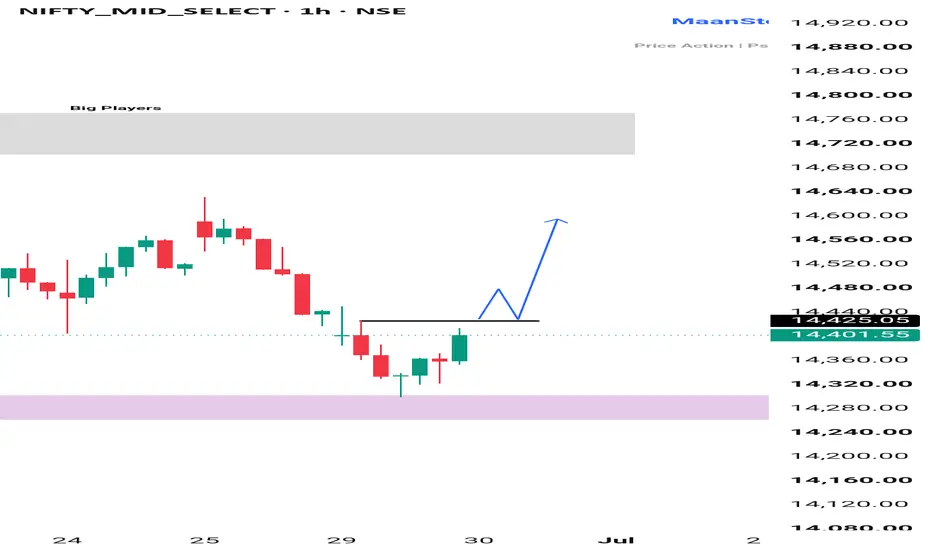
MIDCAP NIFTY ANALYSIS FOR TUESDAY 📊 MIDCAP NIFTY – Monthly Expiry Outlook (30 June)
CMP: 14,402
🔹 Midcap Nifty has bounced from the 14,280–14,320 demand zone. The next move depends on whether buyers can reclaim the breakout level.
Bullish View 🟢
• Demand zone should continue to hold.
• A break and hourly close above 14,425 can attract fresh buying.
• Upside targets: 14,550–14,600.
Bearish View 🔴
• If 14,280 breaks on a closing basis, the structure turns weak.
• Downside targets: 14,200–14,100.
⚠️ Expiry Reminder:
Midcap can
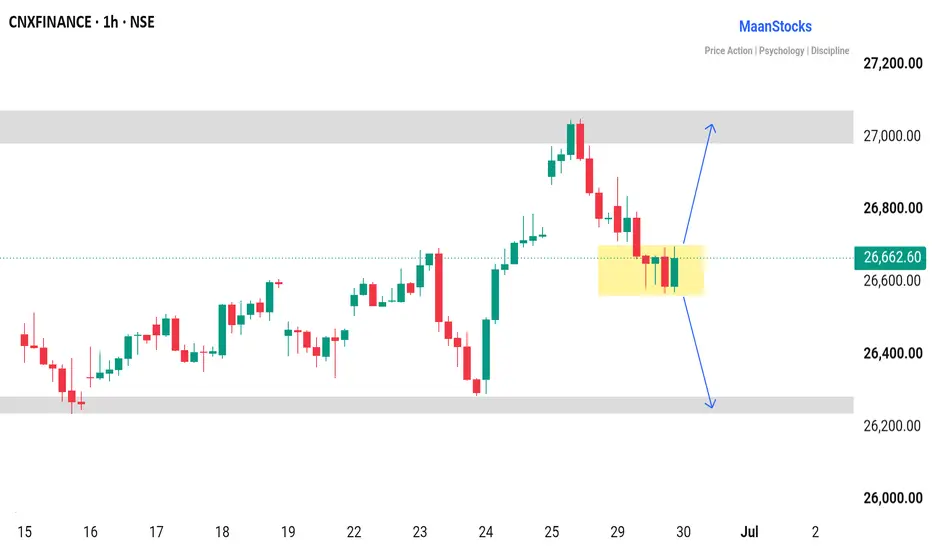
FINNIFTY VIEW FOR 30 JUNE🏦 FINNIFTY – Monthly Expiry Outlook (30 June)
CMP: 26,663
🔹 FINNIFTY is consolidating inside the 26,550–26,750 zone. Tomorrow's expiry move will likely begin after price breaks this range.
Bullish View 🟢
• Hold above the consolidation zone.
• A breakout and sustained move above 27,100 can trigger fresh buying.
• Upside targets: 27,300–27,500.
Bearish View 🔴
• A breakdown below 26,550 will weaken the short-term structure.
• Downside targets: 26,350–26,200.
⚠️ Expiry Reminder:
Avoid trading i
NIFTY might get rejected from the trendline again!As we can see NIFTY got rejected exactly from our trendline and falling ever since. Now that we are around the small trendline support we can expect a rejection. But if it breaks below, we may see a sharper fall so plan your trades accordingly and keep watching these levels everyone.
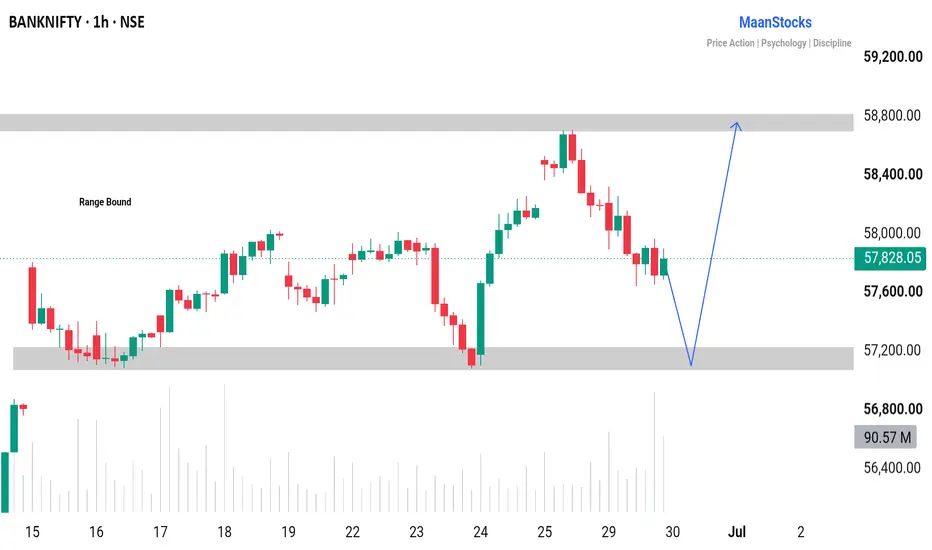
BANKNIFTY – Monthly Expiry Outlook for Tomorrow (30 June)🏦 BANKNIFTY – Monthly Expiry Outlook (30 June)
CMP: 57,828
🔹 Bank Nifty is trading inside a broad range. Tomorrow's move will depend on how price reacts near support.
Bullish View 🟢
• Strong support lies at 56,900–57,100.
• If this zone holds and buyers step in, expect a move back towards 58,800–59,000.
• A breakout and hold above 59,000 can extend the rally towards 59,300–59,500.
Bearish View 🔴
• A close below 56,900 will weaken the structure.
• Downside targets: 56,500–56,200.
⚠️ Expiry R
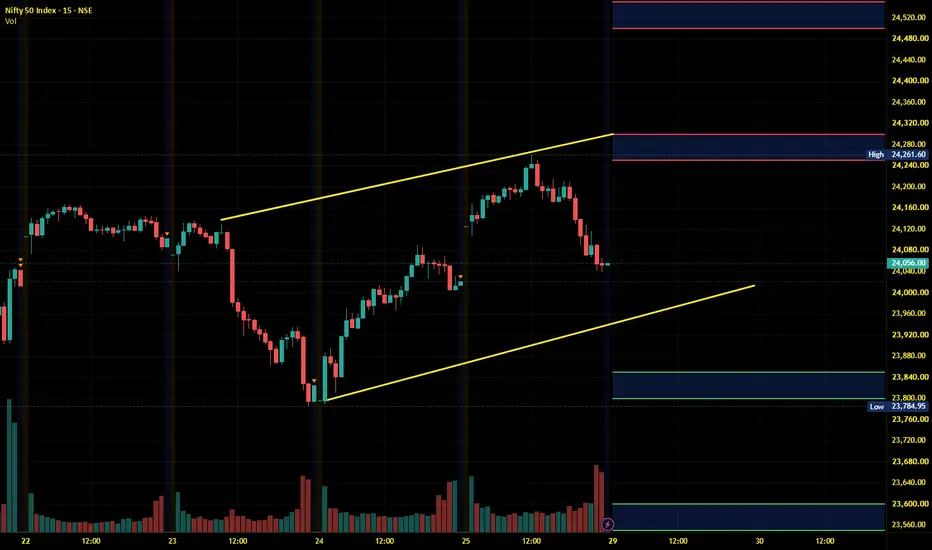
Nifty Intraday Analysis for 29th June 2026NSE:NIFTY
High volatility and a negative opening are expected due to global market turmoil and the upcoming F&O expiry on the NSE on 30th June.
The upward movement may lead to 24250 – 24300 resistance range and if the index crosses and sustains above this level then may reach near 24500 – 24550 range.
On the contrary, a downward moment may drag the Index to 23850 – 23800 support range in downward momentum and if this support is broken then index may tank near 23600 – 23550 range.
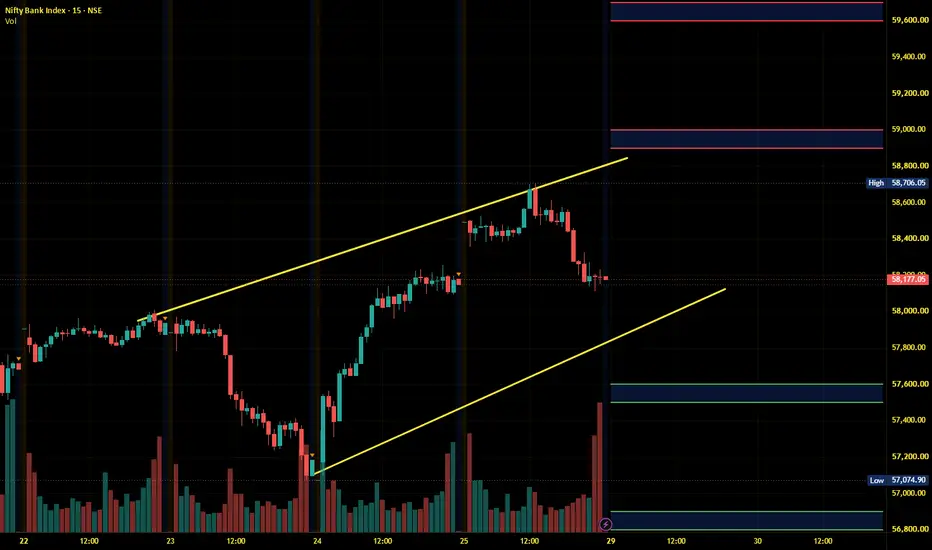
Banknifty Intraday Analysis for 29th June 2026NSE:BANKNIFTY
High volatility and a negative opening are expected due to global market turmoil and the upcoming F&O expiry on the NSE on 30th June.
The upward moment may lead the Index to 58900 – 59000 resistance range in upward momentum and if the index crosses and sustains above this level then may reach near 59600 – 59700 range.
On the contrary, a downward moment may drag the Index to 57600 – 57500 support range in downward momentum and if this support is broken then the index may tank n
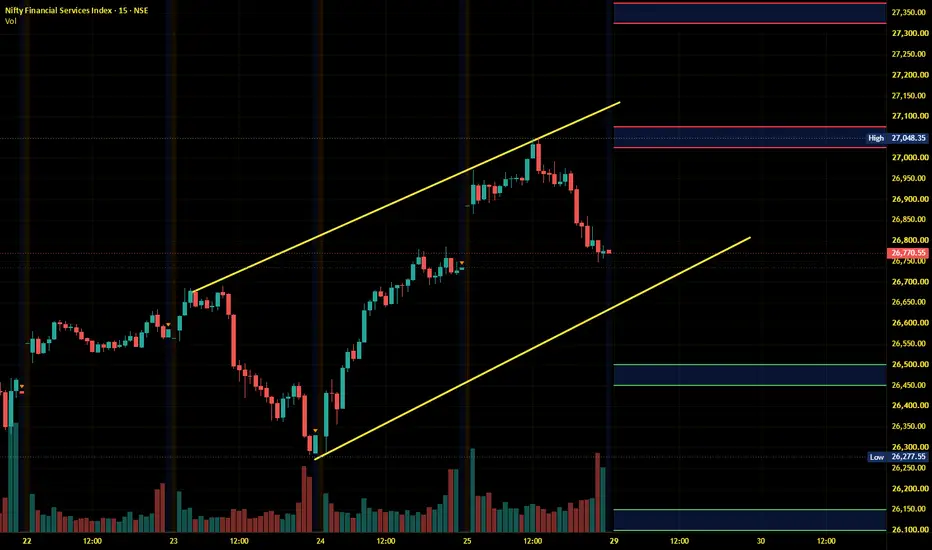
Finnifty Intraday Analysis for 29th June 2026NSE:CNXFINANCE
High volatility and a negative opening are expected due to global market turmoil and the upcoming F&O expiry on the NSE on 30th June.
The upward movement may lead the Index to 27025 - 27075 resistance range and if the index crosses and sustains above this level then may reach near 27325 - 27375 range.
On the contrary, a downward moment may drag the to 26500 – 26450 support range and if this support too is broken then index may tank near 26150 – 26100 range.
Midnifty Intraday Analysis for 29th June 2026NSE:NIFTY_MID_SELECT
High volatility and a negative opening are expected due to global market turmoil and the upcoming F&O expiry on the NSE on 30th June.
The upward movement may lead the Index near 14600 – 14625 resistance range and if the index crosses and sustains above this level then may reach 14800 – 14825 range.
On the contrary, a downward moment may drag the index to 14300 – 14275 support range and if this support is broken then index may tank near 14125 – 14100 range.
BANKNIFTY MONTHLY Exp. Level Analysis for 30th Jun 2026.🔕 SGMN SplD BULLISH Above => 57943.
🔕 SGMN SplD Bearish BELOW => 57522.
Mentioned analysis based on 2 consecutive candle close in 15 min Time Frame.
━━━━━🟥🟧🟨🟩🟦🟪⬛━━━━━
💥Level Interpretation / description:
✍🏻L#1: If the candle crossed & stays above the “Buy Gen”, it is treated / considered as Bullish bias. Cfm=> Confirmation.
L#2: Possibility / Probability of REVERSAL near 🔕RL/TF1 & 🔔RL/TF2
L#3: If the candle stays above “Sell Gen” but below “Buy Gen”, it is treated / considered as Side
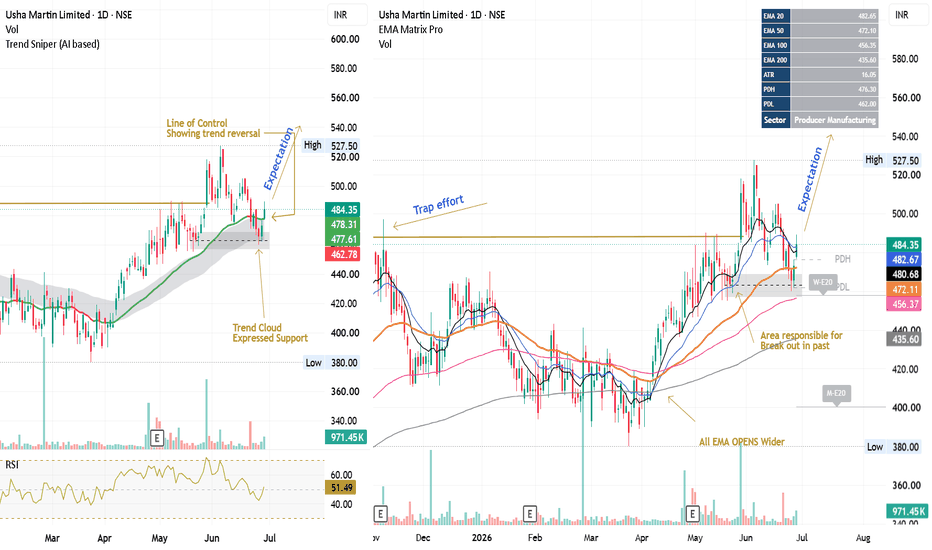
USHAMART : Trend + EMA ConfluenceNSE:USHAMART
Every chart tells a story… and USHAMARTIN is currently showing a phase where price, structure and moving averages are communicating the same message . On the daily timeframe, the stock has already created a strong expansion move from the accumulation zone and delivered a breakout from the previous consolidation area.
Key Observations:
Price is supported by Trend Cloud and LOC + RSI moved in above 50 (Left chart Image)
Price reacted from area responsible for last Breakout
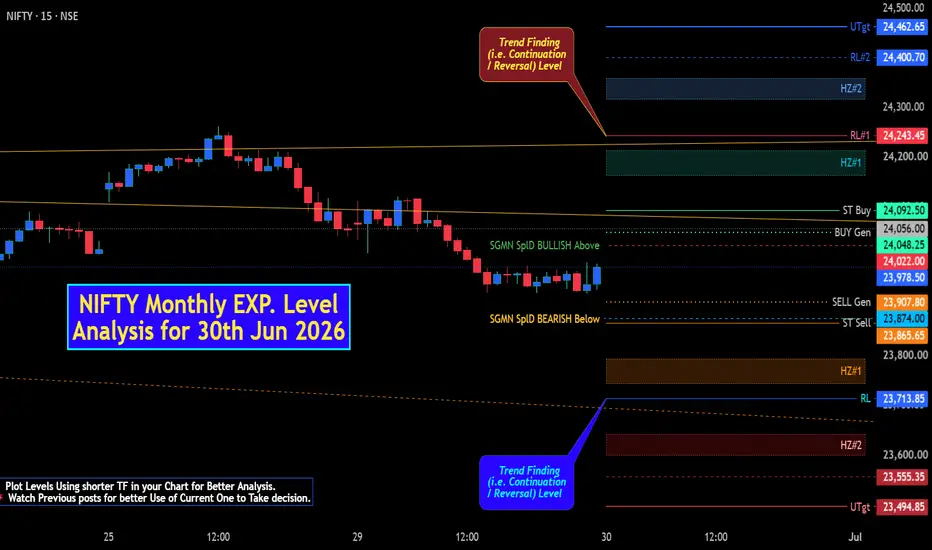
NIFTY Monthly EXP. Level Analysis for 30th Jun 2026🔕 SGMN SplD BULLISH Above => 24022.
🔕 SGMN SplD Bearish BELOW => 23874.
Mentioned analysis based on 2 consecutive candle close in 15 min Time Frame.
━━━━━🟥🟧🟨🟩🟦🟪⬛━━━━━
💥Level Interpretation / description:
✍🏻L#1: If the candle crossed & stays above the “Buy Gen”, it is treated / considered as Bullish bias. Cfm=> Confirmation.
L#2: Possibility / Probability of REVERSAL near 🔕RL/TF1 & 🔔RL/TF2
L#3: If the candle stays above “Sell Gen” but below “Buy Gen”, it is treated / considered as Side
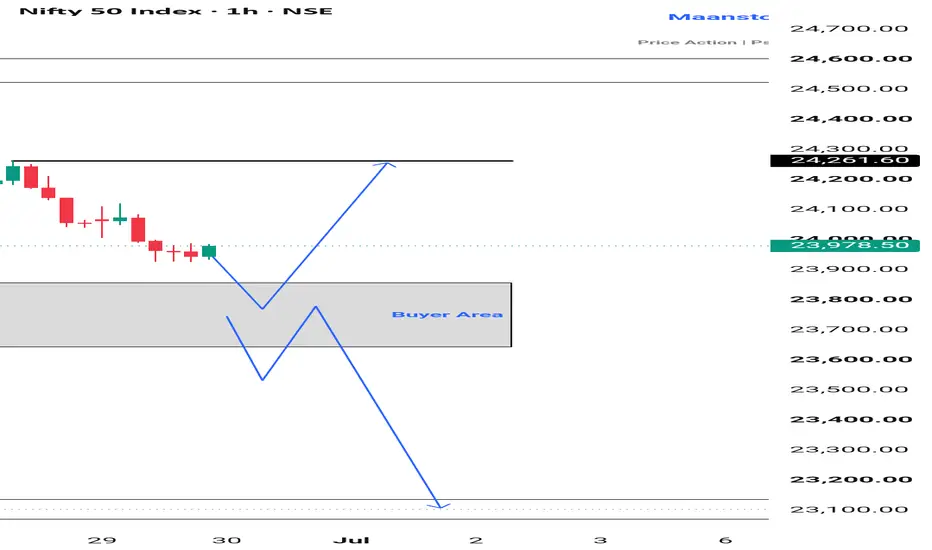
Nifty50 monthly expiry setup for tomorrow 📊 NIFTY 50 – 1H CHART ANALYSIS
CMP: 23,944
• Nifty is trading inside the 23,700–23,850 buyer zone after a healthy pullback.
• As long as this zone holds, buyers still have a chance to regain control.
• Immediate hurdle is 24,261. A clean breakout and hourly close above this level can trigger the next move towards 24,500–24,600.
• If price keeps rejecting below 24,261, expect more sideways movement inside the current range.
• A breakdown and close below 23,700 will invalidate the bullish setup
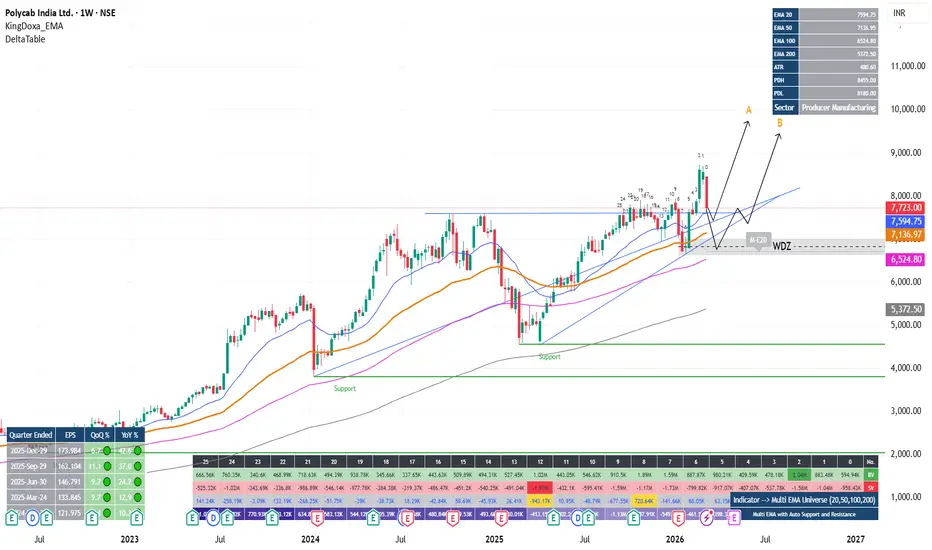
POLYCABNSE:POLYCAB
Weekly chart represent the strength of the stock.
On Weekly , stock above all major EMA validating its strength.
Nice Weekly demand zone is available around 7K which showed its strength of breakout.
Price currently returned to re-test breakout area.
On Daily , Price below EMA20 and near to EMA50 represent the pullback not a seller dominance.
Two major trendline support is also available to hold or return the price.
Two probable setups available as shown in chart.
NB:
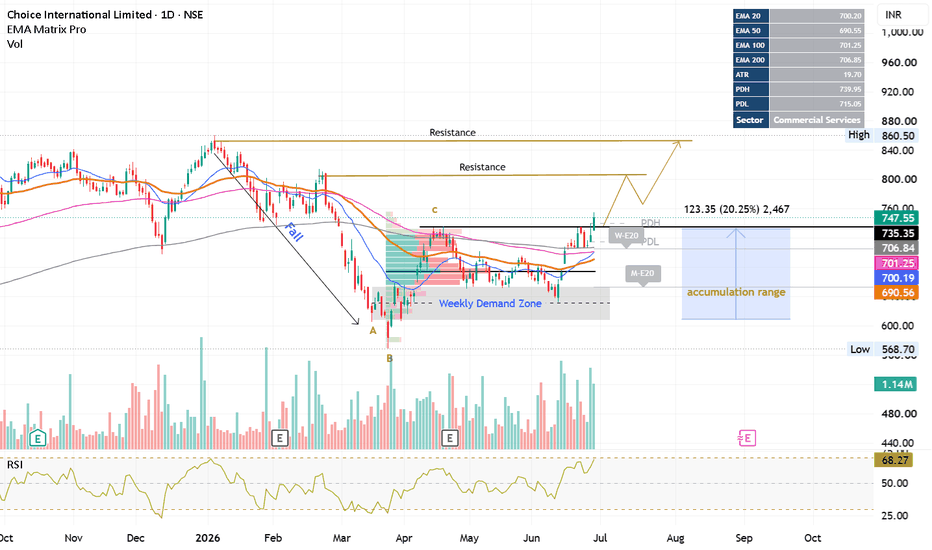
CHOICEIN : Accumulation Breakout AttemptNSE:CHOICEIN | Accumulation Breakout Attempt 🚀
Price action suggests CHOICEIN has completed a long consolidation phase after a sharp decline. The stock formed a potential accumulation structure with absorption near the ₹620–700 demand zone.
Recent price action shows:
✅ Break above EMA cluster
✅ Higher low formation
✅ Volume-backed bullish candle
✅ Momentum expansion
✅ Volume Profile also validate accumulation
Key levels to watch:
Resistance:
₹760 → ₹800 → ₹860
Support:
₹720 → ₹700 →
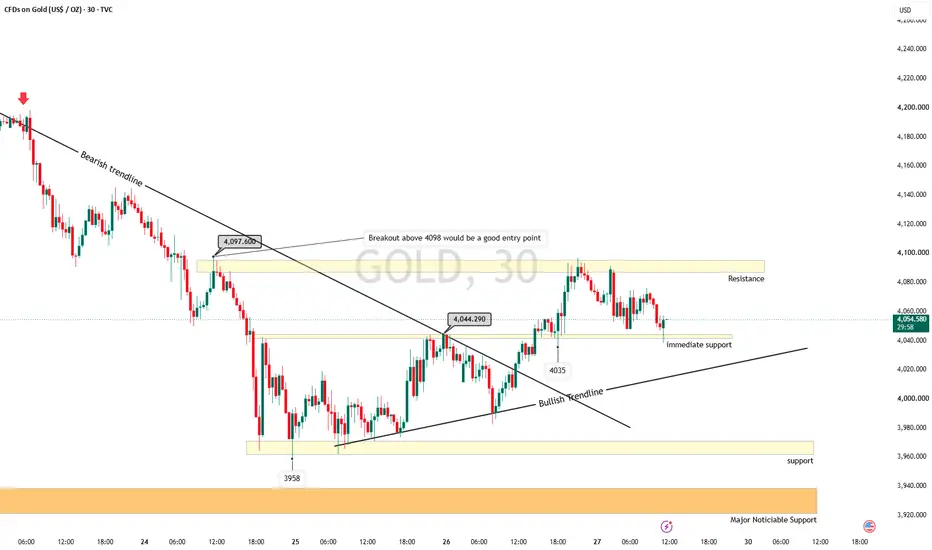
Gold Outlook and trade setup for 29th June 2026Price gave breakout above the level of 4045 on Friday & has retested the level of 4097 which is acting as an immediate resistance for the gold, if broken we can consider taking long positions, 4035 is acting as immediate support and price trying to find some strength at that level.
Trendlines should be noticed, bearish trendline broken on Friday and now it seems like price is respecting bullish trendline, price might retest the bullish trendline before showing it's continued up-move.
summary:
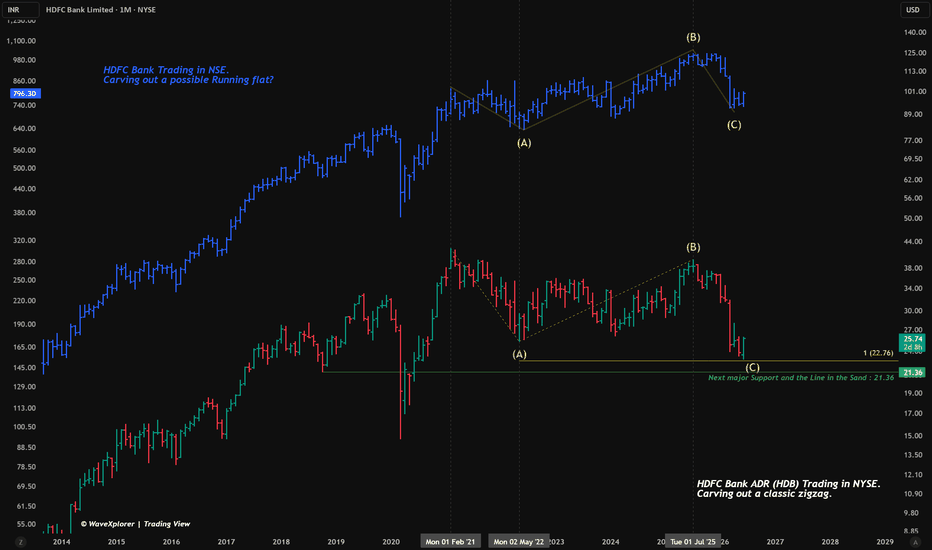
The Currency Illusion: Analyzing HDFC Bank's Macro StructureIn this video, we explore a fascinating high-timeframe technical phenomenon using a single overlay chart of HDFC Bank. We compare the NYSE-listed ADR (HDB) with the native NSE-listed ordinary shares to show how currency depreciation can distort market geometry while structural cycles remain perfectly synchronized. We also look at the current monthly candlestick behavior and alternative Elliott Wave counts like triangles and ending diagonals.
Disclaimer: I am not a SEBI-registered investment adv
NEPHROPLUS: Is This Pullback Setting Up the Next Move Higher?after a strong bullish rally, NEPHROPLUS has entered a healthy correction and is now testing an important demand zone. Rather than showing signs of trend reversal, the overall structure continues to favor the bulls, making this an interesting area to watch.
🎯 Supply & Demand Analysis 📊
The stock has reached a Good-quality Rally-Base-Rally demand zone , which offers several positive characteristics.
• The zone is a Rally-Base-Rally structure, reflecting institutional buying.
• This is the fir
Sensex View for 29 June 2026📊 SENSEX | NEXT WEEK ANALYSIS
CMP: 77,085
🔹 Last week, Sensex gave a strong recovery from lower levels.
🔹 Now price is testing an important demand zone around 76,900–77,000.
🔹 This zone will decide the direction for next week.
🟢 Bullish View
• If buyers defend this zone, expect a move towards 77,700–77,800.
• A strong breakout above 77,800 can extend the rally further.
🔴 Bearish View
• If 76,900 breaks with strong selling pressure, the next downside target is around 76,100–76,200.
⚠️ Key
NIFTY50 VIEW FOR MONDAY | 29 JUNE 2026📊 NIFTY | 1H Chart Analysis
CMP: 24,053
• Price has started pulling back after a strong rally. Nothing bearish yet.
• The 23,650–23,800 zone is the only area I'm watching closely. This is where buyers need to step in.
• If we get a clean reaction from this zone, the next leg can easily push towards 24,500–24,600.
• If buyers fail to defend it, expect a deeper correction before the next move.
• I'm not interested in chasing green candles here. Better to let price come into the demand area a
BANKNIFTY WEEKLY/ Pos[nal Level Analysis: 29th Jun-03rd Jul 2026BANKNIFTY WEEKLY/ Positional Level Analysis: 29th Jun-03rd Jul 2026
🔔 SGMN SplW Above BULLISH BIAS => 59021.
🔔 SGMN SplW BELOW Bearish BIAS => 57005.
Mentioned analysis based on 2 consecutive candle close in 15 min Time Frame.
━━━━━🟥🟧🟨🟩🟦🟪⬛━━━━━
💥Level Interpretation / description:
✍🏻L#1: If the candle crossed & stays above the “Buy Gen”, it is treated / considered as Bullish bias. Cfm=> Confirmation.
L#2: Possibility / Probability of REVERSAL near 🔕RL/TF1 & 🔔RL/TF2
L#3: If the candl