Midnifty Intraday Analysis for 24th September 2026NSE:NIFTY_MID_SELECT
The index is above 14500 and as long as the index is above 14500, the uptrend is expected to continue with momentum when index sustains above 14600.
The upward movement may lead the Index near 14725 – 14750 resistance range and if the index crosses and sustains above this level then may reach 14900 – 14925 range.
On the contrary, The downward moment may drag the index to 14425 – 14400 support range and if this support is broken then index may tank near 14250 – 14225
Supply and Demand
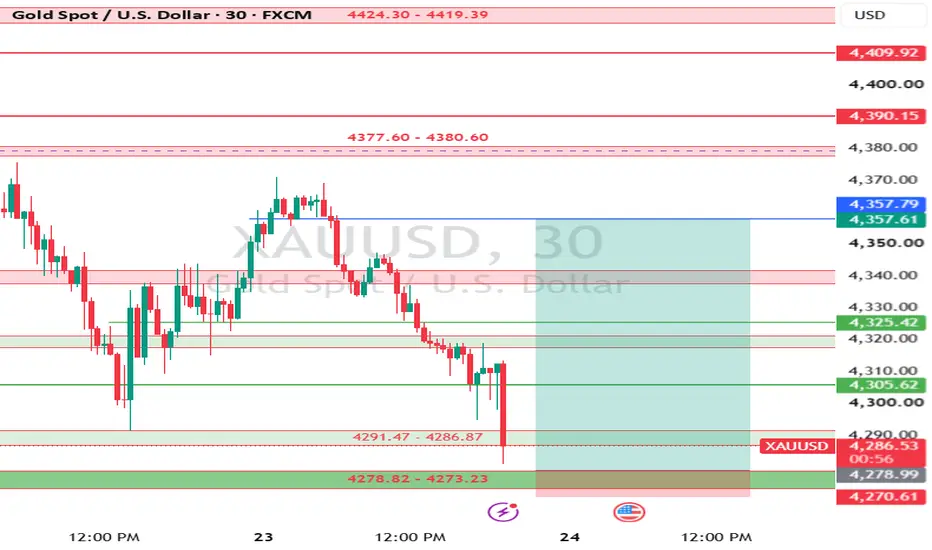
XAUUSD (Gold): Perfect Bounce from Major Support! Long SetupLooking at the XAUUSD 30-minute chart, we have seen a solid pullback right into our primary support and demand zone between 4,273 and 4,278.
Price is showing signs of stabilization and rejection of lower prices around this level, so I am starting a LONG position right here at 4,285.
Here is the breakdown of the game plan:
📈 The Setup: Buying the bounce off the 30m support block. As long as we hold above 4,270, the bullish structure remains intact for a push back toward local highs.
🟢 Entry: 4,
CROUSDT Bullish Breakout: $0.080 Target in FocusCronos (CRO) is showing a bullish continuation setup after breaking out from an extended consolidation range.
Price has reclaimed the important $0.060 horizontal pivot, strengthening the bullish structure on the daily timeframe. As long as CRO continues to hold this support area, buyers may attempt to push price toward the next major resistance zones.
The current structure suggests potential upside toward $0.068 initially, followed by the broader $0.080 resistance target if bullish momentum co
Nifty intraday levels for 24th SepAs mentioned 23360 proved to be crucial make or break for todays session.
For tmrow, 24th Sep, we see the price has formed uptrendline which extends exactly to 23490 (Tuesdays high)
If it respects that uptrendline then the projection shows 23490 may be possible by the end of the day provided Nifty sustains above 23425.
Any weakness below 23425 may take it down to 23350 to 23300 level again.
Nifty Intraday Analysis for 23rd September 2026NSE:NIFTY
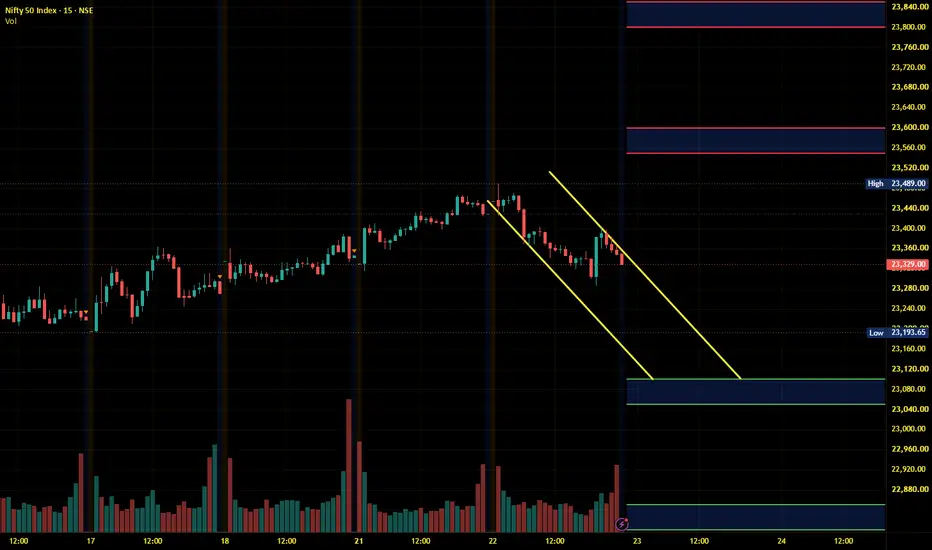
The index is above 23300 - 23250 support range and reversal is expected if the index sustains above support range in downtrend and uptrend will be formed when index sustains above 23500 level.
The upward movement may lead to 23550 – 23600 resistance range and if the index crosses and sustains above this level then may reach near 23800 – 23850 range.
On the contrary, The downward moment may drag the Index to 23100 – 23050 support range in downward momentum and if this support i
Banknifty Intraday Analysis for 23rd September 2026NSE:BANKNIFTY
The index is above 56000 support and reversal is expected if the index sustains above 56000 in downtrend.
The upward moment may lead the Index to 56900 – 57000 resistance range in upward momentum and if the index crosses and sustains above this level then may reach near 57600 – 57700 range.
On the contrary, The downward moment may drag the Index to 55500 – 55400 support range in downward momentum and if this support is broken then the index may tank near the 54800 – 54700 ra
Finnifty Intraday Analysis for 23rd September 2026NSE:CNXFINANCE
The index is above 25300 support and reversal is expected if the index sustains above 25300 in downtrend.
The upward movement may lead the Index to 25675 - 25725 resistance range and if the index crosses and sustains above this level then may reach near 26000 - 26050 range.
On the contrary, The downward moment may drag the to 25150 – 25100 support range and if this support too is broken then index may tank near 24850 – 24800 range.
Midnifty Intraday Analysis for 23rd September 2026NSE:NIFTY_MID_SELECT
The index is above 14500 and as long as the index is above 14500, the uptrend is expected to continue with momentum when index sustains above 14600.
The upward movement may lead the Index near 14700 – 14725 resistance range and if the index crosses and sustains above this level then may reach 14875 – 14900 range.
On the contrary, The downward moment may drag the index to 14400 – 14375 support range and if this support is broken then index may tank near 14225 – 14200
LOTUSDEV | Tight price action near its all-time high.
Sri Lotus Developers & Realty is back near its post-listing high. After a strong advance, the recent daily candles have become smaller and tighter, with volume easing during the consolidation. Earlier price expansion came with a noticeable pickup in volume. The stock has also held up relatively well during the recent market weakness.
That makes it an interesting watchlist setup, not a confirmed breakout. Tight candles and drying volume show that price is pausing near resistance; they do not
XAUUSD Intraday: Bullish Reversal Setup from Key Support ZoneGold (XAUUSD) has experienced a sharp intraday pullback, dropping aggressively into a major support floor (highlighted in the green zone) between the 4,315.00 and 4,320.00 levels. Currently trading around 4,318.27, price action is testing this critical demand area on the 15-minute timeframe. The drawn trajectory anticipates a strong rejection of lower prices and a subsequent bullish zigzag continuation climbing through overhead resistance levels.
The Trade Plan
The setup relies on buyers step
Nifty levels for 22nd Sep expiryThe uptrenline is resting on a bearish candle on 30 mins TF
This is early sign of weakness
Anymore selling in the 23450 level may take it down to 23330. Levels are marked on the chart.
If Nifty follows the downward projection line then 23330 is likely to be achieved by 13:30 (1:30 pm) on 22-Sep
There is intermediate support at this 23330 region and major support is near 23275
On the higher side 23575 is sellers area
IIFLCAPS — Weekly Consolidation Near Breakout ZoneIIFLCAPS is showing a tight weekly consolidation after a strong recovery from the April lows.
Price continues to trade above both key weekly moving averages:
EMA 13: ₹335.37
EMA 30: ₹324.13
Weekly RSI: ~56.9
Current Price: ₹344.40
The important feature on the chart is the prolonged compression just below the ₹355–360 resistance zone. Price has repeatedly held above the rising EMA structure while volatility has contracted.
Key Levels
Breakout Zone: ₹355–360
Immediate Support: ₹335–338
Majo
Nifty Intraday Analysis for 21st September 2026NSE:NIFTY
The enactment of the Lindsey O. Graham Sanctioning Russia and Iran Act of 2026 empowers the US President to impose up to 100% tariffs on countries like India for importing Russian oil. Coupled with crude price surges driven by the ongoing Russia-Ukraine war and fresh Houthi-Saudi escalations, these geopolitical developments are sentimentally negative for the Indian market.
The index is near 23350 support and the index has strong resistance in the 23400 - 23500 range and if it break
Banknifty Intraday Analysis for 21st September 2026NSE:BANKNIFTY
The enactment of the Lindsey O. Graham Sanctioning Russia and Iran Act of 2026 empowers the US President to impose up to 100% tariffs on countries like India for importing Russian oil. Coupled with crude price surges driven by the ongoing Russia-Ukraine war and fresh Houthi-Saudi escalations, these geopolitical developments are sentimentally negative for the Indian market.
The index is near 56500 resistance and if index sustains above this level then uptrend is expected to cont
Finnifty Intraday Analysis for 21st September 2026NSE:CNXFINANCE
The enactment of the Lindsey O. Graham Sanctioning Russia and Iran Act of 2026 empowers the US President to impose up to 100% tariffs on countries like India for importing Russian oil. Coupled with crude price surges driven by the ongoing Russia-Ukraine war and fresh Houthi-Saudi escalations, these geopolitical developments are sentimentally negative for the Indian market.
The index is near 25500 resistance and if index sustains above this level then uptrend is expected to con
Midnifty Intraday Analysis for 21st September 2026NSE:NIFTY_MID_SELECT
The enactment of the Lindsey O. Graham Sanctioning Russia and Iran Act of 2026 empowers the US President to impose up to 100% tariffs on countries like India for importing Russian oil. Coupled with crude price surges driven by the ongoing Russia-Ukraine war and fresh Houthi-Saudi escalations, these geopolitical developments are sentimentally negative for the Indian market.
The index is at 14500 resistance and index sustains above this level and 14500 Put writing increa
NIFTY closed above trendline! Signs of REVERSAL!?As discussed NIFTY managed to close itself above the trendline support which is a good sign, showing signs of BULLISHNESS. Hence, all long as we are above the trendline, every dip can be bought for upcoming short covering move. So, plan your trades accordingly and keep watching everyone.
Nifty Intraday Analysis for 18th September 2026NSE:NIFTY
The index is near 23200 support and the uptrend is expected to continue as long as the index is above 23200 level.
The upward movement may lead to 23500 – 23550 resistance range and if the index crosses and sustains above this level then may reach near 23750 – 23800 range.
On the contrary, The downward moment may drag the Index to 23050 – 23000 support range in downward momentum and if this support is broken then index may tank near 22800 – 22750 range.
Banknifty Intraday Analysis for 18th September 2026NSE:BANKNIFTY
The index is near 56000 support and the uptrend is expected to continue as long as the index is above 56000 level.
The upward moment may lead the Index to 56800 – 56900 resistance range in upward momentum and if the index crosses and sustains above this level then may reach near 57500 – 57600 range.
On the contrary, The downward moment may drag the Index to 55300 – 55200 support range in downward momentum and if this support is broken then the index may tank near the 54600 – 5
Finnifty Intraday Analysis for 18th September 2026NSE:CNXFINANCE
The index is near 25200 support and the uptrend is expected to continue as long as the index is above 25200 level.
The upward movement may lead the Index to 25600 - 25650 resistance range and if the index crosses and sustains above this level then may reach near 25900 - 25950 range.
On the contrary, The downward moment may drag the to 25050 – 25000 support range and if this support too is broken then index may tank near 24750 – 24700 range.
Midnifty Intraday Analysis for 18th September 2026NSE:NIFTY_MID_SELECT
The index is near 14500 resistance and id index breaks and sustains above this level then uptrend will continue else 14500 will act as profit booking level.
The upward movement may lead the Index near 14575 – 14600 resistance range and if the index crosses and sustains above this level then may reach 14750 – 14775 range.
On the contrary, The downward moment may drag the index to 14275 – 14250 support range and if this support is broken then index may tank near 14100
XAUUSD 15m: Intraday Short from Supply, Bullish Swing OutlookCurrently monitoring XAUUSD on the 15-minute timeframe. Price is testing a key supply zone around the 4,376 level.
Intraday Outlook (Bearish):
I am expecting an intraday rejection from this upper supply zone. If we get confirmation of a reversal here, the immediate downside targets are the green demand levels mapped out below, specifically around 4,321 and 4,264.
Long-Term Outlook (Bullish):
While the short-term intraday play is bearish, my bias for the upcoming weeks remains firmly bullis