OilSince June 2026, the stock has been trading below a long-term trendline that connects the major lows of March 2020, September 2022, and January 2026, indicating a potential deterioration in the primary uptrend.
A notable bearish signal had already emerged in August–September 2024, where the August open and September close formed a bearish tweezer pattern around the 552 level, highlighting strong resistance and a possible trend reversal zone.
From a price-action perspective, any recovery rally
Supply and Demand
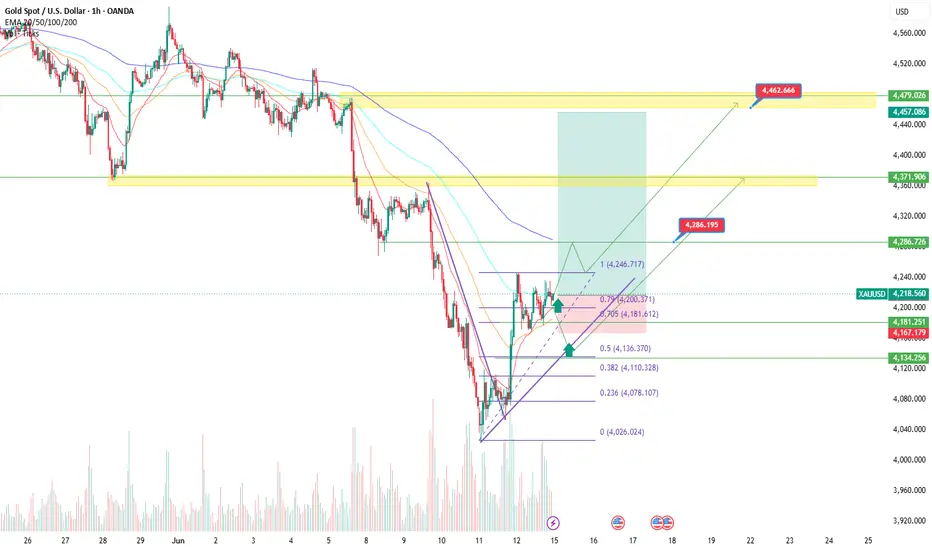
Gold: Buyers regain control after the reboundAfter a sharp decline earlier this month, gold is showing signs of stabilization and attempting to rebuild bullish momentum. The recent recovery from local lows has allowed buyers to reclaim several important levels, suggesting that the corrective phase may be losing strength. With ongoing geopolitical uncertainty and expectations surrounding central bank policy, XAUUSD remains one of the most closely watched assets in global markets.
From a fundamental perspective, gold continues to benefit fr
BANKNIFTY DAILYY /Short Range Level Analysis for 15th Jun 2026🔕 SGMN SplD BULLISH Above => 57018.
🔕 SGMN SplD Bearish BELOW => 56622.
Mentioned analysis based on 2 consecutive candle close in 15 min Time Frame.
━━━━━🟥🟧🟨🟩🟦🟪⬛━━━━━
💥Level Interpretation / description:
✍🏻L#1: If the candle crossed & stays above the “Buy Gen”, it is treated / considered as Bullish bias. Cfm=> Confirmation.
L#2: Possibility / Probability of REVERSAL near 🔕RL/TF1 & 🔔RL/TF2
L#3: If the candle stays above “Sell Gen” but below “Buy Gen”, it is treated / considered as S
NIFTY DAILY / Short Range Level Analysis for 15th Jun 2026🔕 SGMN SplD BULLISH Above => 23671.
🔕 SGMN SplD Bearish BELOW => 23577.
Mentioned analysis based on 2 consecutive candle close in 15 min Time Frame.
━━━━━🟥🟧🟨🟩🟦🟪⬛━━━━━
💥Level Interpretation / description:
✍🏻L#1: If the candle crossed & stays above the “Buy Gen”, it is treated / considered as Bullish bias. Cfm=> Confirmation.
L#2: Possibility / Probability of REVERSAL near 🔕RL/TF1 & 🔔RL/TF2
L#3: If the candle stays above “Sell Gen” but below “Buy Gen”, it is treated / considered as Sidew
NIFTY WEEKLY / POSITIONAL Level Analysis from 15th-19th Jun 2026🔔 SGMN SplWP Above BULLISH BIAS => 23694.
🔔 SGMN SplWP BELOW Bearish BIAS => 23428.
Mentioned analysis based on 2 consecutive candle close in 15 min Time Frame.
━━━━━🟥🟧🟨🟩🟦🟪⬛━━━━━
💥Level Interpretation / description:
✍🏻L#1: If the candle crossed & stays above the “Buy Gen”, it is treated / considered as Bullish bias. Cfm=> Confirmation.
L#2: Possibility / Probability of REVERSAL near 🔕RL/TF1 & 🔔RL/TF2
L#3: If the candle stays above “Sell Gen” but below “Buy Gen”, it is treated / consider
RELIANCE : Demand and Supply Zone Trading SystemNSE:RELIANCE
Demand and Supply Zone Trading System
Demand and Supply trading is a price action methodology based on the imbalance between buyers and sellers in the market. A Demand Zone is an area where strong buying interest previously entered the market and pushed price upward aggressively, while a Supply Zone is an area where heavy selling pressure caused a sharp decline in price. Traders identify these zones to anticipate potential reversals, continuations, or institutional order
AIIL: Structural Consolidation - Watch for Breakout TriggerNSE:AIIL
Market Context & Structural Narrative
Authum Investment & Infrastructure Ltd. (NSE: AIIL) is exhibiting a well-defined structural base creation following a significant corrective phase.
After finding sustained buying interest at the lower floor of 400.90—coinciding with a vital higher-timeframe quarterly demand zone—the asset has transitioned into a steady accumulation phase. The price action shows a sequence of structural pivots where the downside volatility is systematically d
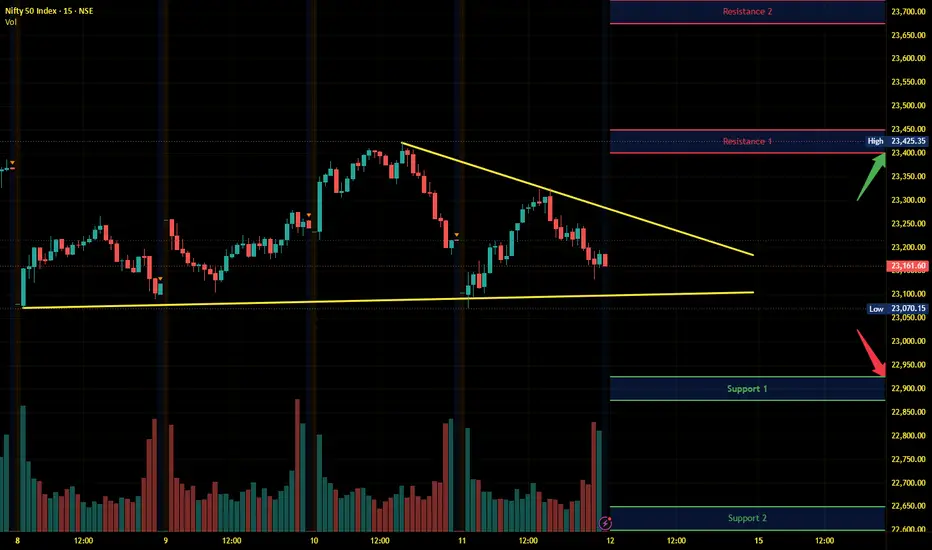
Nifty Intraday Analysis for 12th June 2026NSE:NIFTY
The proactive initiatives by the GoI and the RBI to attract FPIs have kept domestic sentiment positive. However, if the fresh escalation in the West Asia conflict persists, volatility is expected to continue, and the market will likely close in negative territory.
A downward moment may drag the Index to 22925 – 22875 support range in downward momentum and if this support is broken then index may tank near 22650 – 22600 range.
On the contrary, the upward movement may lead to 234
Banknifty Intraday Analysis for 12th June 2026NSE:BANKNIFTY
The proactive initiatives by the GoI and the RBI to attract FPIs have kept domestic sentiment positive. However, if the fresh escalation in the West Asia conflict persists, volatility is expected to continue, and the market will likely close in negative territory.
A downward moment may drag the Index to 54600 – 54500 support range in downward momentum and if this support is broken then the index may tank near the 53900 – 53800 range.
On the contrary, the upward moment may lead
Finnifty Intraday Analysis for 12th June 2026 NSE:CNXFINANCE
The proactive initiatives by the GoI and the RBI to attract FPIs have kept domestic sentiment positive. However, if the fresh escalation in the West Asia conflict persists, volatility is expected to continue, and the market will likely close in negative territory.
A downward moment may drag the to 24850 – 24800 support range and if this support too is broken then index may tank near 24500 – 24450 range.
On the contrary, the upward movement may lead the Index to 25450 - 25500
Midnifty Intraday Analysis for 12th June 2026NSE:NIFTY_MID_SELECT
The proactive initiatives by the GoI and the RBI to attract FPIs have kept domestic sentiment positive. However, if the fresh escalation in the West Asia conflict persists, volatility is expected to continue, and the market will likely close in negative territory.
A downward moment may drag the index to 13700 – 13675 support range and if this support is broken then index may tank near 13525 – 13500 range.
On the contrary, the upward movement may lead the Index near 1405
Will US-IRAN deal bring respite ?As we can see NIFTY failed to sustain itself at higher levels and fell, showing bearisness, exactly as analysed in our previous post. Now strong talks going on between US and Iran can lead to big gaps in opening but the closing should be taken into account. If NIFTY manages to close above 23400, we may see NIFTY turning bullish. Else we can expect NIFTY to remain bearish in coming trading sessions. So, plan your trades accordingly and keep watching everyone.
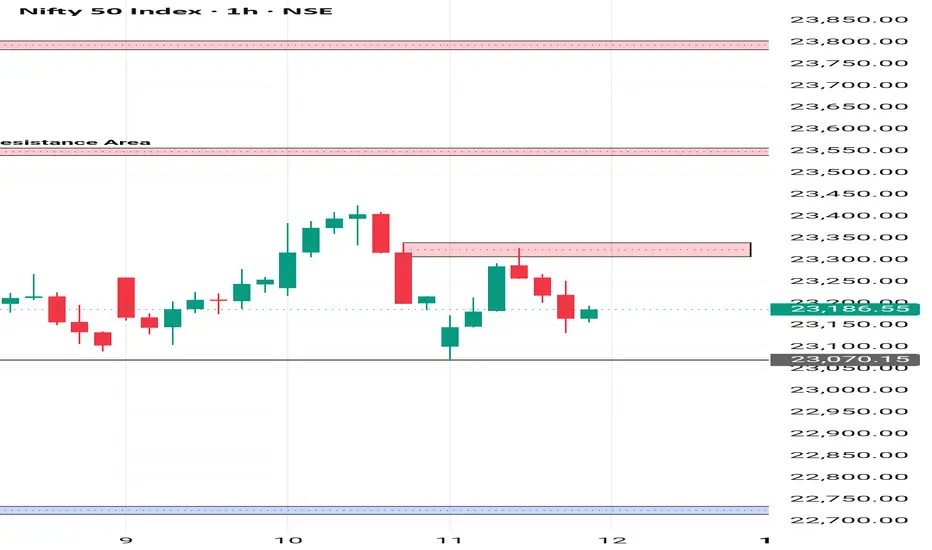
Nifty Market outlook for tomorrow | 12 June 2026📊 NIFTY – CHART ANALYSIS
CMP: 23,186
▪️ Resistance: 23,350 – 23,400 🔴
▪️ Strong Resistance: 23,600
▪️ Support: 23,070 🟢
▪️ Strong Support: 22,800
▪️ Price facing rejection from supply zone
▪️ Weak bounce, no strong bullish confirmation
▪️ Structure still sideways to bearish
▪️ Above 23,400 → Short covering rally 📈
▪️ Below 23,070 → Sharp downside continuation 📉
▪️ Strategy:
Wait for breakout only
No trade in middle zone ⚠️
▪️ View: Trap zone, volatility expected on Friday ⚡
SENSEX DAILY/ Short Range Level Analysis for 12th Jun 2026🔕 SGMN SplD BULLISH Above => 74000.
🔕 SGMN SplD Bearish BELOW => 73675.
Mentioned analysis based on 2 consecutive candle close in 15 min Time Frame.
━━━━━🟥🟧🟨🟩🟦🟪⬛━━━━━
💥Level Interpretation / description:
✍🏻L#1: If the candle crossed & stays above the “Buy Gen”, it is treated / considered as Bullish bias. Cfm=> Confirmation.
L#2: Possibility / Probability of REVERSAL near 🔕RL/TF1 & 🔔RL/TF2
L#3: If the candle stays above “Sell Gen” but below “Buy Gen”, it is treated / considered as Side
BANKNIFTY DAILYY /Short Range Level Analysis for 12th Jun 2026🔕 SGMN SplD BULLISH Above => 55362.
🔕 SGMN SplD Bearish BELOW => 54998.
Mentioned analysis based on 2 consecutive candle close in 15 min Time Frame.
━━━━━🟥🟧🟨🟩🟦🟪⬛━━━━━
💥Level Interpretation / description:
✍🏻L#1: If the candle crossed & stays above the “Buy Gen”, it is treated / considered as Bullish bias. Cfm=> Confirmation.
L#2: Possibility / Probability of REVERSAL near 🔕RL/TF1 & 🔔RL/TF2
L#3: If the candle stays above “Sell Gen” but below “Buy Gen”, it is treated / considered as Sid
Nifty Intraday Analysis for 11th June 2026NSE:NIFTY
The fresh escalation in the West Asia conflict has dented global market sentiment; however, proactive initiatives by the GoI and the RBI to attract FPIs have kept domestic sentiment positive. A potential market reversal is expected from its lows if there is a gap-down opening or an initial index drag into negative territory.
A downward moment may drag the Index to 22975 – 22925 support range in downward momentum and if this support is broken then index may tank near 22700 – 22650
Banknifty Intraday Analysis for 11th June 2026NSE:BANKNIFTY
The fresh escalation in the West Asia conflict has dented global market sentiment; however, proactive initiatives by the GoI and the RBI to attract FPIs have kept domestic sentiment positive. A potential market reversal is expected from its lows if there is a gap-down opening or an initial index drag into negative territory.
A downward moment may drag the Index to 54500 – 54400 support range in downward momentum and if this support is broken then the index may tank near the 53
Finnifty Intraday Analysis for 11th June 2026 NSE:CNXFINANCE
The fresh escalation in the West Asia conflict has dented global market sentiment; however, proactive initiatives by the GoI and the RBI to attract FPIs have kept domestic sentiment positive. A potential market reversal is expected from its lows if there is a gap-down opening or an initial index drag into negative territory.
A downward moment may drag the to 24900 – 24850 support range and if this support too is broken then index may tank near 24550 – 24500 range.
On the co
Midnifty Intraday Analysis for 11th June 2026NSE:NIFTY_MID_SELECT
The fresh escalation in the West Asia conflict has dented global market sentiment; however, proactive initiatives by the GoI and the RBI to attract FPIs have kept domestic sentiment positive. A potential market reversal is expected from its lows if there is a gap-down opening or an initial index drag into negative territory.
A downward moment may drag the index to 13825 – 13800 support range and if this support is broken then index may tank near 13650 – 13625 range.
On
NIFTY DAILY / Short Range Level Analysis for 12th June 2026🔕 SGMN SplD BULLISH Above => 23211.
🔕 SGMN SplD Bearish BELOW => 23115.
Mentioned analysis based on 2 consecutive candle close in 15 min Time Frame.
━━━━━🟥🟧🟨🟩🟦🟪⬛━━━━━
💥Level Interpretation / description:
✍🏻L#1: If the candle crossed & stays above the “Buy Gen”, it is treated / considered as Bullish bias. Cfm=> Confirmation.
L#2: Possibility / Probability of REVERSAL near 🔕RL/TF1 & 🔔RL/TF2
L#3: If the candle stays above “Sell Gen” but below “Buy Gen”, it is treated / considered as S
XAUUSD GOLD ANALYSIS ON (11 JUN 2026)#XAUUSD UPDATEDE
Current price - 4094
If price stay below 4125, then next target 4060,4025 and 4000 and above that 4200
Plan;If price break 4100-4110 area,and stay below 4100,we will place sell order in gold with target of 4060,4025 and 4000 & stop loss should be placed at 4125
NIFTY might show a sharp fall in coming trading sessions!As we can see NIFTY trapped retailers after breaking out of the trendline but closes below the trendline, trapping the buyers. This further concretes our view that NIFTY is getting weaker and this trap further adds fuel to the fire. Hence we can expect NIFTY to get very weak below 23100 levels, breaking of which could led to sharp fall towards 22800 levels. So, plan your trades accordingly and keep watching everyone.