USDCAD to continues its Up-move above 1.4248?Price is forming a temporary sideways consolidating structure bounded by support at 1.4144 & resistance at 1.4248, breakout can lead to the continuation of super bullish move which was started on 1st may 2026 and has already broken 2 significant highs 1.3967 & 1.4140.
At the confluence of bullish trendline and horizontal support (1.4158) a strong bullish push is expected.
According to the price structure on higher time frames outlook for, near to midterm is bullish (Please refer to the related publication for the reference), hence bullish trades should be preferred.
Summary: Breakout above 1.4248 will lead to continuation of the up-move. can plan for fresh entries.
For Educational Purposes only, Not an Investment Advice, Always use strict Risk management measures.
Regards CrazyTrades247.
Supply and Demand
BTCUSDT Bullish SMC Setup | Order Block Retest + IDM + BOS (1H)This analysis highlights a potential bullish Smart Money Concepts (SMC) setup on BTCUSDT (1H).
Analysis Overview
✅ Bullish Break of Structure (BOS)
✅ Inducement (IDM) sweep completed
✅ Price approaching a bullish Order Block (OB)
✅ Looking for a reaction from the Order Block before continuation
✅ Target is the previous supply/liquidity zone
Trading Idea
The market has already confirmed a bullish BOS, indicating strength from buyers. After sweeping liquidity (IDM), price is currently retracing toward a bullish Order Block.
If the Order Block holds and buyers step in with a strong bullish confirmation, the next objective could be a move toward the previous resistance/liquidity area.
Invalidation
A sustained close below the bullish Order Block would invalidate this setup and suggest further downside.
This is a market structure analysis based on Smart Money Concepts (SMC). Wait for confirmation before entering any trade.
Educational purposes only — Not Financial Advice.
#BTCUSDT #Bitcoin #SMC #SmartMoneyConcepts #OrderBlock #BOS #IDM #Liquidity #Crypto #TradingView #PriceAction #BitcoinAnalysis
Nifty Intraday Analysis for 08th July 2026NSE:NIFTY
The market is expected to open flat to lower; however, a reversal from the lower levels is anticipated.
The upward movement may lead to 24650 – 24700 resistance range and if the index crosses and sustains above this level then may reach near 24900 – 24950 range.
On the contrary, a downward moment may drag the Index to 24150 – 24100 support range in downward momentum and if this support is broken then index may tank near 23900 – 23850 range.
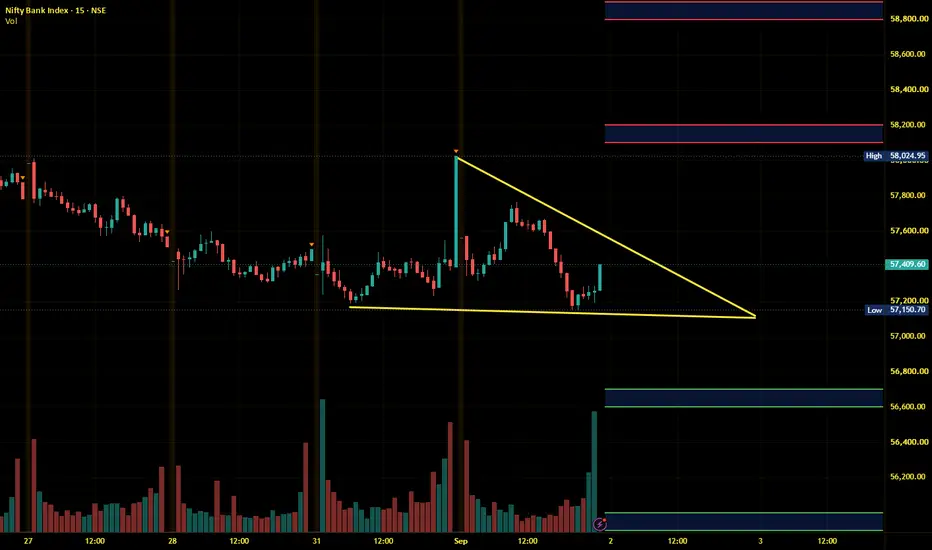
Banknifty Intraday Analysis for 08th July 2026NSE:BANKNIFTY
The market is expected to open flat to lower; however, a reversal from the lower levels is anticipated.
The upward moment may lead the Index to 58900 – 59000 resistance range in upward momentum and if the index crosses and sustains above this level then may reach near 59600 – 59700 range.
On the contrary, a downward moment may drag the Index to 57700 – 57600 support range in downward momentum and if this support is broken then the index may tank near the 57000 – 56900 range.
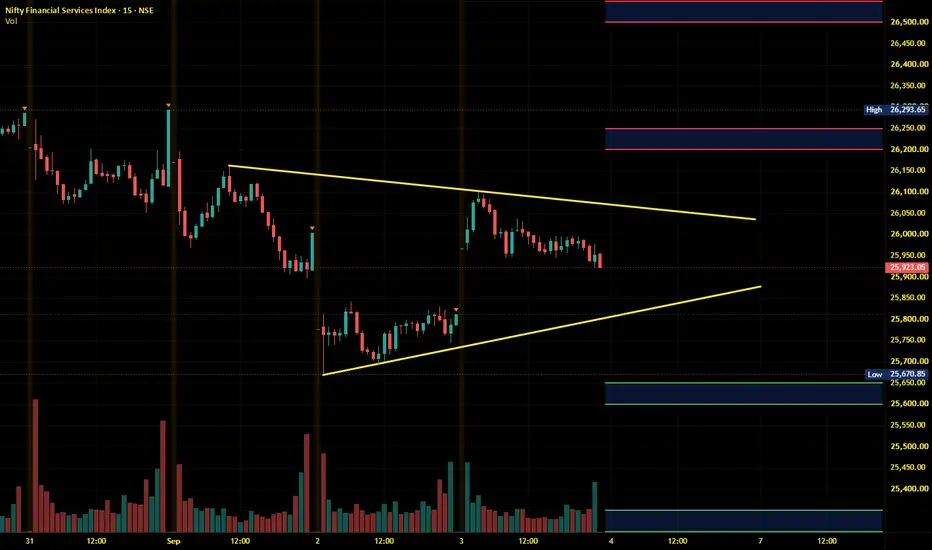
Finnifty Intraday Analysis for 08th July 2026NSE:CNXFINANCE
The market is expected to open flat to lower; however, a reversal from the lower levels is anticipated.
The upward movement may lead the Index to 27250 - 27300 resistance range and if the index crosses and sustains above this level then may reach near 27550 - 27600 range.
On the contrary, a downward moment may drag the to 26750 – 26700 support range and if this support too is broken then index may tank near 26450 – 26400 range.
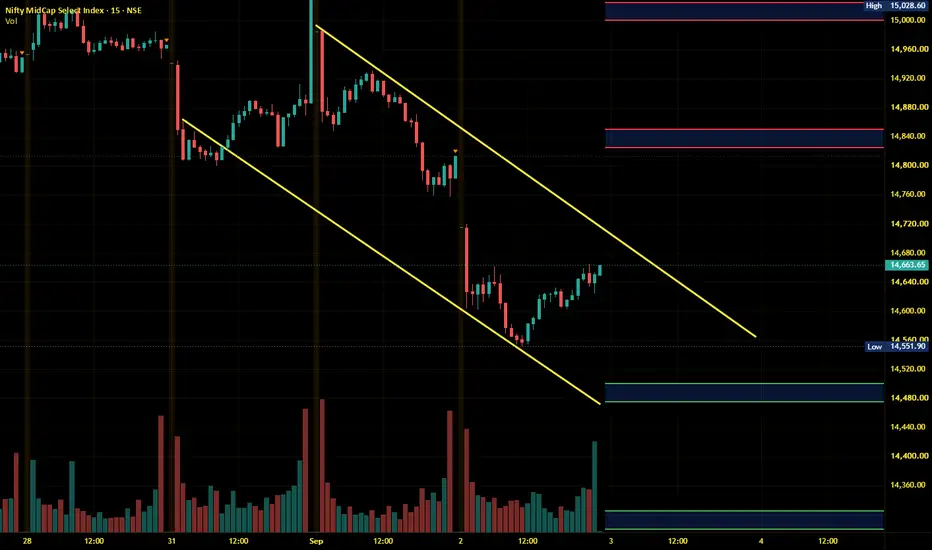
Midnifty Intraday Analysis for 0 8th July 2026NSE:NIFTY_MID_SELECT
The market is expected to open flat to lower; however, a reversal from the lower levels is anticipated.
The upward movement may lead the Index near 14800 – 14825 resistance range and if the index crosses and sustains above this level then may reach 15000 – 15025 range.
On the contrary, a downward moment may drag the index to 14475 – 14450 support range and if this support is broken then index may tank near 14275 – 14250 range.
NIFTY DAILY / Short Range Level Analysis for 09th Jul 2026🔕 SGMN SplD BULLISH Above => 23958.
🔕 SGMN SplD Bearish BELOW => 23809.
Mentioned analysis based on 2 consecutive candle close in 15 min Time Frame.
━━━━━🟥🟧🟨🟩🟦🟪⬛━━━━━
💥Level Interpretation / description:
✍🏻L#1: If the candle crossed & stays above the “Buy Gen”, it is treated / considered as Bullish bias. Cfm=> Confirmation.
L#2: Possibility / Probability of REVERSAL near 🔕RL/TF1 & 🔔RL/TF2
L#3: If the candle stays above “Sell Gen” but below “Buy Gen”, it is treated / considered as Sidewise. Aggressive Traders can take Long position near “Sell Gen” either retesting or crossed from Below & vice-versa i.e. can take Short position near “Buy Gen” either retesting or crossed downward from Above.
L#4: If the candle crossed & stays below the “Sell Gen”, it is treated / considered a Bearish bias.
L#5: Possibility / Probability of REVERSAL near 🔕RL/TF1 & 🔔RL/TF2
HZB (Buy side) & HZS (Sell side) => Hurdle Zone,
✍🏻 *** Specialty of “HZB#1, HZB#2 HZS#1 & HZS#2” is Sidewise (behaviour in Nature)
Rest Plotted and Mentioned on Chart
Color code Used:
Green, BLUE =. Positive bias.
Safron, RED =. Negative bias.
RED in Between Green means Trend Finder / Momentum Change
/ CYCLE Change and Vice Versa.
Notice One thing: HOW LEVELS are Working.
Use any Momentum Indicator / Oscillator or as you "USED to" to Take entry.
━━━━━🟥🟧🟨🟩🟦🟪⬛━━━━━
⚠️ DISCLAIMER:
The information, views, and ideas shared here are purely for educational and informational purposes only. They are not intended as investment advice or a recommendation to buy, sell, or hold any financial instruments. I am not a SEBI-registered financial adviser.
Trading and investing in the stock market involves risk, and you should do your own research and analysis. You are solely responsible for any decisions made based on this research.
"🔔As HARD EARNED MONEY IS YOUR's, So DECISION SHOULD HAVE TO BE YOUR's".
━━━━━🟥🟧🟨🟩🟦🟪⬛━━━━━
❇️ Follow notification about periodical View
💥 Do Comment for Stock WEEKLY Level Analysis.🚀
📊 Do you agree with this view?
✈️ HIT THE PLANE ICON if this technical observation resonates with you. It will Motivate me.
━━━━━🟥🟧🟨🟩🟦🟪⬛━━━━━
💡 If You LOOKING any CHART & want for Level and ANALYZE?
Share your desired stock names in the comments below! I will try to analyze the chart Levels, patterns and share my technical view (so far my Knowledge).
If Viewers think It can identify meaningful setups. Looking forward to hearing from all of you — let's keep this discussion going and help each other make better trading decisions.
___________🔕^^^⚫⚪^🙏🏼🙏🏼🙏🏼^⚪⚫^^^🔔___________
NIFTY must close itself above the supply zone for confirmation !As we can see NIFTY got rejected exactly from our supply zone. We can expect NIFTY to remain sideways to negative as long as NIFTY manages to sustain itself below the supply zone. We must wait for NIFTY to break and close itself above the supply zone for confirmation of the uptrend. So plan your trades accordingly and keep watching everyone.
USDCHF the break is over, rally to continue ?? After making the high of 0.8130 on 24th June, which was preceded by the structural shift of the price form bearish to bullish which got confirmed after the breakout of 0.8042 level, price took most required correction & has retested the strong bullish support level of 0.8011, following to which price had started to make HH & HL formation and now has reached a breakout level denoted by a horizontal neckline at 0.8074, if price breaks above it we can take fresh long entries on USDCHF.
Price is expected to show sustained up-move, hence it's suitable for making positional bets, we see a good Up-side for short to midterm time period (Kindly Check the additional resources for the reference).
Immediate support is at 0.8054 and immediate resistance is at 0.8097
Summary: Only long Trades should be preferred, It's an opportunity to take positions before price continues in its expected direction. however waiting for the breakout of 0.8074 could be a good idea for fresh entries.
For Educational Purposes only, Not an Investment Advice, Always use strict Risk management measures.
Regards CrazyTrades247.
Nifty50 view for Tomorrow | 8 July 📊 NIFTY – Tomorrow's Analysis
Today's rejection came exactly from the 24,500–24,600 supply zone, keeping the higher time frame view intact.
For tomorrow, 24,370 remains the key level.
🟢 Above 24,370: Expect a bounce towards 24,450–24,500.
🔴 Below 24,370: Weakness can continue, with 24,200 as the next important support.
Current Bias: Slightly Bearish 📉
Plan: Respect the higher time frame. Sell on rise until the supply zone is convincingly broken.
SENSEX DAILYY/ Short Range Level Analysis: 08th Jul 2026.🔕 SGMN SplD BULLISH Above => 78365.
🔕 SGMN SplD Bearish BELOW => 78008.
Mentioned analysis based on 2 consecutive candle close in 15 min Time Frame.
━━━━━🟥🟧🟨🟩🟦🟪⬛━━━━━
💥Level Interpretation / description:
✍🏻L#1: If the candle crossed & stays above the “Buy Gen”, it is treated / considered as Bullish bias. Cfm=> Confirmation.
L#2: Possibility / Probability of REVERSAL near 🔕RL/TF1 & 🔔RL/TF2
L#3: If the candle stays above “Sell Gen” but below “Buy Gen”, it is treated / considered as Sidewise. Aggressive Traders can take Long position near “Sell Gen” either retesting or crossed from Below & vice-versa i.e. can take Short position near “Buy Gen” either retesting or crossed downward from Above.
L#4: If the candle crossed & stays below the “Sell Gen”, it is treated / considered a Bearish bias.
L#5: Possibility / Probability of REVERSAL near 🔕RL/TF1 & 🔔RL/TF2
HZB (Buy side) & HZS (Sell side) => Hurdle Zone,
✍🏻 *** Specialty of “HZB#1, HZB#2 HZS#1 & HZS#2” is Sidewise (behaviour in Nature)
Rest Plotted and Mentioned on Chart
Color code Used:
Green, BLUE =. Positive bias.
Safron, RED =. Negative bias.
RED in Between Green means Trend Finder / Momentum Change
/ CYCLE Change and Vice Versa.
Notice One thing: HOW LEVELS are Working.
Use any Momentum Indicator / Oscillator or as you "USED to" to Take entry.
━━━━━🟥🟧🟨🟩🟦🟪⬛━━━━━
⚠️ DISCLAIMER:
The information, views, and ideas shared here are purely for educational and informational purposes only. They are not intended as investment advice or a recommendation to buy, sell, or hold any financial instruments. I am not a SEBI-registered financial adviser.
Trading and investing in the stock market involves risk, and you should do your own research and analysis. You are solely responsible for any decisions made based on this research.
"🔔As HARD EARNED MONEY IS YOUR's, So DECISION SHOULD HAVE TO BE YOUR's".
━━━━━🟥🟧🟨🟩🟦🟪⬛━━━━━
❇️ Follow notification about periodical View
💥 Do Comment for Stock WEEKLY Level Analysis.🚀
📊 Do you agree with this view?
✈️ HIT THE PLANE ICON if this technical observation resonates with you. It will Motivate me.
━━━━━🟥🟧🟨🟩🟦🟪⬛━━━━━
💡 If You LOOKING any CHART & want for Level and ANALYZE?
Share your desired stock names in the comments below! I will try to analyze the chart Levels, patterns and share my technical view (so far my Knowledge).
If Viewers think It can identify meaningful setups. Looking forward to hearing from all of you — let's keep this discussion going and help each other make better trading decisions.
___________🔕^^^⚫⚪^🙏🏼🙏🏼🙏🏼^⚪⚫^^^🔔___________
HYPE Bullish Structure Holding — Pullback Entry SetupHYPE remains one of the strongest charts in the market after breaking out of its multi-week downtrend.
The price is now holding above all key moving averages, which keeps the overall structure bullish. However, instead of chasing the rally, the better setup is to wait for a pullback into the $64.50 support zone.
If geopolitical tensions create a temporary sell-off and this level continues to hold, it could present a high-probability entry for a continuation move toward the recent highs.
Trade Levels:
Entry Zone: $63.50 – $64.50
Take Profit Targets: $67 and $70
Stop Loss: $62
NVDA Holding Key Support as AI Ecosystem StrengthensNVIDIA NASDAQ:NVDA recently introduced a new partnership program that allows AI startups to exchange high-performance computing capacity for a share of their future product and cloud revenue. This move further strengthens NVIDIA’s position as a major player in the AI ecosystem.
From a technical perspective, NVDA is currently sitting near a key support level. If buyers continue to defend this zone and geopolitical risks remain controlled, the stock could regain momentum and move back toward its recent highs.
Trade Levels:
Entry Zone: $194 – $195
Take Profit Targets: $202 and $211
Stop Loss: $188
BANKNIFTY DAILY / Short Range Level Analysis for 08th Jul 2026🔕 SGMN SplD BULLISH Above => 58361.
🔕 SGMN SplD Bearish BELOW => 58049.
Mentioned analysis based on 2 consecutive candle close in 15 min Time Frame.
━━━━━🟥🟧🟨🟩🟦🟪⬛━━━━━
💥Level Interpretation / description:
✍🏻L#1: If the candle crossed & stays above the “Buy Gen”, it is treated / considered as Bullish bias. Cfm=> Confirmation.
L#2: Possibility / Probability of REVERSAL near 🔕RL/TF1 & 🔔RL/TF2
L#3: If the candle stays above “Sell Gen” but below “Buy Gen”, it is treated / considered as Sidewise. Aggressive Traders can take Long position near “Sell Gen” either retesting or crossed from Below & vice-versa i.e. can take Short position near “Buy Gen” either retesting or crossed downward from Above.
L#4: If the candle crossed & stays below the “Sell Gen”, it is treated / considered a Bearish bias.
L#5: Possibility / Probability of REVERSAL near 🔕RL/TF1 & 🔔RL/TF2
HZB (Buy side) & HZS (Sell side) => Hurdle Zone,
✍🏻 *** Specialty of “HZB#1, HZB#2 HZS#1 & HZS#2” is Sidewise (behaviour in Nature)
Rest Plotted and Mentioned on Chart
Color code Used:
Green, BLUE =. Positive bias.
Safron, RED =. Negative bias.
RED in Between Green means Trend Finder / Momentum Change
/ CYCLE Change and Vice Versa.
Notice One thing: HOW LEVELS are Working.
Use any Momentum Indicator / Oscillator or as you "USED to" to Take entry.
━━━━━🟥🟧🟨🟩🟦🟪⬛━━━━━
⚠️ DISCLAIMER:
The information, views, and ideas shared here are purely for educational and informational purposes only. They are not intended as investment advice or a recommendation to buy, sell, or hold any financial instruments. I am not a SEBI-registered financial adviser.
Trading and investing in the stock market involves risk, and you should do your own research and analysis. You are solely responsible for any decisions made based on this research.
"🔔As HARD EARNED MONEY IS YOUR's, So DECISION SHOULD HAVE TO BE YOUR's".
━━━━━🟥🟧🟨🟩🟦🟪⬛━━━━━
❇️ Follow notification about periodical View
💥 Do Comment for Stock WEEKLY Level Analysis.🚀
📊 Do you agree with this view?
✈️ HIT THE PLANE ICON if this technical observation resonates with you. It will Motivate me.
━━━━━🟥🟧🟨🟩🟦🟪⬛━━━━━
💡 If You LOOKING any CHART & want for Level and ANALYZE?
Share your desired stock names in the comments below! I will try to analyze the chart Levels, patterns and share my technical view (so far my Knowledge).
If Viewers think It can identify meaningful setups. Looking forward to hearing from all of you — let's keep this discussion going and help each other make better trading decisions.
___________🔕^^^⚫⚪^🙏🏼🙏🏼🙏🏼^⚪⚫^^^🔔___________
NIFTY DAILY / Short Range Level Analysis for 08th Jul 2026🔕 SGMN SplD BULLISH Above => 24430.
🔕 SGMN SplD Bearish BELOW => 24334.
Mentioned analysis based on 2 consecutive candle close in 15 min Time Frame.
━━━━━🟥🟧🟨🟩🟦🟪⬛━━━━━
💥Level Interpretation / description:
✍🏻L#1: If the candle crossed & stays above the “Buy Gen”, it is treated / considered as Bullish bias. Cfm=> Confirmation.
L#2: Possibility / Probability of REVERSAL near 🔕RL/TF1 & 🔔RL/TF2
L#3: If the candle stays above “Sell Gen” but below “Buy Gen”, it is treated / considered as Sidewise. Aggressive Traders can take Long position near “Sell Gen” either retesting or crossed from Below & vice-versa i.e. can take Short position near “Buy Gen” either retesting or crossed downward from Above.
L#4: If the candle crossed & stays below the “Sell Gen”, it is treated / considered a Bearish bias.
L#5: Possibility / Probability of REVERSAL near 🔕RL/TF1 & 🔔RL/TF2
HZB (Buy side) & HZS (Sell side) => Hurdle Zone,
✍🏻 *** Specialty of “HZB#1, HZB#2 HZS#1 & HZS#2” is Sidewise (behaviour in Nature)
Rest Plotted and Mentioned on Chart
Color code Used:
Green, BLUE =. Positive bias.
Safron, RED =. Negative bias.
RED in Between Green means Trend Finder / Momentum Change
/ CYCLE Change and Vice Versa.
Notice One thing: HOW LEVELS are Working.
Use any Momentum Indicator / Oscillator or as you "USED to" to Take entry.
━━━━━🟥🟧🟨🟩🟦🟪⬛━━━━━
⚠️ DISCLAIMER:
The information, views, and ideas shared here are purely for educational and informational purposes only. They are not intended as investment advice or a recommendation to buy, sell, or hold any financial instruments. I am not a SEBI-registered financial adviser.
Trading and investing in the stock market involves risk, and you should do your own research and analysis. You are solely responsible for any decisions made based on this research.
"🔔As HARD EARNED MONEY IS YOUR's, So DECISION SHOULD HAVE TO BE YOUR's".
━━━━━🟥🟧🟨🟩🟦🟪⬛━━━━━
❇️ Follow notification about periodical View
💥 Do Comment for Stock WEEKLY Level Analysis.🚀
📊 Do you agree with this view?
✈️ HIT THE PLANE ICON if this technical observation resonates with you. It will Motivate me.
━━━━━🟥🟧🟨🟩🟦🟪⬛━━━━━
💡 If You LOOKING any CHART & want for Level and ANALYZE?
Share your desired stock names in the comments below! I will try to analyze the chart Levels, patterns and share my technical view (so far my Knowledge).
If Viewers think It can identify meaningful setups. Looking forward to hearing from all of you — let's keep this discussion going and help each other make better trading decisions.
___________🔕^^^⚫⚪^🙏🏼🙏🏼🙏🏼^⚪⚫^^^🔔___________ NIFTY DAILY / Short Range Level Analysis for 08th Jul 2026
INFO EDGE The stock has already delivered a strong breakout. Instead of chasing the rally, it would be prudent to wait for a healthy retest before considering a fresh entry.
Ideal Buy Zone: ₹1,085–1,090
Stop Loss: Below ₹985
Target: ₹1,380–1,400 and above
Patience is key. Allow the stock to retrace toward the suggested buy zone and confirm support before entering the trade. Always manage your position size according to your risk tolerance.
This analysis is for educational purposes only and should not be considered investment advice. Please conduct your own research before making any investment decisions.
Nifty Intraday Analysis for 07th July 2026NSE:NIFTY
The uptrend will likely continue, but expect volatility due to the weekly option expiry.
The upward movement may lead to 24650 – 24700 resistance range and if the index crosses and sustains above this level then may reach near 24900 – 24950 range.
On the contrary, a downward moment may drag the Index to 24200 – 24150 support range in downward momentum and if this support is broken then index may tank near 23950 – 23900 range.
Banknifty Intraday Analysis for 07th July 2026NSE:BANKNIFTY
The uptrend is expected to continue; therefore, any gap-down opening will be seen as a fresh entry opportunity.
The upward moment may lead the Index to 58900 – 59000 resistance range in upward momentum and if the index crosses and sustains above this level then may reach near 59600 – 59700 range.
On the contrary, a downward moment may drag the Index to 57700 – 57600 support range in downward momentum and if this support is broken then the index may tank near the 57000 – 56900 range.
Finnifty Intraday Analysis for 07th July 2026NSE:CNXFINANCE
The uptrend is expected to continue; therefore, any gap-down opening will be seen as a fresh entry opportunity.
The upward movement may lead the Index to 27250 - 27300 resistance range and if the index crosses and sustains above this level then may reach near 27550 - 27600 range.
On the contrary, a downward moment may drag the to 26750 – 26700 support range and if this support too is broken then index may tank near 26450 – 26400 range.
Midnifty Intraday Analysis for 0 7th July 2026NSE:NIFTY_MID_SELECT
The uptrend is expected to continue; therefore, any gap-down opening will be seen as a fresh entry opportunity.
The upward movement may lead the Index near 14775 – 14800 resistance range and if the index crosses and sustains above this level then may reach 14975 – 15000 range.
On the contrary, a downward moment may drag the index to 14475 – 14450 support range and if this support is broken then index may tank near 14275 – 14250 range.
PREDICTION ON BTCUSD 4H TFBITSTAMP:BTCUSD is currently trading inside a high-probability reversal area, which also aligns with a major Support-Resistance (SR) interchange level. This is a significant zone because it previously acted as support before turning into resistance, and from this exact region the market experienced a strong impulsive decline. The current retest suggests that sellers may once again defend this level.
The rejection around the reversal area strengthens the bearish case for the week. If this resistance continues to hold, the market could begin forming lower highs and lower lows, shifting momentum back in favor of the bears.
The overall expectation for this week remains bearish, with the current rejection from the reversal area serving as the primary confirmation. As long as price remains below the SR interchange zone, the path of least resistance appears to be to the downside.
A temporary bullish retracement cannot be ruled out. If buyers manage to regain some momentum, the most probable retracement target would be around the 50% level of the projected bearish move. This area could provide another opportunity for sellers to step back into the market before the next leg down.
If the bearish scenario unfolds as expected, BTC could continue its decline toward the Major Support Zone highlighted on the chart. This area has historically acted as a strong demand zone where price has repeatedly produced meaningful bullish reactions. A move into this region would be a logical destination for the current bearish structure and may become the next area to monitor for a potential trend reversal or significant bounce.
NIFTY at very crucial zone!As we can see NIFTY is back at very crucial zone which is both an important supply zone and a psychological level. Since, this zone has been tested multiple times now, making it weaker hence we can expect a strong upmove if NIFTY manages to close above the given zone. Until the NIFTY can remain sideways to volatile so plan your trades accordingly and keep watching everyone.
AUDUSD getting ready for a rally?After a decline of 5.6% that we saw form 6th may 2026 to 30th June 2026, price has formed a bottoming formation at a strong Support, from where it has seen bounce backs earlier, after the breakout of the bearish trendline and sustaining comfortably above the neckline we might expect a good rally from the current levels.
Important levels:
0.6921 is an immediate support and below it 0.6883 can act as strong support. where as no any significant resistance is seen below 0.7041.
Structurally AUDUSD seems to be transforming form bearish to bullish.
In summary: Bullish for upcoming days but for fresh entries wait for the pullbacks!
For Educational Purposes only, Not an Investment Advice, Always use strict Risk management measures.
Regards CrazyTrades247.