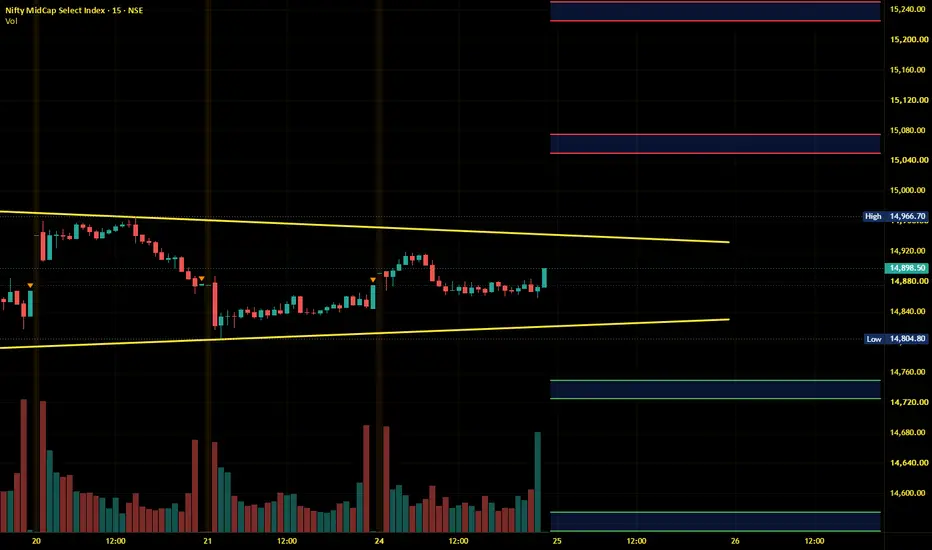
Midnifty Intraday Analysis for 27th August 2026NSE:NIFTY_MID_SELECT
Index has resistance at 15000 strike and uptrend will be formed only if index breaks and sustains 15000 decisively.
The upward movement may lead the Index near 15100 – 15125 resistance range and if the index crosses and sustains above this level then may reach 15275 – 15300 range.
On the contrary, The downward moment may drag the index to 14800 – 14775 support range and if this support is broken then index may tank near 14625 – 14600 range.
Supply and Demand
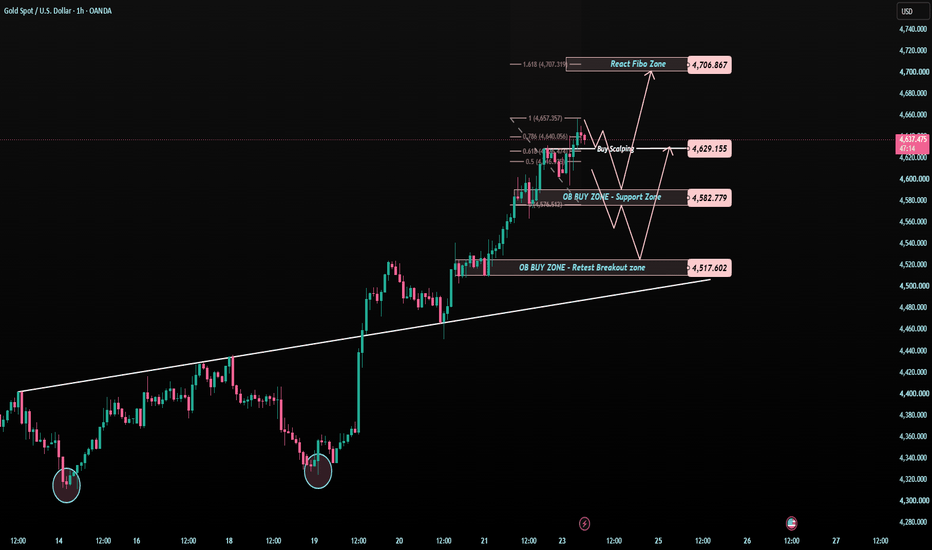
XAUUSD — 4,629 Holds, 4,706 Opens?Gold is still moving inside a strong bullish structure after the recent breakout and trendline recovery.
Price is now trading around 4,630, right near the short-term Buy Scalping reaction area.
This is where the chart becomes interesting.
The market is bullish, but after a strong push, I do not want to chase the candle blindly.
I want to see whether buyers can protect the support zones first.
The simple read
4,629 is the first important reaction zone today.
If gold holds above this area,
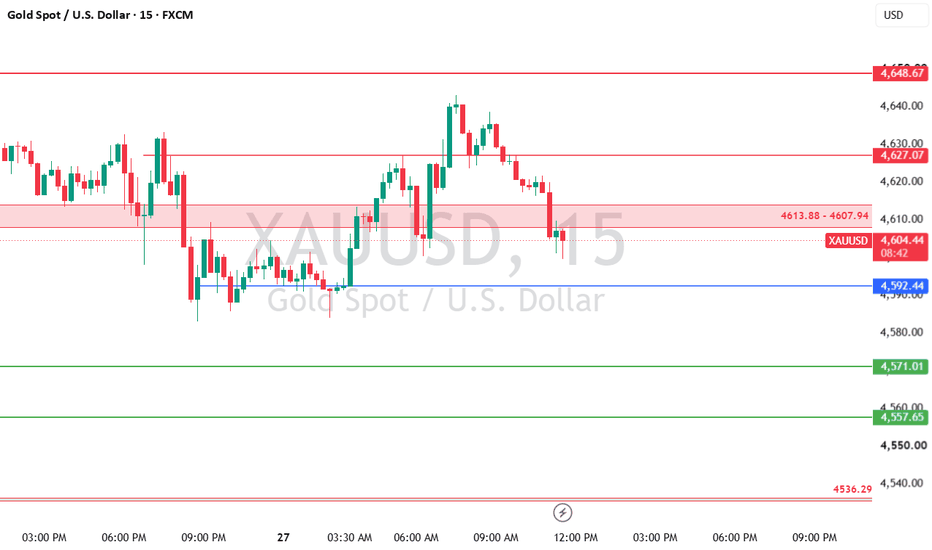
XAUUSD LEVELS INTRADAY | 27-08-2026Gold is trading around $4,604. The price is squeezed inside a shaded range ($4,607.94 – $4,613.88). Think of this range as neutral ground: buyers and sellers are competing for control, and a break out of this box will dictate the next big move.
Upside Targets (Resistance / Sellers' Territory)
If price breaks above the neutral zone, expect buyers to push higher toward these targets:
$4,613.88 – $4,627.07: Immediate resistance. A candle closing above $4,613 confirmation that buyers are stepping
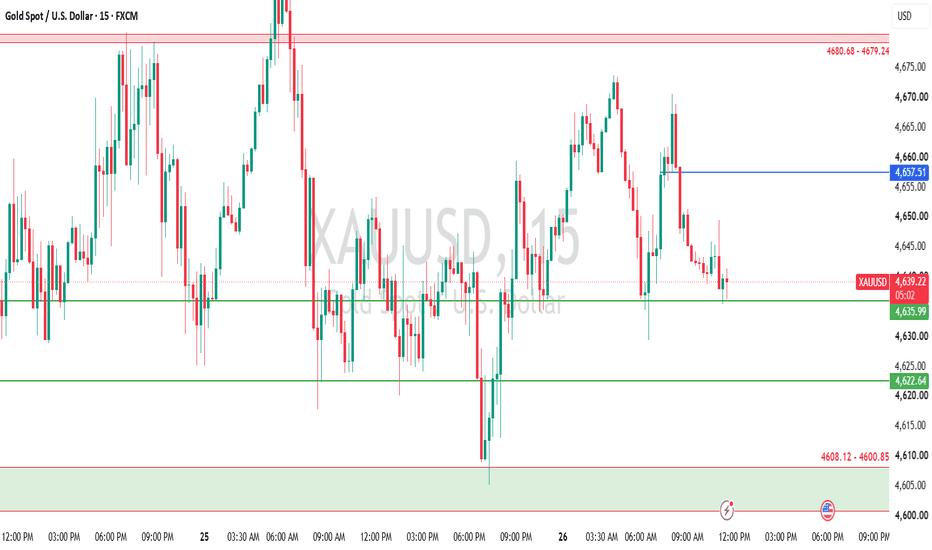
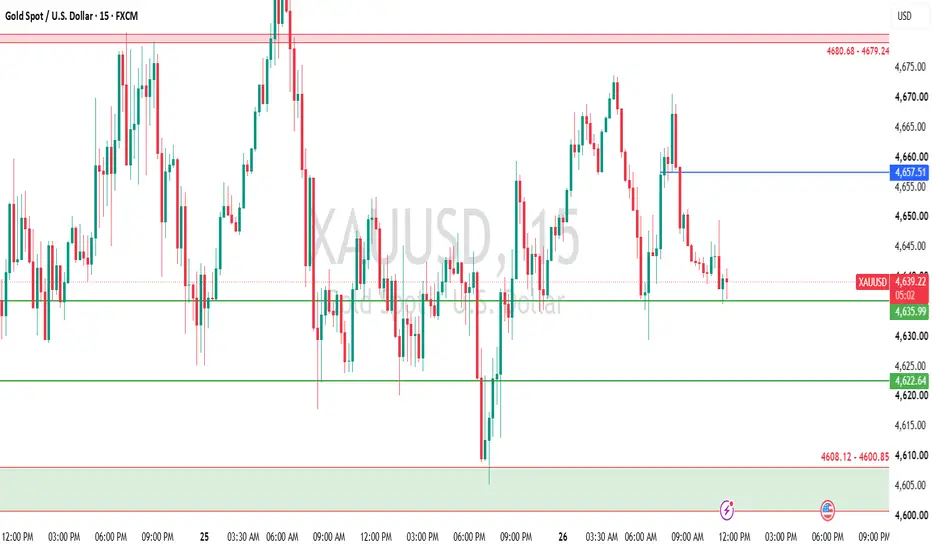
Gold Intraday Levels | 26 August 2026Gold (XAUUSD) is trading around 4638 today, and these are the key intraday levels generated by TheBullTargets Levels Technology.
🔴 Resistance Zone
• 4680.68 – 4679.24 — Major resistance zone
• 4657.51 — Immediate resistance / decision level
🟢 Support Levels
• 4635.99 — Immediate support
• 4622.64 — Next important support
• 4608.12 – 4600.85 — Major support zone
At the current price, 4635.99 is an important level to watch. Holding above it can keep the short-term structure stronger, while a decis
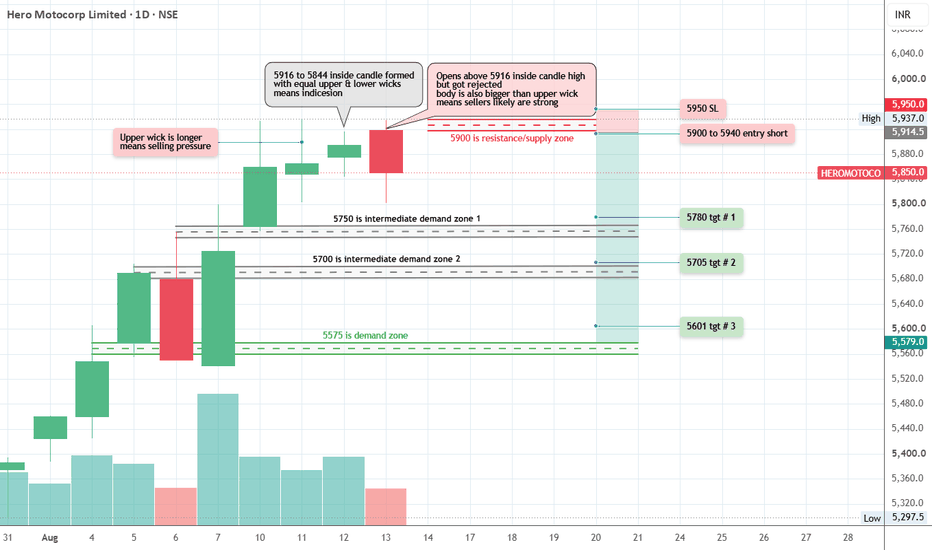
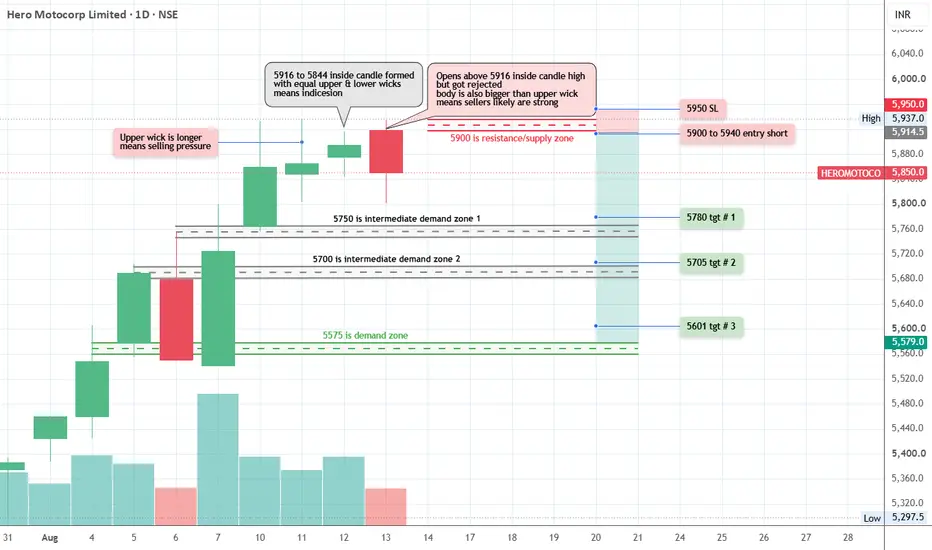
HeroMoto Price Action Analysis - Daily TF4 days of repeated attempts to cross 5900 seem to be getting rejected.
Upper wicks show 5900 levels as sellers area.
Last time we saw sell-off and immediate buying was near 5575 level.
The 5900 to 5600 can be seen with negative bias keeping SL at 5950.
Intermediate targets are 5750-5700 and final one is 5600
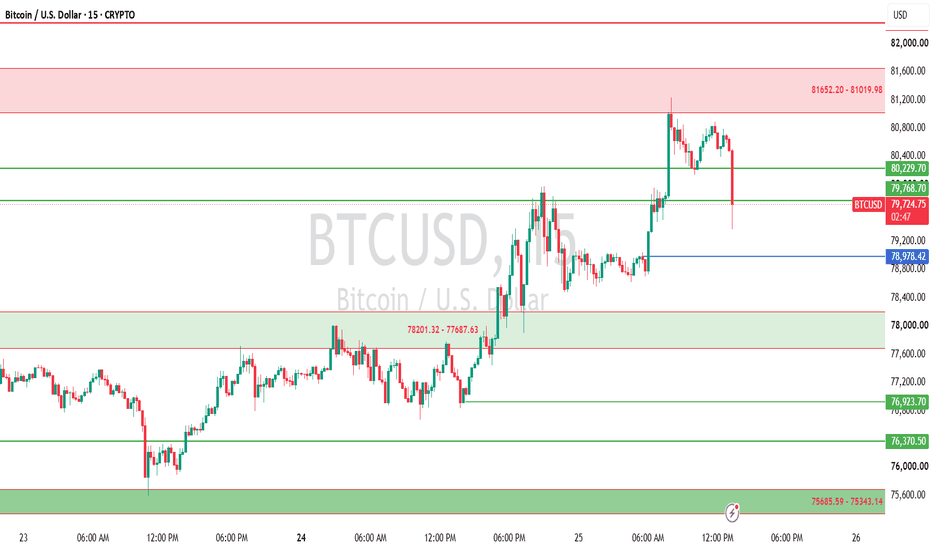
BTCUSD (15-Min Chart) — Supply & Demand Analysis |25 August 2026
BTCUSD is trading around 79,677, pulling back after a rejection from the top resistance. Overhead, Major Supply Zone (81,019.98 – 81,652.20) caps intermediate upside momentum, with immediate resistance sitting at 80,229.70. On the downside, price is testing key pivot support at 78,978.42, backed by Strong Demand Zone 1 (77,687.63 – 78,201.32), while deeper structural support lies at Major Demand Zone 2 (75,343.14 – 75,685.59).
For trade execution, bullish continuation setups look to buy pullba
XAUUSD GOLD ANALYSIS ON (26/08/2026)#XAUUSD UPDATEDE
SELL LIMITED 4670-4680
If price stay below 4720, then next target 4600,4520 and 4400,4325 and above that 4780,4850
Plan;If price break 4680-4690 area,and stay below 4720,we will place sell order in gold with target of 4600,4520 and 4400,4325 & stop loss should be placed at 4720
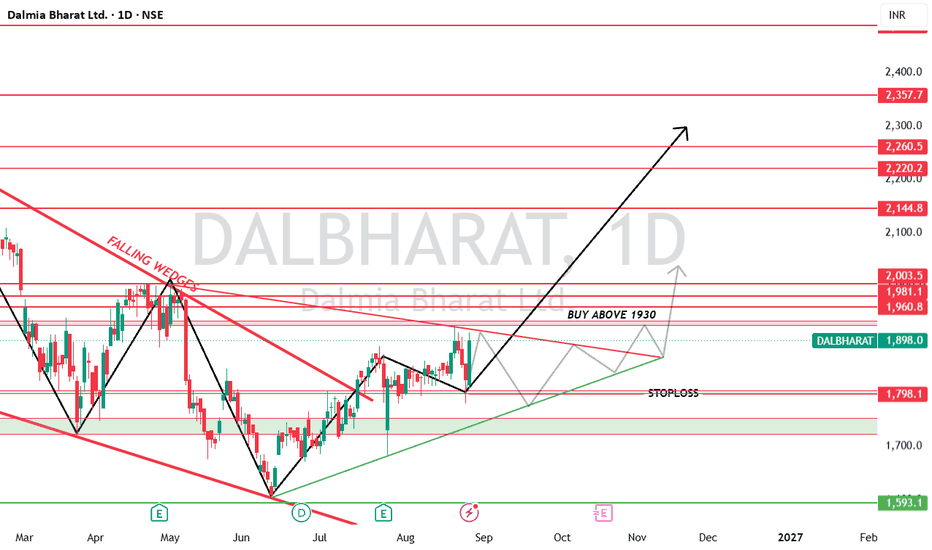
Dalmia Bharat Ltd. (DALBHARAT) — Daily Chart Technical BreakdownTrade Setup
Trigger: Buy above ₹1,930 (Confirmation of wedge breakout)
Current Market Price: ₹1,898.00 (+4.06%)
Stop Loss: ₹1,798.10 (Placed below key support/swing low)
Key Technical Factors
Pattern Formation: The stock has formed a falling wedge pattern and is approaching a decisive upside breakout.
Trend Structure: Price action shows higher-low formation after bottoming around ₹1,593, indicating renewed buying momentum.
Volume & Momentum: Recent green candles display st
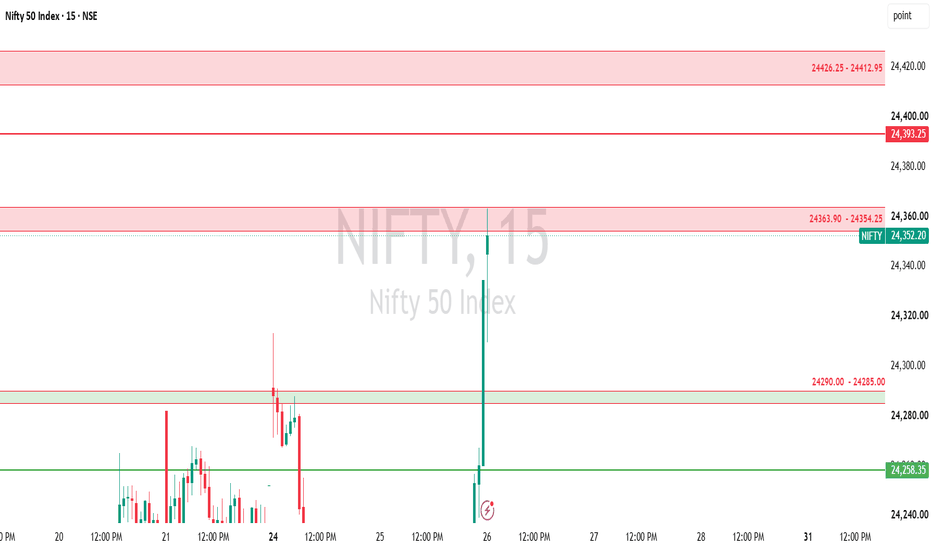
NIFTY 50 15-minute intraday chart NSE:NIFTY Based on your NIFTY 50 15-minute intraday chart, here are the key technical levels to watch for upcoming trades:
Key Resistance Levels
Immediate Resistance: 24,354 – 24,364 (Current price tested high near 24,357; holding above this zone targets higher resistance).
Upside Target / Major Resistance: 24,393 – 24,426 (Upper red zone on the chart).
Key Support Levels
Immediate Support: 24,285 – 24,290 (Previous swing level / red support zone).
Key Base Support: 24,258 (Green line mar
Nifty Intraday Analysis for 26th August 2026NSE:NIFTY
The index is overbought and expected to cool down in the short term. However, the index is in the 24200 - 24500 range and a trend is expected to be formed if the index breaks and sustains either side of the range.
The upward movement may lead to 24550 – 24600 resistance range and if the index crosses and sustains above this level then may reach near 24800 – 24850 range.
On the contrary, The downward moment may drag the Index to 24125 – 24075 support range in downward momentum
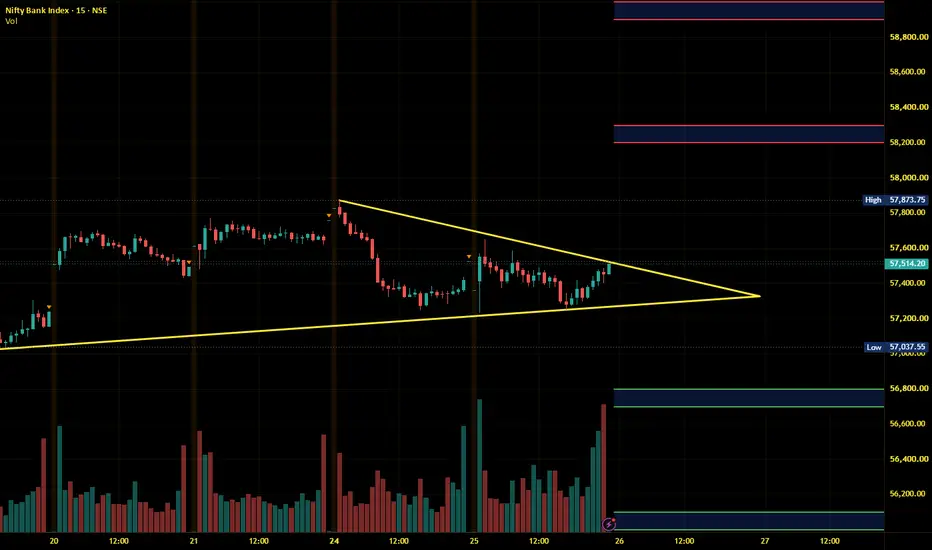
Banknifty Intraday Analysis for 26th August 2026NSE:BANKNIFTY
Highest Calla and Put OI is at 57500 strike which will act as make or break level. If Index sustains 57500 level then uptrend is expected to continue.
The upward moment may lead the Index to 58200 – 58300 resistance range in upward momentum and if the index crosses and sustains above this level then may reach near 58900 – 59000 range.
On the contrary, The downward moment may drag the Index to 56800 – 56700 support range in downward momentum and if this support is broken then
Finnifty Intraday Analysis for 26th August 2026NSE:CNXFINANCE
Index is near 26000 - 26100 support range and if Index breaks and sustains 26300 level then uptrend is expected to continue.
The upward movement may lead the Index to 26500 - 26550 resistance range and if the index crosses and sustains above this level then may reach near 26800 - 26850 range.
On the contrary, The downward moment may drag the to 26000 – 25950 support range and if this support too is broken then index may tank near 25700 – 25650 range.
Midnifty Intraday Analysis for 26th August 2026NSE:NIFTY_MID_SELECT
Highest Calla and Put OI is at 15000 strike which will act as make or break level. However, the Index is overbought and expected to cool down before an uptrend.
The upward movement may lead the Index near 15150 – 15175 resistance range and if the index crosses and sustains above this level then may reach 15325 – 15350 range.
On the contrary, The downward moment may drag the index to 14850 – 14825 support range and if this support is broken then index may tank near 14
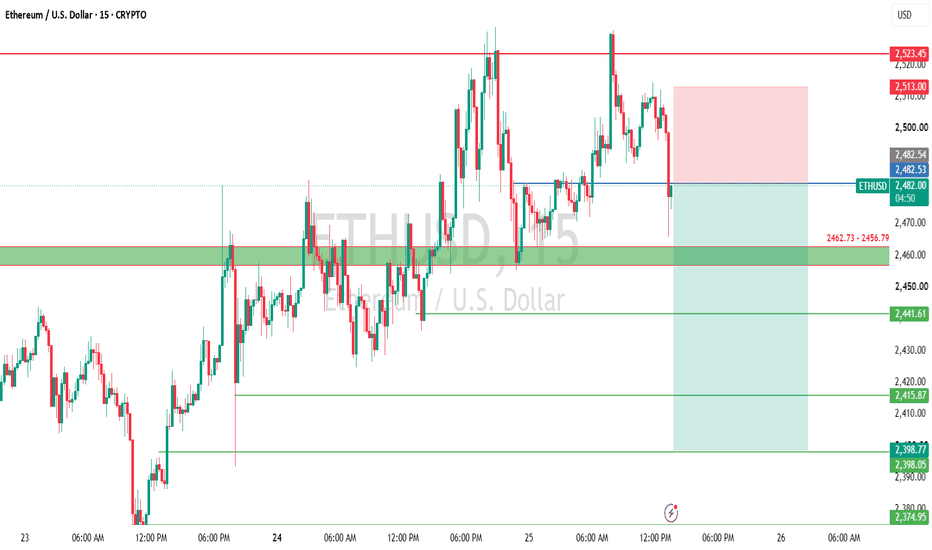
$ETHUSD Based on your current 15-minute ETH/USD chartBITSTAMP:ETHUSD Based on your current 15-minute ETH/USD chart, here are the immediate short-term downside support levels to watch if price breaks down below the current range ($2,480):
Immediate Demand Zone: $2,462.73 – $2,456.79 (highlighted green band on your chart)
First Downside Target: $2,441.61
Second Downside Target: $2,415.87
Third Downside Target: $2,398.05
Major Lower Target: $2,374.95
If you're opening a short position, keep an eye on immediate overhead resistance around $2,482.53
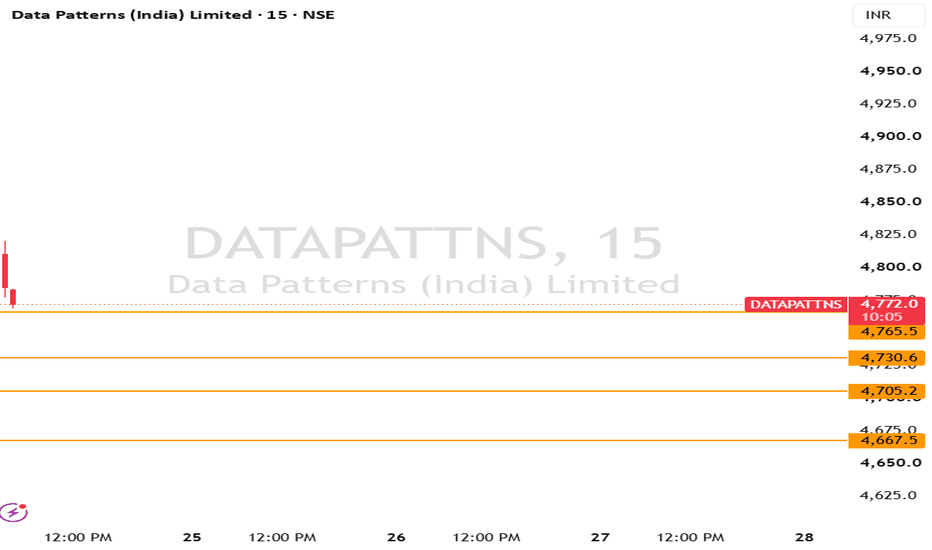
DATAPATTNS 15M: Key Overhead Rejection Signals Bearish RetracemeData Patterns (India) Limited (DATAPATTNS) on the 15-minute timeframe is trading near 4,774.0, down -1.16% intraday after rejecting from top resistance levels. Price is facing selling pressure, opening up a pullback toward lower support levels.
Immediate Supply Zone (4,783 – 4,810): Primary overhead resistance. The recent rejection near 4,783.4 marks local resistance, serving as the invalidation level for short intraday retest setups.
Immediate Support (4,765.5): First downside target and loca
SIGNS of BULLISNESS?As we can see NIFTY has shown a strong closing by forming a bullish engulfing candle, showing that the bulls have taken control. Now that we can closed above previous weeks closing, we can expect NIFTY to remain bullish for coming trading sessions. So, plan your trades accordingly and keep watching everyone.
Nifty Intraday Analysis for 25th August 2026NSE:NIFTY
Volatility expected on NSE F&O August Month expiry day. However, the Index is expected to be in the 24000 - 24300 range.
The upward movement may lead to 24450 – 24500 resistance range and if the index crosses and sustains above this level then may reach near 24700 – 24750 range.
On the contrary, The downward moment may drag the Index to 24000 – 23950 support range in downward momentum and if this support is broken then index may tank near 23750 – 23700 range.
Banknifty Intraday Analysis for 25th August 2026NSE:BANKNIFTY
Volatility expected on NSE F&O August Month expiry day. However, the Index is expected to be in the 57000 - 58000 range.
The upward moment may lead the Index to 58200 – 58300 resistance range in upward momentum and if the index crosses and sustains above this level then may reach near 58900 – 59000 range.
On the contrary, The downward moment may drag the Index to 56800 – 56700 support range in downward momentum and if this support is broken then the index may tank near the
Finnifty Intraday Analysis for 25th August 2026NSE:CNXFINANCE
Volatility expected on NSE F&O August Month expiry day. However, the Index is expected to be in the 25900 - 26400 range.
The upward movement may lead the Index to 26400 - 26450 resistance range and if the index crosses and sustains above this level then may reach near 26700 - 26750 range.
On the contrary, The downward moment may drag the to 25900 – 25850 support range and if this support too is broken then index may tank near 25600 – 25550 range.
Midnifty Intraday Analysis for 25th August 2026NSE:NIFTY_MID_SELECT
Volatility expected on NSE F&O August Month expiry day and swing on either side if the index decisively moves and sustains 14900 - 15000 range.
The upward movement may lead the Index near 15050 – 15075 resistance range and if the index crosses and sustains above this level then may reach 15225 – 15250 range.
On the contrary, The downward moment may drag the index to 14750 – 14725 support range and if this support is broken then index may tank near 14575 – 14550 rang
NIFTY 50(15-Min Chart) — Supply & Demand Analysis 25 August 2026The Nifty 50 Index on the 15-minute timeframe is trading near 24,187, consolidating in a tight range between immediate intraday supply zones and localized demand clusters. On the upside, primary resistance is defined by Major Supply Zone 1 (24,307.80 – 24,320.00) and Major Supply Zone 2 (24,354.35 – 24,364.70), which mark strong institutional selling interest and cap intermediate bullish momentum. Right above current price levels, minor supply bands at 24,206.45 – 24,218.85 and 24,279.35 – 24,28
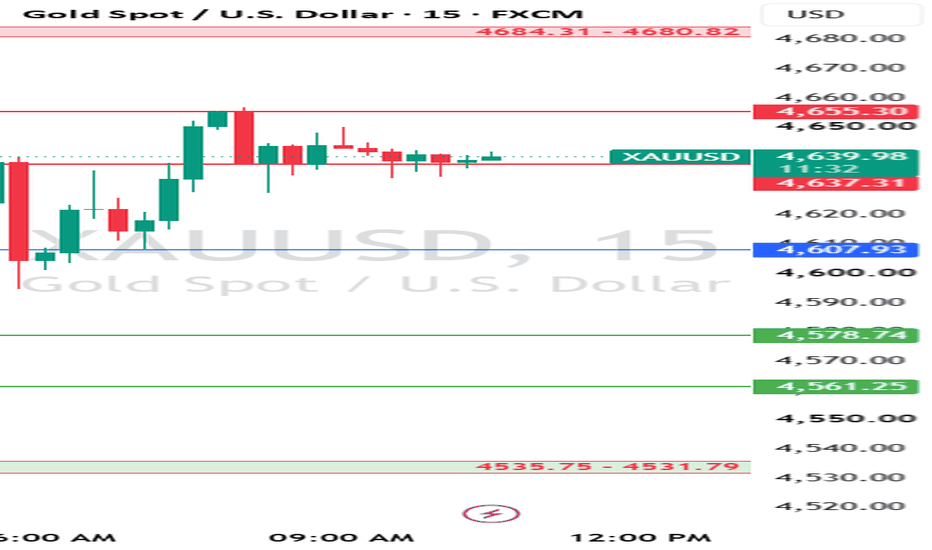
Gold (XAUUSD): Bullish-to-Neutral Setup Prepares for Next ExpansGold (XAUUSD) on the 15-minute timeframe is currently consolidating around the 4,635 – 4,640 area following an intraday impulse move. The broader structure remains bullish-to-neutral, with price coiling near intermediate resistance while setting up potential support retests before the next expansion leg higher.
Immediate Supply Zone (4,655 – 4,665): Primary overhead resistance. A decisive 15m candle close above 4,655 will serve as the immediate trigger confirming bullish continuation toward ext
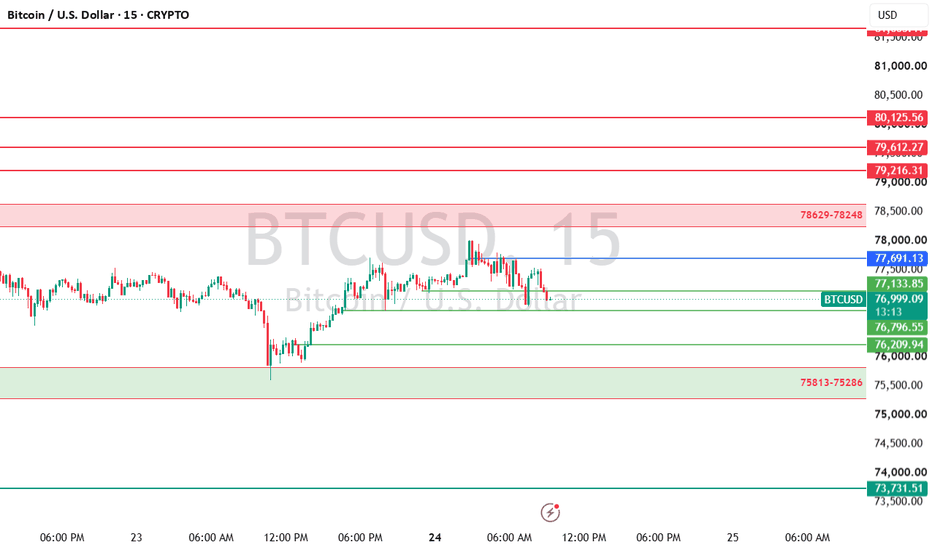
BTCUSD 15M: Key Support Retest Holds Before Bullish ContinuationBitcoin (BTCUSD) on the 15-minute timeframe is currently consolidating around the 76,970 – 77,000 area following a local rejection from overhead resistance. The broader bias remains firmly bullish, but price action is setting up a short-term pullback into a lower demand band before the next major expansion leg takes off.
Immediate Supply Zone (77,130 – 77,690): Primary overhead resistance. A decisive 15m candle close above 77,130 will serve as the immediate trigger confirming bullish cont