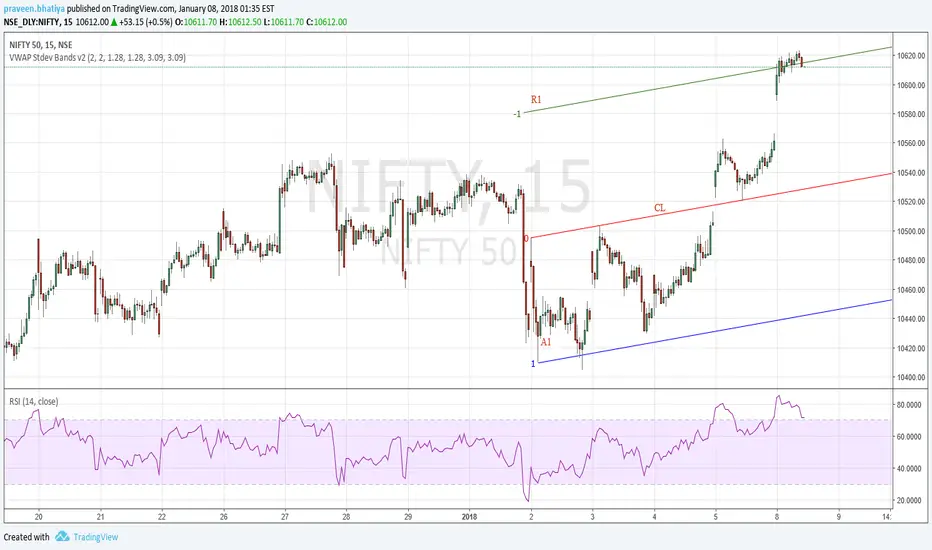
Trading a supply zone tucked above...On Daily chart, 2 Supply Zones (SZ) were formed above one another. Going deeper to see if there is any supply level to go for an intraday short, came across this 15 min SZ.
Caveat: Prices are retracing from a Demand Zone (DZ) on weekly chart. It can act as an obstacle for this trade demo.
Disclaimer: Ideas published here are for information purposes only and do not advocate any buy or sell recommendations
Supply Zone
Short at Reaction Zone Action/Reaction set is suggesting that the price has reached at the level where a reaction is expected. This setup is more reliable if the CL is passing thru a gap. One can take advantage of this setup in their trading either by booking profit in their existing long position or by initiating a fresh short trade here. Newton Law of physics works nicely on prices also, one can observe.
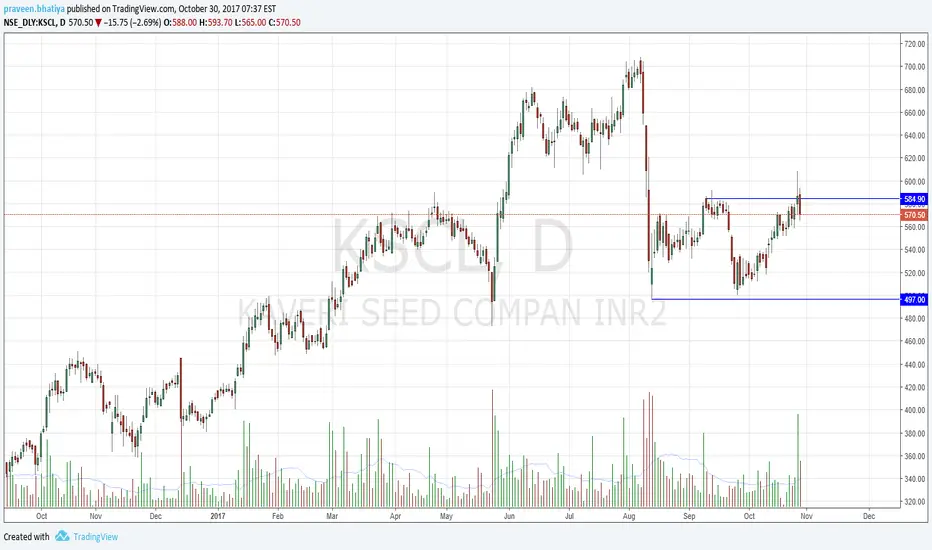
SHORT : Victor Sperandeo 2B Pattern Price formation qualifies of a short as per Victor Sperandeo 2B Pattern. Price closed above the previous high yesterday with good volume but got rejected immediately and closed below to low of yesterday. We can short the stock with stop loss of just today's high. Risking the small amount gives an opportunity for a decent Risk to Reward ratio.
Short - Bank of BarodaHi! I trade NSE stocks using Demand and Supply zone strategy, mostly in Weekly time frame.
Here's a trading plan for NSE:BANKBARODA
Weekly location: Equilibrium
Daily trend: Down (Let's short)
Hourly zones: Supply zone marked on chart
Trade duration (max): 1 month
Note: Target, Entry and SL on chart
VOLTAS: Trading a DZ with Up TrendVoltas has been making all time high and is in an Up Trend. As a trader we would like to buy with the trend. Here on 60 min we can see:
Rally, Basing (Pause) and again a Rally; A Demand Zone Pattern which can be used as a Long Strategy.
Disclaimer: Ideas published here are for information purposes only and do not advocate any buy or sell recommendations
HCC trading in a channelHi! I trade NSE stocks using Demand and Supply zone strategy, mostly in Weekly time frame.
Here's a trading plan for HCC
Weekly location: Equilibrium
Daily trend: Down (we can short or long depending on price)
Hourly zones: Demand & supply zones marked on chart
Trade duration (max): 1 week
Note: Target, Entry and SL on chart
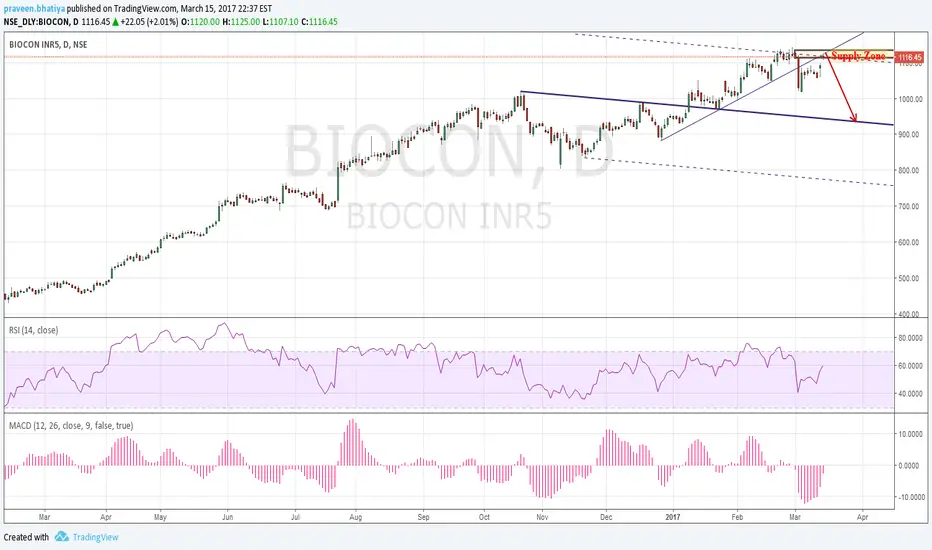
Biocon Potential short Action/Reaction Andrews Action/Reaction method has suggested a short and it made Big Red candle showing the selling pressure at that level. It has also broken the short term trend line telling the weakness at least in short term. Prices are retesting the Supply Zone and trend line from below, so one can put the stock into their radar and short the stock on seeing the weakness.
Ashok Leyland Potential Short !Similar to my idea of Tata Global this stock is showing good frequencies around the Pitchfork so I am looking for a short on retesting the upper Median Line. If recent election result creates an euphoric rally, climbing the price to the supply zone I would short the stock with Stop Loss of 96. Please put it into your watch list and to take timely action.