Long
Long
BHARAT FORGE LTD. – INTRADAY ZONE ANALYSIS________________________________________________________________________________
📈 BHARAT FORGE LTD. – INTRADAY ZONE ANALYSIS
📆 Date: July 1, 2025 | ⏱ Timeframe: 15-Minute Chart
🔍 Educational Breakdown – For Learning & Study Use Only
________________________________________________________________________________
🔹 Price Action Zones
🔴 Top Range(Resistance): 1324.50
🟢 Bottom Range(Support): ₹1270
⚪ No Trade Zone: Mid-range, no clear directional bias
________________________________________________________________________________
🧩 Chart Pattern: No
There is no visible or marked chart pattern (e.g., flag, triangle, head and shoulders) on the chart.
________________________________________________________________________________
🔁 Reversal Candlestick Patterns:
🔴 Top Range: No visible reversal candle pattern at the supply zone on this chart snapshot, but the area has been marked for potential rejection.
🟢 Bottom Range: No textbook reversal candlestick (like pin bar, hammer, or engulfing) is clearly visible at ₹1270. However, the price bounced strongly from this level, indicating possible short-term support or buyer interest.
________________________________________________________________________________
🧠 1. Trade Plan (Based on Reason and Logic)
🔼 Bullish Trade:
Idea: If price retests ₹1270 and forms a bullish structure (strong bullish candle, reversal candles, volume support, long wick)
Stop Loss: Below ₹1269
Risk-Reward: 1:1 | 1:2+
Logic: you need to give an actual logic to this
________________________________________________________________________________
🔽 Bearish Trade:
Idea: If price rejects 1324.50 and forms a bearish structure (strong bearish candle, reversal candles, volume support, long wick)
Stop Loss: ₹1325
Risk-Reward: 1:1 | 1:2+
Logic: Historically rejected area as marked on chart.
________________________________________________________________________________
📦 2. Trade Plan Based on Demand/Supply Zones
🟥 Supply Zone Trade:
Zone: ₹1293.30 – ₹1299.90
SL: ₹1301.45
Plan: Trade the Supply Zone (only on rejection confirmation)
Risk-Reward: 1:1 | 1:2+
🟩 Demand Zone: No defined demand zone.
________________________________________________________________________________
📌 Disclaimer
This analysis is shared for educational and study purposes only. It does not constitute investment advice. The author is not SEBI-registered. Please consult a SEBI-registered advisor before making trading decisions. Always use proper risk management and trade only with confirmation.
________________________________________________________________________________
💬 Comments
What’s your view on Bharat Forge?
Will it reject from the supply zone or hold the bottom range?
Share your charts or thoughts below 👇
________________________________________________________________________________
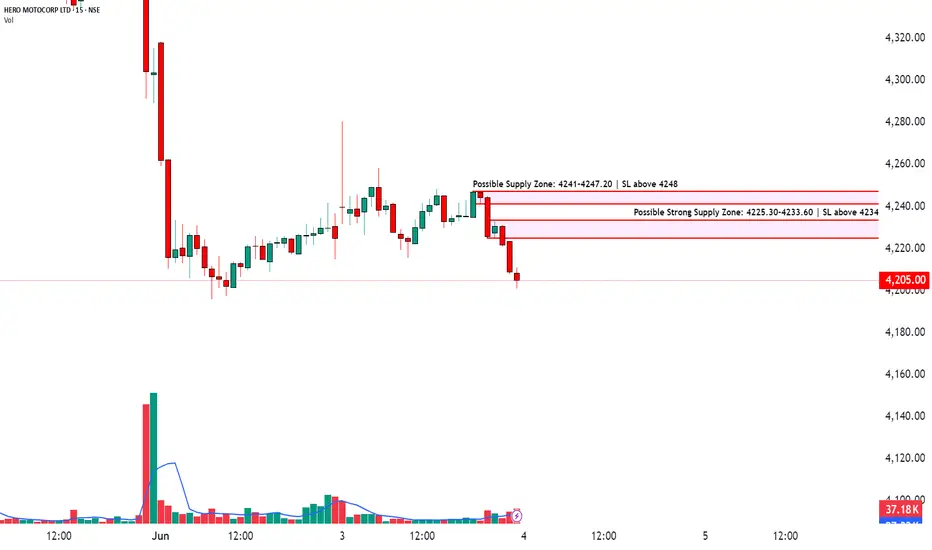
Identify Strong Supply Zones & Set Targets with RRR Logic📈HERO MOTOCORP LTD | 15-Min Chart Analysis
📆Date: June 3, 2025
Ticker: NSE:HEROMOTOCO
Price: ₹4,205.00
Chart Overview:
The chart shows a clear intraday rejection from a key supply zone followed by strong bearish price action. A decisive move below ₹4,220 indicates supply pressure.
Two critical supply zones are marked:
Possible Strong Supply Zone: 4225.30–4233.60 | SL above 4234
Possible Supply Zone: 4241–4247.20 | SL above 4248
Price is currently trading around ₹4,205, just below these zones, signaling a potential continuation of the short-term bearish trend.
Supply Zone Breakdown:
🟥🟥 Strong Supply Zone (4225–4233):
Multiple wick rejections seen previously.
Ideal for aggressive short entries with tight SL above 4234.
🟥 Upper Supply Zone (4241–4247):
Acts as a secondary resistance.
Conservative short traders can consider this zone with SL above 4248.
How to Trade Supply & Demand Zones:
When to Enter (Short Trade from Supply Zone):
Wait for price to retest the supply zone.
Watch for bearish confirmation candles like shooting stars, bearish engulfing, or rejections with volume.
Enter short near the top of the supply zone.
Keep a tight stop-loss just above the zone.
Stop-Loss Placement:
For Strong Supply Zone: SL above ₹4234.
For Higher Supply Zone: SL above ₹4248.
Targets: Book profits at logical RRR levels (1:2 or 1:3 for high probability setups).
Why Use Risk-Reward?
Helps you define targets objectively.
Protects capital with fixed stop-loss logic.
Avoids emotional exits; everything is pre-planned.
⚠️ Risk Management Tip: Always trade with a clearly defined stop loss. Avoid entering positions impulsively. It is advisable to start with a smaller quantity and increase your exposure only if the price action confirms the continuation of the trend. Capital protection should always be the priority.
📢 Disclaimer
This content is created purely for educational and informational purposes. It is not intended as investment advice, stock recommendations, or trading tips. Trading and investing in the stock market involves risk. Please consult with a SEBI-registered financial advisor before making any investment decisions. The author/creator is not registered with SEBI and shall not be held responsible for any losses incurred based on this information. Always do your own research and use proper risk management.
👉 If you found this analysis helpful, don’t forget to Follow, so you never miss out on a trade-worthy setup, breakout opportunity, or valuable educational insight again. Stay updated and trade smarter! 💡📈  Short
Short
 Long
Long
Nifty Update: Key Supply Zone Test Ahead – Time to Book Partial On 27th February, I shared a detailed analysis explaining why Nifty was likely to take support from the Monthly Demand Zone .
At that time, the entire market was extremely bearish. FIIs were selling heavily, and most people believed that catching the bottom was impossible. But as demand and supply zone traders , we trusted the footprints of smart money—and as expected, Nifty took support exactly at that zone and reversed.
Today, Nifty is trading just below 5% of its all-time high . This shows the power of demand zones, which are not just random boxes but clear evidence of institutional activity.
Now, let's focus on the current market development .
📈 Nifty Nearing a Critical Supply Zone 📉
If you look at the chart, you'll see that Nifty is now approaching a Daily Supply Zone (Drop-Base-Drop) Which have strong follow-through, making this a strong resistance area .
In addition, I’ve marked a Weekly Supply Zone (Drop-Base-Rally) on the chart. Interestingly, the daily supply zone lies inside this weekly supply zone , creating a powerful confluence of resistance. This stacking of zones increases the probability of price facing rejection in this area.
📊 What Should Traders Do?
If you are holding profitable positions in stocks, this could be a good time to book partial profits .
Be prepared for a possible price rejection from the daily and weekly supply zone .
However, it’s not guaranteed that Nifty will fall from here. Price can also break through the zone, but as traders, capital protection comes first .
The most likely scenario is a small pullback , not a major fall. After the pullback, Nifty may resume its upward move.
Always focus on high-probability setups and manage your risk smartly.
📢 Conclusion:
Nifty is at a crucial supply zone cluster. A pullback is likely, so this could be a smart time to lock in some gains. Watch price action closely and adjust your strategy accordingly.
Lastly, Thank you for your support. Feel free to ask if you have questions.
“Trade what you see, not what you hear. The chart always whispers before the news screams.” 📊🔥
This analysis is purely for educational purposes and is not intended as a trading or investment recommendation. I am not a SEBI registered analyst.
 Short
Short
THYROCARE at a Make-or-Break Level: Strong Rejection Expected?🧠 Technical Overview
THYROCARE has recently approached a strong supply zone , which is formed by a classic Drop-Base-Drop structure — footprints of institutional players.
When price enters such zones, it often encounters heavy selling pressure due to pending sell orders placed by big players (smart money). This creates an ideal condition for a potential reversal or correction.
At the current level, there's a clear indication that the stock might face resistance. If you're trader and already holding THYROCARE in your portfolio, this could be a wise area to consider partial or full profit booking .
📊 Key Observations
Strong Supply Zone: Price has entered a well-defined Drop-Base-Drop zone.
Risk Management Tip: Booking profits here can protect gains if the expected rejection plays out.
Short-Term Outlook: A pullback or downward move is likely if supply pressure dominates.
📌 Important Note for Investors
If you're a long-term investor, use this opportunity to assess your risk-reward ratio. This zone could lead to a temporary dip, but keeping an eye on fundamentals alongside technicals will help with bigger decisions.
🔥 Motivational Nugget
"Every great trader was once a beginner who dared to learn, analyze, and act with courage." 🚀💼📉
Lastly, Thank you for your support, your likes & comments. Feel free to ask if you have questions.
This analysis is purely for educational purposes and is not a trading or investment recommendation . I am not a SEBI registered analyst.
Key Levels: Nifty at a Crucial Turning Point! What's Next? Nifty's price structure is showing a clear pattern of lower highs and lower lows, indicating a prevailing downtrend. However, the market is now at an interesting Demand Zone that could determine its next big move.
📊 Key Observations
On January 27, Nifty took support from an old demand zone, and formed new lower high.
This minor reversal also led to the creation of a new demand zone.
Currently, Nifty is approaching this fresh Demand zone & old Demand Zone, making it a highly significant area to watch.
🔍 Possible Scenarios Ahead
Reversal from the Demand Zone : If Nifty respects this demand zones and reverses, we may see a potential bottom forming.
Sideways Consolidation : Nifty may move sideways, indicating indecision before a breakout.
Breakdown Below Demand Zone : If the demand zone is breached, Nifty could make a new lower low, continuing its downward trend.
🔄 What’s Next?
The next few sessions will be crucial in determining whether Nifty finds strength or continues its downward trajectory. Traders should closely monitor price action and key levels to gauge market sentiment.
Lastly, thank you for your support, your likes & comments. Feel free to ask if you have questions.
🌟 “Patience and discipline separate the successful trader from the rest.”
This analysis is for educational purposes only and is not a trading or investment recommendation. I am not a SEBI-registered analyst.
SIYSIL: A Strong Demand Zone Setup with High Reward Potential!When it comes to technical analysis, understanding demand zones can give traders an edge in identifying potential reversal points. Demand zones represent the footprints of institutional players who significantly influence the market. These zones indicate unfilled buy orders, and when the price revisits these areas, institutions tend to buy again, leading to a reversal.
Let's dive into SIYSIL's price action and explore its technical structure!
🌟 Weekly Chart Analysis
SIYSIL is currently displaying a highly structured setup. If we analyze the weekly chart , we can clearly see a well-defined Rally-Base-Rally (RBR) Demand Zone . The strength of this demand zone is reinforced by the fact that it broke a previous significant resistance level and formed an all-time high .
📊 Daily Chart Confirmation
Upon shifting to the daily chart , the same demand zone is clearly visible. A strong follow-through from this zone has resulted in a powerful imbalance, further validating the structure.
Moreover, there are currently no nearby supply zones that could act as resistance, making this demand zone even more significant.
💡 Observations
Act of Polarity: The concept of polarity further strengthens this structure— the previous resistance level has now turned into support , aligning perfectly with the demand zone.
Market Conditions: While this setup appears strong, it's essential to consider the current weakness in the overall market . Even well-defined structures can face challenges in uncertain conditions, so risk management is crucial.
📈 Final Thoughts
SIYSIL presents a structured demand zone setup with multiple confirmations on both the weekly and daily charts. The alignment of the demand zone with previous resistance-turned-support adds a strong layer of confluence.
Lastly, thank you for your support. Feel free to ask if you have questions.
🚀 "A successful trader is not the one who never loses but the one who learns to manage losses."
Disclaimer: This analysis is purely for educational purposes and is not intended as a trading or investment recommendation. I am not a SEBI-registered analyst.
 Long
Long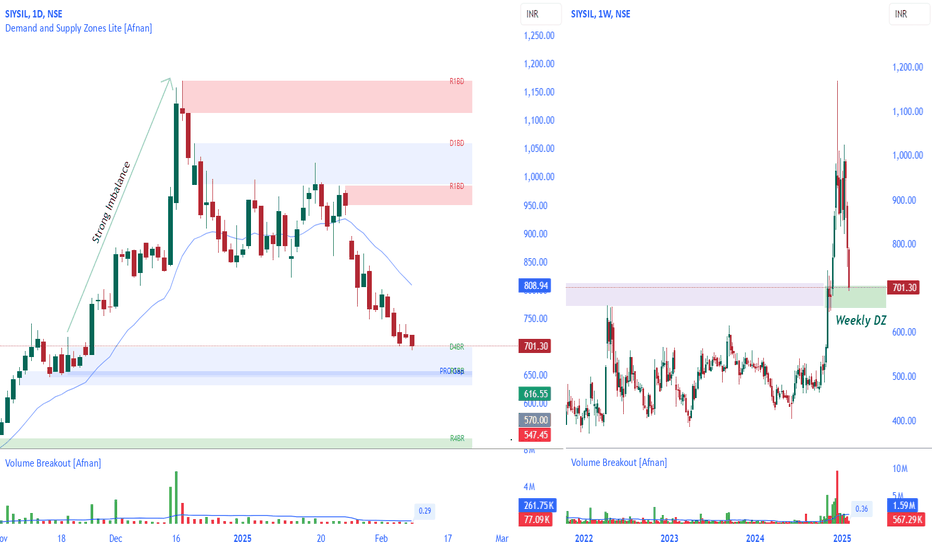
How to define the Daily Bias for the Day? Determining the likely direction of the market for a particular day can be both challenging and cumbersome. Many traders find themselves overwhelmed by the multitude of data points and differing indicators. However, using a structured methodology, one can systematically analyze the chart and create a daily bias for the day.
If you are an intraday trader, you can use a combination of the Daily chart for the bias and the 15-minute chart for the entry, or alternatively, you can use a 75-minute chart for the bias and a 5-minute chart for the entry.
Steps to Identify the Daily Bias
1. Identify the Most Recent Swing High and Swing Low
The first step in defining the daily bias involves identifying the most recent swing high and swing low. This can be done manually, or you can use ready-made indicators available on trading platforms such as TradingView to plot these points on the chart. Understanding swing highs and lows are fundamental concepts in technical analysis, representing the highest and lowest points within a specific time period. These points can indicate potential reversal areas where the market may change direction.
2. Divide the Region into Two Equal Parts
Once the swing high and swing low are identified, the next step is to divide this region into two equal parts. This can be achieved using the rectangle tool in TradingView. Make sure to enable the middle line feature within the rectangle tool to visually divide the two sections. The middle line acts as a crucial reference point, providing a clear visual boundary between areas of perceived higher and lower value.
3. Define Retail and Wholesale Areas
After dividing the region into two parts, the upper section is termed the “Retail Area,” where prices are considered expensive. Conversely, the lower section is called the “Wholesale Area,” where prices are deemed cheap. This concept stems from the basic economic principle of supply and demand, where higher prices in the Retail Area suggest selling opportunities, and lower prices in the Wholesale Area indicate buying opportunities.
4. Focus on Buying and Selling Opportunities
With the areas defined, the next step is to focus on the appropriate trading opportunities. When prices are in the Retail Area, the focus should be on “Selling” opportunities. When prices are in the Wholesale Area, the focus should be on “Buying” opportunities. This methodology, known as “Curve Analysis” or determining your Bias for the day, simplifies the decision-making process by providing a clear framework for evaluating market conditions.
Example: BankNifty 75-Minute Chart
Let’s look at an example to understand this better. Here we have the BankNifty 75-minute chart. We have identified the most recent swing high and swing low on the chart and divided the section into two parts. The current market price is in the Wholesale Area, which means that on your execution time frame, which is 5 minutes, you will be focusing on buying or “Long” opportunities.
Now, proceed to the lower time frame and identify your key levels of interest using support, resistance, demand, supply, or any other technical analysis tools. Observe how the supply zone on the chart played out beautifully and how prices fell from the Retail Area. This example illustrates the practical application of the methodology, demonstrating how historical price movements can inform future trading decisions.
While the above steps provide a solid foundation for defining the daily bias, incorporating the following advanced tips can enhance your trading efficiency:
1. Use Multiple Time Frames
Integrate multiple time frames to gain a comprehensive view of the market. For example, use the Daily chart to determine the overall bias and the 15-minute or 5-minute chart for precise entries and exits. This multi-time frame analysis allows traders to align shorter-term trades with the broader market trend, increasing the likelihood of successful outcomes.
2. Incorporate Technical Indicators
Employ technical indicators such as Moving Averages, RSI, and MACD to corroborate your bias. Confirming signals from multiple sources can provide greater confidence in your trades. These indicators serve as additional tools to validate the defined bias, offering insights into market momentum, overbought or oversold conditions, and potential trend reversals.
3. Monitor Economic News
Stay updated with economic news and events that could influence market movements. Important news releases can cause significant price fluctuations, impacting your defined bias. Economic indicators, such as GDP reports, employment data, and central bank announcements, can have profound effects on market sentiment and price action.
4. Practice Risk Management
Always practice sound risk management strategies. Define your risk tolerance levels and use stop-loss orders to protect your capital. Never risk more than you can afford to lose on any single trade. Effective risk management involves setting appropriate position sizes, diversifying trades, and adhering to pre-defined risk parameters to safeguard against unforeseen market movements.
5. Keep a Trading Journal
Maintain a trading journal to record your trades, strategies, and outcomes. Analyzing past trades can help you refine your methodology and improve future performance. A detailed journal provides valuable insights into trading patterns, strengths, and areas for improvement, fostering continuous learning and development.
Conclusion
Defining the daily bias for the day is crucial for successful intraday trading. By following the structured steps of identifying swing highs and lows, dividing the price region into Retail and Wholesale areas, and focusing on appropriate buying and selling opportunities, traders can streamline their market analysis. Remember to use multiple time frames, incorporate technical indicators, stay informed about economic news, practice risk management, and maintain a trading journal. With these strategies in place, you can effectively navigate the markets and enhance your trading performance.
I hope you all find this article useful. Do give your valuable feedback in the comments section.
 Education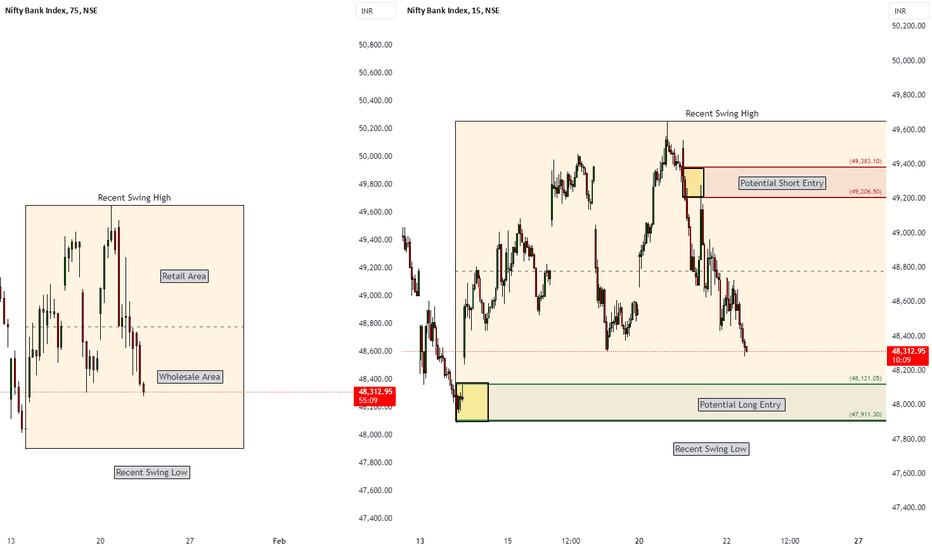
 Long
Long
HINDALCO 10R probable trade set upThe short-term price action for Hindalco appears to be positive, with some bullish indicators:
The stock is trading above its 20-day Simple Moving Average (SMA) of 657.
The price is in the upper range of the Bollinger Bands, suggesting strong momentum.
The MACD has generated a buy signal, although it is initial and weak.
The CCI (Commodity Channel Index) has generated a strong buy signal.
However, there are also some cautionary signs:
The RSI is generating a sell signal in the short term.
Volume-based indicators are showing selling momentum.
Medium-term Outlook
The medium-term analysis reveals a more complex picture:
The stock is trading slightly above the 200-day Moving Average, around 6521.
The zone between 652-620 is considered a crucial demand area.
The RSI on the daily timeframe shows early signs of reversal, suggesting potential bullish momentum.
Key Levels to Watch
Resistance: A critical resistance level is identified near 715. Breaking above this level could negate the existing negative trend and confirm a reversal.
Support: The 652-620 range is an important support zone. Maintaining a position above this range is crucial to prevent further selling pressure1.
Options Data
The Put-Call Ratio (PCR) for various strike prices indicates:
For the 630 strike, the PCR is 3.58, suggesting more put options are being traded relative to call options.
Higher strike prices (710, 720, 750) show lower PCR values, indicating less bearish sentiment for those levels.  Long
Long
Honaut: Strong Daily Demand Zone & 44,000 Weekly SupportHonaut is currently trading entering a strong daily demand zone between 44,275 and 43,060, which could offer significant support if price stays within this range. Additionally, we observe a key weekly support line at 44,000 (also aligns with a psychological level). This makes it an even more significant area for potential price action.
Key Levels:
Daily Demand Zone: 44,275 and 43,060
Weekly resistance turned support Line: 44,000 (previous resistance now acting as support)
If the price remains within the demand zone, this could be an ideal area for potential reversals, especially with the added confluence of the 44,000 psychological level. Watch for price action confirmation and the possibility of an uptrend continuation or reversal as the price approaches this zone.  Long
Long
BITCOIN FORMED BULLISH DIVERGENCE FUELING TO 75KScenario 1: CRYPTOCAP:BTC Moves Up with Strong Volume After a Rate Cut
Bullish Divergence Support: The bullish divergence suggests that #Bitcoin is gaining strength, indicating a potential upward move.
Volume Confirmation: If BTC moves up with solid volume post-rate cut, it could break through 74k and potentially head higher. Increased volume after the rate cut could be a sign that institutional or retail investors are confident in the rally, driving prices above previous resistance levels.
Target: If this scenario plays out, BTC could surpass the 74k mark, especially if the broader market sentiment is favorable post-rate cut.
Scenario 2: BTC Reaches 73k, Then Faces Another Correction
Resistance at 73k: If BTC reaches 73k but struggles to break above it, this would indicate a strong resistance zone. A pullback could follow as the market hesitates or prepares for another consolidation phase.
Correction Potential: In this case, CRYPTOCAP:BTC may correct before attempting another rally. This could be a short-term dip that sets the stage for a more significant breakout once the market rebalances.
Target: If the price reaches 73k but can't break it, then a pullback would likely bring BTC back into a lower range for a while before making another attempt at the next breakout.
Key Factors to Watch:
1. Volume: As you noted, volume is crucial. A strong volume push above resistance (like 73k) would favor Scenario 1.
2. Macro Events: The rate cut and overall macroeconomic factors could heavily influence the market. If the rate cut signals more liquidity or favorable conditions for risk assets like Bitcoin, Scenario 1 becomes more probable.
3. Market Sentiment: The overall sentiment in both crypto and traditional markets will play a role. If broader financial markets are stable or bullish, Bitcoin could push past the resistance levels.
Ultimately, monitoring the price action around the 73k and 74k levels, as well as volume trends, will help clarify which scenario is more likely.
 Long
Long
 Long
Long
 Long
Long
 Long
Long
 Long
Long
 Long
Long