Dr. Reddy's : Triangle Pattern Formation in Demand ZonesDr. Reddy's stock is currently forming a descending triangle pattern on the 2-hour, 4-hour, and daily demand Zones. This pattern and its positioning within demand zones are crucial for potential future movements.
Key Observations:
Triangle Pattern : The stock is creating a descending triangle pattern, characterized by a series of lower highs and a horizontal support level. This pattern often precedes a breakout or breakdown, depending on the direction of the price action.
Demand Zones: The triangle pattern is developing within established demand zones on all three time frames. These zones are areas where buying interest has been strong in the past, which may influence the pattern's outcome on the upside.
Implications:
Potential Breakout : Watch for a breakout above the upper trendline signaling the start of a new trend.
Support Levels: The demand zones within the triangle may act as crucial support levels. A bounce from these levels could lead to a trend reversal.
Key Levels:
Demand Zones:
Daily:
4Hour:
2Hour:
Pattern:
Lets monitor the price action closely as the stock approaches the apex of the triangle pattern for potential trading opportunities when it breaks out
Supply Zone
Vodafone in 4H & 2H Demand Zones: Potential Reversal Ahead?Vodafone is currently consolidating in both the 4-hour and 2-hour demand zones , coupled with daily trendline support , indicating a strong potential for a bullish reversal. This price consolidation suggests potential accumulation and could lead to a bullish reversal in the near future. Also convergence of support levels across multiple time frames adds confidence to a possible bounce in price action. There should be a lookout for a potential bullish breakout, especially considering the strong confluence of support levels.
Key Levels:
Daily Trendline Support:
4H Demand Zone:
2H Demand Zone:
Breakout Possibility
The price is consolidating within the demand zones in both the 4H and 2H time frames, while maintaining contact with a daily trendline support. This consolidation could signal an accumulation phase, where the market is indecisive before a breakout. Once the price has broken out of the range (i.e resistance @ 13.77), The target could be the next supply zone around 15. There is also a small gap filling opportunity as well
Taking Rejection from a Strong Support Zone.ONGC is Standing on Strong Support Zone. If this Support Zone Breaks Firstly, it Will Definitely Turn Bearish and Downtrend might Continue Secondly, it Multi-year Breakout Will Also Fail. But there are stronger Chances and Probability of ONGC Showing Reversal From this Point.
BANKNIFTY IMPORTANT LEVELS FOR TOMORROW, 7TH AUGUST NSE:BANKNIFTY ANALYSIS FOR TOMORROW 🔺
❇️ IMPORTANT LEVELS 🚀
❇️ Support: 49750-49500-49154.
❇️ Resistance : 50214-50431-50800-51310
👉🏻 PURPLE LINE is a key level, above buying, Below selling.
👉🏻 YESTERDAY'S CLOSING IS IMPORTANT.
👉🏻 @thetradeforecast 🇮🇳
BANKNIFTY IMPORTANT LEVELS FOR TOMORROW, 6TH AUGUST NSE:BANKNIFTY ANALYSIS FOR TOMORROW 🔺
❇️ IMPORTANT LEVELS 🚀
❇️ Support: 49830-49720-49590-49080-48840-48080-47285
❇️ Resistance : 50200-50340-50580.
👉🏻 PURPLE LINE is a key level, above buying, Below selling.
👉🏻 Expecting A FALL from here.. due to world war 3, news and actions.
👉🏻 YESTERDAY'S LOW IS IMPORTANT (49721)
👉🏻 @thetradeforecast 🇮🇳
BANKNIFTY IMPORTANT LEVELS FOR A WEEK, 5TH AUGUST NSE:BANKNIFTY ANALYSIS FOR A WEEK 🔺
❇️ IMPORTANT LEVELS 🚀
❇️ Support: 51200-50960-50720-50620-50480-50300-50120
❇️ Resistance : 51400-51630-51800-52414
👉🏻 Purple line is a key level, above buying, Below selling.
👉🏻 Expecting A FALL from here.. due to world war 3 news and actions. Not predicting CRASH.
👉🏻 @thetradeforecast 🇮🇳
NATCOPHARM - CUP AND HANDLE FORMATION (BO FROM SUPPLY ZONE)Hi All,
This idea is about Natco Pharma
Fundamentals
Market Cap - 21712 Cr
Stock PE - 15
ROE - 25.9%
ROCE - 30%
Promoter Holding - 49.7
Quick Ratio - 3.42
D/E - 0.06
NATCO Pharma Limited (NATCO) is a vertically integrated, research and development focused pharmaceutical company engaged in developing, manufacturing, and marketing complex products for niche therapeutic areas.
Technicals
Since May 21, NATCO has formed a complete CUP and HANDLE formation on weekly chart and has now sustained the breakout for over 2 weeks. The earlier supply zone is now acting as demand zone indicating positive price action.
This is for mid/long term investors only
Hope you enjoy the idea,
Happy Trading,
Thanks,
Stock-n-Shine
Grasim at make or break levelAs seen on the chart, Grasim stock is trading near a strong supply zone of 1750-1775.
The stock also has taken support from trendline which is drawn from 2020 lows.
If the stock manages to break its ATH level and sustain above this supply zone for few weeks, we can see a flag breakout and a new bull uptrend in this stock.
However, rejection from supply zone can bring to stock to 1670, 1580 or below.
This is a FNO stock and hence we can expect a good amount of call writing at 1800 levels. Also, the chart is very similar to JSWSteel chart which i posted 2 days back.
Note:-Idea has been shared for educational purposes and shouldn't be considered as a recommendation.
SUNTECK - EXCELLENT SETUP (MULTIYEAR BREAKOUT)Price Action has gone through multiple contractions since 2019 and is now poised to breakout of a major supply zone. Though Price action has broken the barrier, will still wait for a day to confirm a true breakout
First contraction was close to 72%, followed by 50% during 2023 & finally reduced to 28% before giving a breakout. Squeeze kept getting tighter for each consecutive contraction which is a very positive sign.
Even Volume support seems to be present along with Sectoral Tailwinds behind Real Estate
PAISALO - DESCENDING TRIANGLE BREAKOUTHi All,
This idea is about Paisalo Digital Ltd
Fundamentals
Market Cap - 6976 Cr
Stock PE - 39
ROE - 14.3%
ROCE - 14.1%
Promoter Stake - 47.6
Promoter holding Change 3 Yr - 3.79%
Quick Ratio - 1.18
D/E - 2
Both Sales and EPS increased in FY24.
Technicals
Descending Triangle Breakout. Targets are marked as T1 & T2
Happy Trading,
Thanks,
Stock-n-Shine
Technical Analysis for Laurus Labs:Chart Pattern: Breakout of Supply Zone
Volume: Good volumes with a bullish candle closing
Trendline: Breakout of trendline as well
Entry Strategy: Buy at Current Market Price (CMP) ₹477
Stop Loss (SL): ₹410 for risk management
Target: ₹711
Trade Duration: Swing Trade for 3-6 months
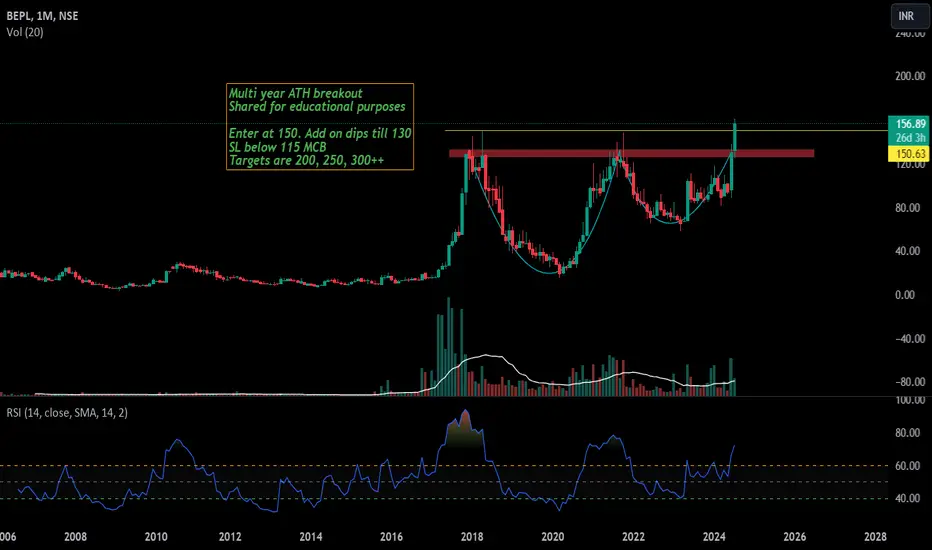
BEPL-An ATH breakout for multibagger returns!BEPL has been consolidating in a cup and handle pattern in monthly timeframe
130-150 has been a strong supply zone for the stock which has been successfully crossed.
Now, we might see a big strong move as gates are open for stock.
Long term investors should not miss this stock.
Swing traders should wait for pull back of 135 levels for entry.
We can expect multibagger returns from stock in future.
RKFORGE - CLEAN BREAKOUT WITH VERY CLOSE 50/200 SMAA very positive breakout where all the moving averages converge & then expand.
1 Yr Breakout with strong sectoral tailwinds as all forging stocks doing well
Strong upsurge in Volume indicates sustained price action upside from the present levels
Supply and demand zones clearly marked in the chart with no extra indicators to cause any confusion.
MRF - FALIING WEDGE BREAKOUTHi All,
This idea is about MRF Limited
Market Cap - 54 891 Cr
Mcap/Sales - 2.18
P/E - 26.4
ROE - 13.2%
ROCE - 16.9%
Promoter Holding - 27.8%
EPS - 4907
Quick Ratio - 0.79
D/E - 0.17
Technicals
Price reversal breakout is seen on daily chart of MRF.
It continued in falling wedge pattern & then price broke out of the upper channel with heavy volume. This could signal a price reversal at this point Price has corrected almost 15% from its peak
Happy Trading,
Thanks,
Stock-n-Shine
EMUDHRA - BASE ON BASE FORMATION WITH BREAKOUTHi All,
This idea is about EMUDHRA
Fundamentals
Market Cap - 7438 Cr
Stock PE - 98.7
ROE - 14.4%
ROCE - 17.7%
Promoter Buying - 54.4
Quick Ratio - 5.71
D/E - 0.01
Emudhra is a licensed certifying authority involved in issuing digital signature certificates in India under its eMudhra brand. The company is licensed by the Controller of Certifying Authorities (CCA), Ministry of Information Technology, and operates under the guidelines set by the Information technology Act
Technicals
After forming 2 bases, the price action is poised for stage 3 advance before forming next base. All the stages are shown in chart for clarification
Hope you'll enjoy this idea,
Happy Trading,
Thanks,
Stock-n-Shine
ELIN - SIMPLE SETUP, GREAT POTENTIAL (GOLDEN CROSSOVER)Hi All,
This idea is about ELIN ELECTRONICS (EMS Sector)
Fundamentals:
Market Cap - 1033 Cr
Total Sales - 1042 Cr
Stock P/E - 74
Healthy quick ratio - 2
Low ROCE - 5.12%
Increase in promoter holding by 0.42% but still promoter holding low at 33
Technicals :
Price has just broken out of consolidation since Feb 23 near to its listing with expansion in moving averages and golden cross over on daily chart.
Price has crossed Point of Control in VRVP indicator (Volume Profile) supported by surge in volume.
Great Sectoral tailwinds behind EMS sector as a whole
Hope you'll enjoy the trade,
Happy Trading,
Thanks,
Stock-n-Shine
GICRE - UPSIDE POTENTIAL OF 40%Hi All,
General Insurance Corporation of India - CMP (406)
Market Cap - 71309 Cr
Stock PE - 10.7
Book Value - 315
Promoter Holding - 85%
EPS - 38
As per the technical pattern on weekly timeframe, price action has formed Bullish Continuation Pattern and is currently trading at lower channel of the trend formation.
An upside of 40% is clearly visible over coming months which is the upper channel of the bullish pattern.
In the current week, price action has broken the horizontal resistance as well confirming the upside in near future.
Relative Strength has also turned positive on all major time frames.
As per fundamentals,
Stocks is still undervalued at PE of just 10.7 with sector PE of 17.
Healthy Dividend of 20.4%
CAGR growth of 24.1% over last 5 years
Hope everyone enjoys this trade!
Happy Trading,
Thanks,
Stock-n-Shine
RELIGARE - MONTHLY CHART (INTERESTING PATTERN - NO TRADE YET)This chart is extremely interesting to study
Look at the pattern
During first contraction, there was a huge supply which took the price to abyss levels of 17 from levels of 280. The contraction measured 91% as per the scale
Second contraction supply got limited to only 50% retracement & in the third it was only 28%
This shows diminishing supply pattern.
Price action give a successful breakout but went into consolidation. The least line of resistance is 285 & it should be kept on radar
GEOJITFSL - EXCELLENT SETUP FOR LONG TERM INVESTORSThe pattern is based om Monthly TimeFrame so it is meant only for long term Investors
Made a high on Jan 08 of 131 and then went under a major contraction of 10 Years when it again made a high of 147 in Oct 17. That was the formation of first contraction.
Similarly it went for another contraction of 4 yrs & then eventually of 3 years.
It can give a big upside if it is able to break 147 and pass 150 levels
Another possibility is it can go for another contraction but what makes the present contraction more promising is the spurt in Volume which might take the price action cross the major barrier
So its a case of Wait and Watch