Endurance-A good auto ancillary stock for long termCurrently, stock has given breakout from resistance and can be taken as a quick swing trade for 2300 target.
Stock has a strong trendline supply zone which is around 2300.
If this level breaks out, we can see huge rally in the stock and can be held for long term.
Stock has good fundamentals and only around 2% is public holding. Good bet in EV sector theme.
Supply Zone
NIFTY- A strong move is about to come?An index analysis idea after many many months.
Reason:- Today, we saw a short covering 400 points up move in Nifty with an ATH closing.
What is the chart speaking now?
Nifty has given daily closing above 22800 which was a strong supply zone.
23000 is a psychological resistance in Nifty now.
As from chart, it is clear that our dear Nifty is trading in a channel and 23100-23150 is the next supply zone. If we see a consolidation near 23000, we might see this resistance getting broken and strong bull run till 25000 should be expected.
However, there are high chances of bull trap getting formed in this zone , especially 4th June being an eventful day which is just 2 weeks away from now. I am expecting a highly volatile market till June end.
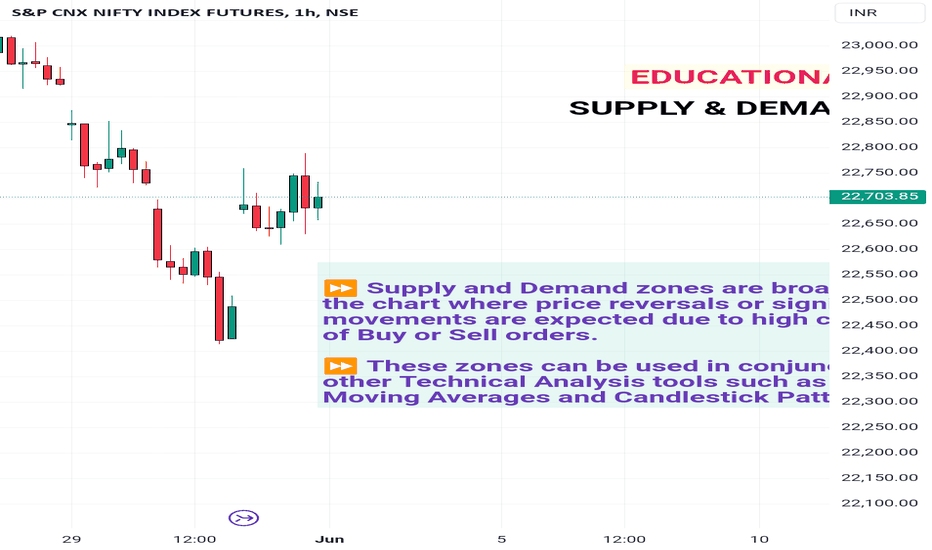
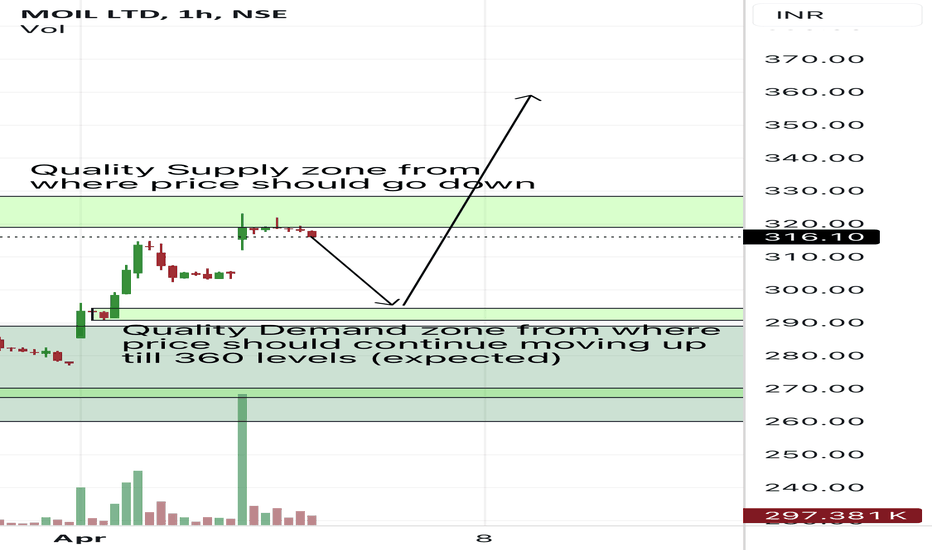
Basic Understanding about Supply and Demand ZonesQ: What is a supply zone in trading?
A: A Supply Zone is a Price level or Area on a chart where Selling pressure is expected to be strong enough to overcome buying pressure, causing prices to fall.
It is typically identified by a concentration of previous price highs where sellers have historically emerged.
Q: What is a Demand zone in Trading?
A: A Demand zone is a Price Level or area on a chart where Buying pressure is expected to be strong enough to overcome selling pressure, causing prices to rise. It is usually identified by a concentration of previous price lows where buyers have historically stepped in.
Q: How can traders identify supply and demand zones on a chart?
A: Traders can identify Supply and Demand zones by looking for Areas where the price has previously made significant moves up or down. For Supply zones, they look for price peaks followed by sharp declines. For Demand zones, they look for price troughs followed by sharp increases. These zones are often marked by areas of consolidation or strong price rejection.
Q: How do Supply and Demand Zones integrate with other Technical Analysis tools?
A: Supply and Demand Zones can be used in conjunction with other Technical Analysis tools such as Trend lines, Moving Averages, and Candlestick Patterns.
For example, a Supply zone that aligns with a Resistance level can provide a stronger signal for potential price reversals. Combining multiple tools can enhance the accuracy of trading decisions.
Q: How can traders Manage Risk when trading Supply and Demand zones?
A: Traders can manage risk by using stop-loss orders just outside the supply or demand zone to limit potential losses. They should also consider the size of the zone and the volatility of the scrips when determining their position size.
Regularly reviewing and adjusting their zones based on market conditions can also help in managing risk effectively.
Keep Practicing & Learning Price Ac tion concepts
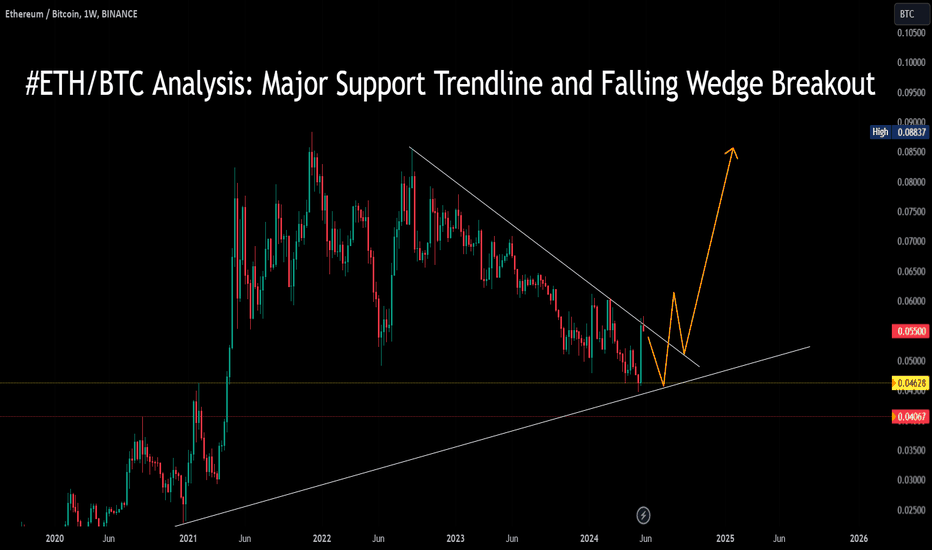
#ETH/BTC Analysis: Major Support Trendline and Falling Wedge Bre#ETH/BTC Analysis: Major Support Trendline and Falling Wedge Breakout
The 3ETH/BTC trading pair has been in a downtrend for the past 28 months, consistently forming lower highs and lower lows. However, recent price action indicates a potential reversal pattern that could signal the end of this prolonged bearish phase. Ethereum is currently taking support from a significant trendline and has formed a falling wedge, a bullish reversal pattern. Traders and investors are now eagerly awaiting a breakout, which could pave the way for Ethereum to reach new all-time highs, potentially hitting the $15,000 mark against Bitcoin.
**Major Support Trendline:**
Over the past 28 months, ETH/BTC has been respecting a major support trendline. This trendline has acted as a critical support level, preventing further declines on multiple occasions. Recently, Ethereum has once again found support at this trendline, indicating a strong base and potential for a reversal.
**Falling Wedge Pattern:**
A falling wedge is typically considered a bullish reversal pattern that forms after a downtrend. It is characterized by converging trendlines that slope downwards, with the upper trendline having a steeper slope than the lower one. In the case of ETH/BTC, the falling wedge pattern has been forming over several months, signaling that the downtrend might be losing momentum.
**Breakout Confirmation:**
For the falling wedge pattern to be validated, ETH/BTC needs to break above the upper trendline of the wedge. A confirmed breakout would typically be accompanied by increased trading volume, indicating strong buying interest. Once this breakout is confirmed, it would suggest that the bearish trend has ended, and a new bullish phase is beginning.
**Price Target:**
The breakout from the falling wedge pattern could lead to significant upward momentum for ETH/BTC. Based on technical analysis and historical price movements, Ethereum could reach new all-time highs, potentially climbing to the $15,000 level against Bitcoin. This price target is derived from measuring the height of the wedge at its widest point and projecting it upwards from the breakout level.
**Conclusion:**
The #ETH/BTC pair has been in a downtrend for the past 28 months, but recent price action indicates that a reversal might be on the horizon. Ethereum is taking support from a major trendline and has formed a falling wedge pattern, both of which are bullish signals. Traders and investors should keep a close eye on the price action for a confirmed breakout above the upper trendline of the wedge. If this breakout occurs, it could propel ETH/BTC to new all-time highs, potentially reaching the $15,000 mark. This presents a compelling opportunity for those looking to capitalize on Ethereum's next major bullish run.
WILL NIFTY50 SHOW REVERSAL FROM SUPPORT LEVELS ?Symbol - NIFTY50
CMP - 21980
NIFTY50 witnessing heavy selling and now slipping below 22,000 round level.
Market sentiment is weak but according to my analysis, Nifty is now trading at major support levels.
22000 - 21930 is good support range for Nifty. I believe Nifty will take support from current levels & will show a reversal from here soon.
Dow Jones is at good support levels, Crude is showing reversal from upper levels etc. are the triggers that will help Nifty to go higher from current levels.
Hence I'm taking Future long positions in Nifty at CMP 21977 - 21980
I'll add more position around 21920 - 21930 levels, if comes & hold with 21880 SL.
Targets will be 22170 - 22300 - 22430
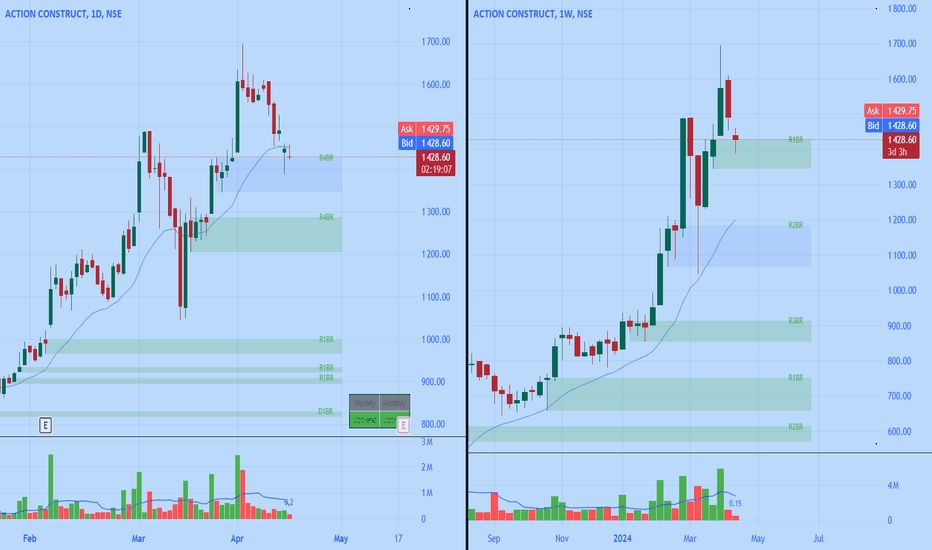
🎯 Unveil the power of Demand Zones with ACE! Catch the wave📊 Fundamental Key Points:
Action Construction Equipment Ltd engages in manufacturing and marketing hydraulic mobile cranes, tower cranes, construction equipment, and agricultural machinery. The company offers a diverse product portfolio to meet various customer requirements.
Financials: Market Cap ₹17,094 Cr, Current Price ₹1,428, Stock P/E 61.7, ROCE 26.2%, ROE 18.8%.
Pros: Debt-free status, expected good quarterly performance, consistent profit growth of 24.9% CAGR over 5 years, improved debtor days.
Cons: Trading at 16.4 times its book value, decrease in promoter holding over the past 3 years.
Peer Comparison: Compared to peers in the Capital Goods sector, ACE shows favorable metrics like ROCE at 26.17% and solid profit growth.
Quarterly Results: Dec 2023: Net Profit ₹88 Cr, EPS ₹7.41, reflecting positive growth trends over the quarters.
Balance Sheet: Shows steady growth in assets over the years, with a well-managed debt profile.
Shareholding Pattern: Promoters hold majority stake, with FIIs and DIIs showing consistent interest over time.
*️⃣ Understanding the Basics - Technical Analysis
First, let's break down some key terms you'll encounter in this analysis:
RBR Zones (Rally Base Rally): This pattern signifies an upward price movement, followed by a period of consolidation (stabilization without significant price changes), before another upward movement occurs.
Demand Zone: A price area where buyers tend to enter the market, causing the price to increase.
Bullish Pin Bar Candle: A type of candlestick that indicates a potential reversal of a downward trend to an upward trend.
📈 In-Depth Analysis of ACE
ACE is currently trading in a very significant area, known as a Demand Zone. This zone is not just any area on the chart; it's a powerful RBR Zone formed on both the daily and weekly charts. Here’s why this is crucial:
The formation of the RBR zone was followed by the price reaching all-time highs accompanied by high volume, showing strong buying interest.
Currently, the price has retraced back to this zone, accompanied by low volume, which could mean a potential reversal or continuation of the upward trend.
Yesterday's price action closed with a Bullish Pin Bar Candle right at the Demand Zone, which often signals a turning point.
💹 Key Trading Strategy
For those looking to trade ACE, here’s a straightforward approach:
Entry Point: Current Market Price (CMP) at 1428.
Stop Loss (SL): Below 1340, to protect against unexpected downward movements.
First Target: Aim for 1600 as an initial profit target.
Risk Management: Consider trailing your stop loss to lock in profits as the price moves favorably.
Disclaimer:
This analysis is for educational purposes only. I am not a SEBI registered analyst. Please do your own research or consult a financial advisor before making investment decisions.
Concluding Thoughts
Thank you for your engagement and feedback. Remember, trading is a journey of continuous learning and application. Feel free to ask questions or share your thoughts on this analysis!
"In trading, as in life, the risk you take is a measure of the success you seek. 🚀"
USDSEK - SMALL SL FOR BIG REWARD ?Symbol - USDSEK
USDSEK is currently trading at 10.80500
I'm seeing a trading opportunity on sell side.
Shorting USDSEK pair at CMP 10.80500
Holding with SL of 10.84000
Targets I'm expecting are 10.60000 & 10.48000
This is a high risk trade with small SL & big targets. Let's see what happens!
Disclaimer - Do not consider this as a buy/sell recommendation. I'm sharing my analysis & my trading position. You can track it for educational purposes. Thanks!
Swing Trading Gem:(ZEEL Set to Soar 10-15 % in a Month or Two*ZEEL is ready to offer returns ranging from 10-15% within a timeframe of one to two months*. Please note that terms and conditions apply.
Reasons to Consider Taking a Trade:
- A crucial Supply/Support zone has been pinpointed within the range of 140-145
- The trendline break.
- Price has surged above the 50 Moving Average, which is now acting as a support level.
Targets:
I think Target 1: Will be achieved in a week or two and then 174 Target 2 will be achieved in a month and if ZEEL Blast then 191 Target 3 in 2 months.
Imp. Note: This analysis is provided for informational purposes only and does not constitute a direct recommendation to buy or sell stocks. Investors should conduct their own research and consult with financial advisors before making any investment decisions, as market conditions and individual circumstances may vary.
Market Risk: However, it's important to acknowledge the inherent risks associated with investing in the stock market, including but not limited to volatility, economic downturns, regulatory changes, and unforeseen events that can impact stock prices. It's crucial for investors to remain vigilant and diversify their portfolios to mitigate potential losses.
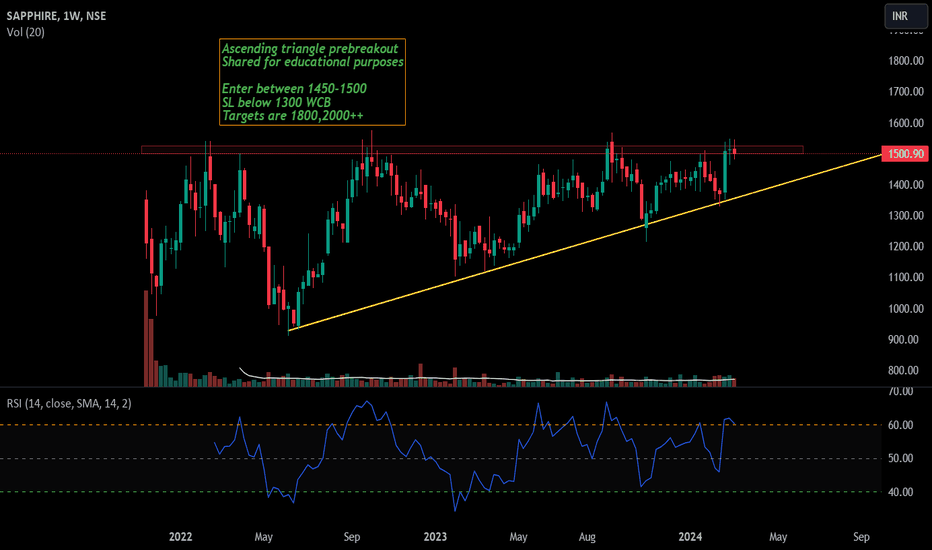
Sapphire foods-Can it break ATH this time?Sapphire foods has been consolidating in a beautiful ascending triangle pattern.
Currently, stock is near suppl zone, hence only risky investors should be interested
If the stock gives monthly closing above 1500 with good volumes, we can see a big move in this stock.
Keep in watchlist!
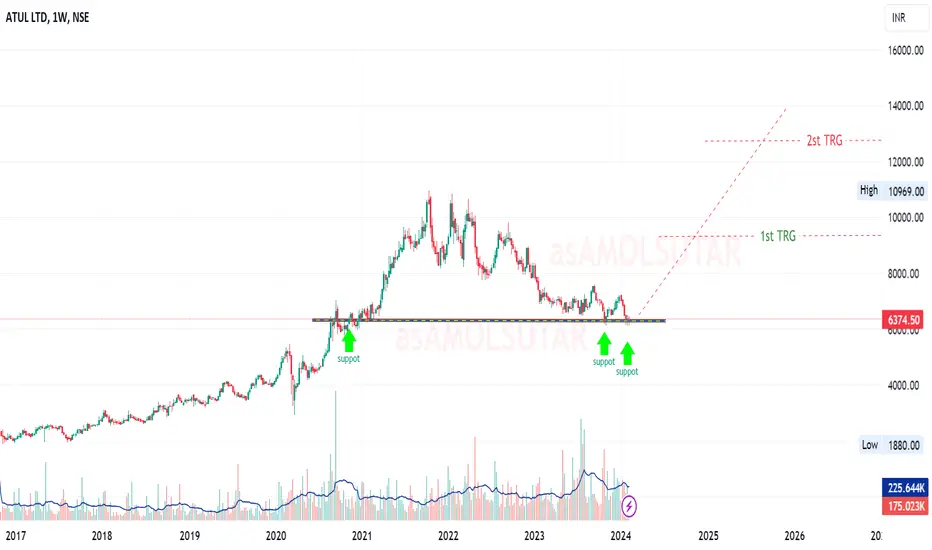
ATULATUL
First of time , my technical knowledge that good support on chart price and technical analysis the stock will definitely reach the given targets in few days and hope that our expectations will be fulfilled.
holdings :-)))
a) Promoters 45%
b)FIIs & DIIs 35%
c) Public 20 %
If You LIKE👌👌 MY Idea ......Boost.🔥🔥🔥.. its.
"Disclosure : I am not Sebi-registered." This channel is for only educational purpose. Any profit/loss, I am not responsible.
Before taking any trade on our charts / calls, please consult your financial advisors. Thanks🙏
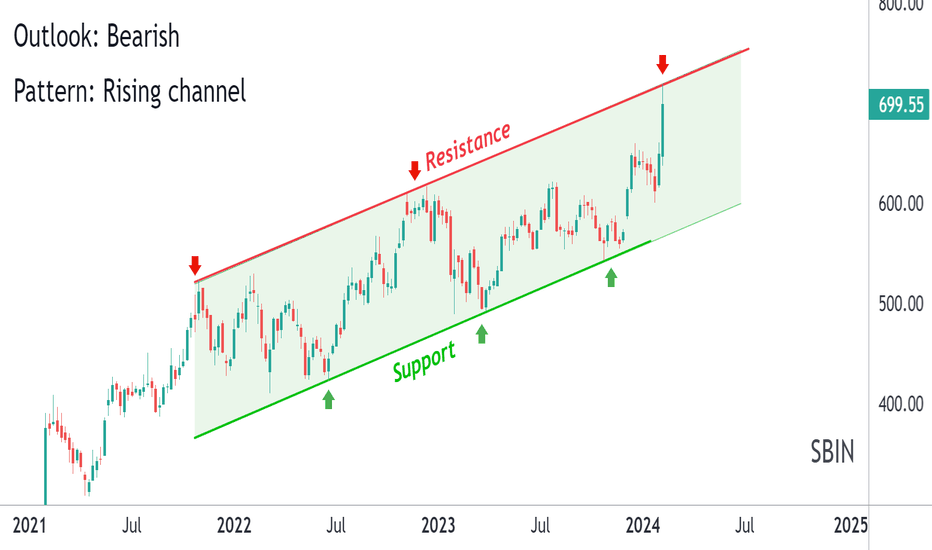
SBI : PSU Bank solid Bearish setup ?? Alert! Bearish Pattern Spotted! 🐻
📊 Pattern: Rising Channel
📌 Symbol/Asset: SBIN
🔍 Description: Stock is in Rising channel.
and now Stock is around the resistance of the rising channel.
We can see downside of 18-20% if 730 levels are intact !!
Huge shorting opportunity !!
👉 Disclosure: We are not SEBI registered analysts, this is not a buy or sell recommendation.
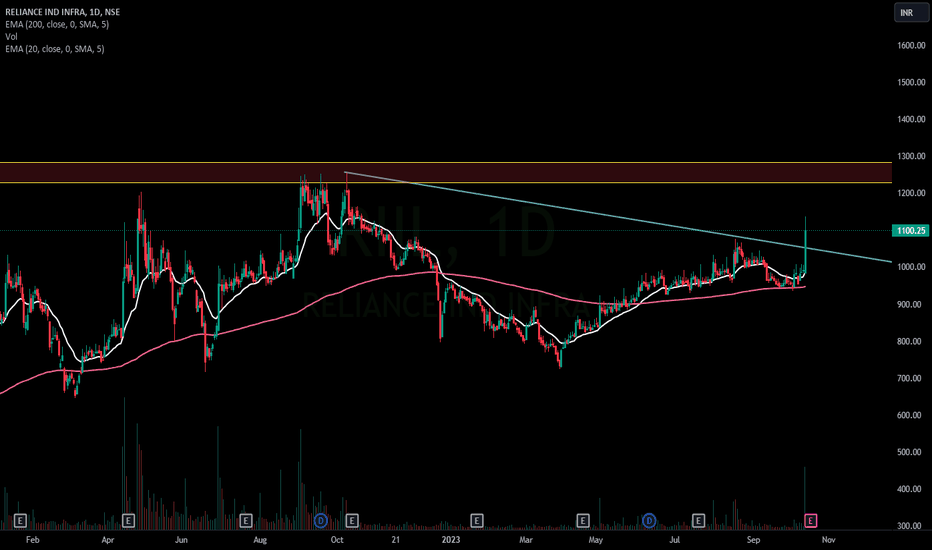
RIIL is approaching a strong supply zoneRIIL has given a trendline breakout and is looking good for short term target of 1250.
Try to buy at lower price, around 1025-1050 for good risk reward.
SL should be below 970 DCB.
If the stock manages to give a weekly closing above 1300, we can see 1500+ levels in the stock.
Idea shared for educational purposes only
PNB housing near a strong supply zonePNB housing has shown an amazing rally post breakout of trendline.
Stock is currently near a strong supply zone of 820-850.
Next target for stock is 1200.
Stock can give buying opportunity near 650-700 before breakout. Add on dips.
Idea shared for educational purposes
Vedanta Ltd. - Demand ZonesNSE:VEDL is a global diversified natural resource company operating across segments which are Copper; Aluminium; Iron Ore; Power; Zinc, Lead and Silver; Oil and Gas, and Others.
TTM EPS: 23.65
TTM PE: 8.84
P/B: 0.94
Mkt Cap (Rs. Cr.): 77,689
Dividend Yield: 48.56
Sector PE: 6.57
Book Value Per Share: 222.49
My Opinion: Vedanta, once soaring at an all-time high of 298, now faces a significant decline. The immediate demand zone lies between 175 and 150, where investors are eyeing a potential rebound. However, the next crucial support level stands at 122, serving as a critical turning point. As the stock navigates these challenging waters, investors must exercise caution and conduct thorough research before making decisions. Market sentiment and company fundamentals will play a crucial role in determining Vedanta's future trajectory. Keep a close watch, as opportunities may emerge amidst the volatility.
Recommendated: I do recommend reading about Vedanta's Bond Repayment which is due in January 2024. Vedanta is still exploring the ways for the repayment. Also Moody's downgrade of Vedanta Resources' corporate family rating to Caa2 is a factor to consider before making any decision.
Here I would like to reflect upon some learning aspects that can help in decision-making:
Accumulating volume near a demand zone suggests that there is increasing buying interest and potential support for the stock in that price range. When traders and investors perceive a particular price range as a demand zone, they anticipate that the stock's price may find support and possibly reverse its downtrend.
If the volume of trading activity is increasing within this demand zone, it indicates growing investor confidence in the stock's value at that price level. This can be seen as a positive sign, as it suggests that buyers are accumulating shares, possibly with the expectation of a price increase in the future. However, it's essential to consider other factors such as market sentiment, news, and overall market conditions before making investment decisions solely based on accumulating volume.
NOT A RECOMMENDATION. JUST FOR EDUCATION PURPOSE. Thanks
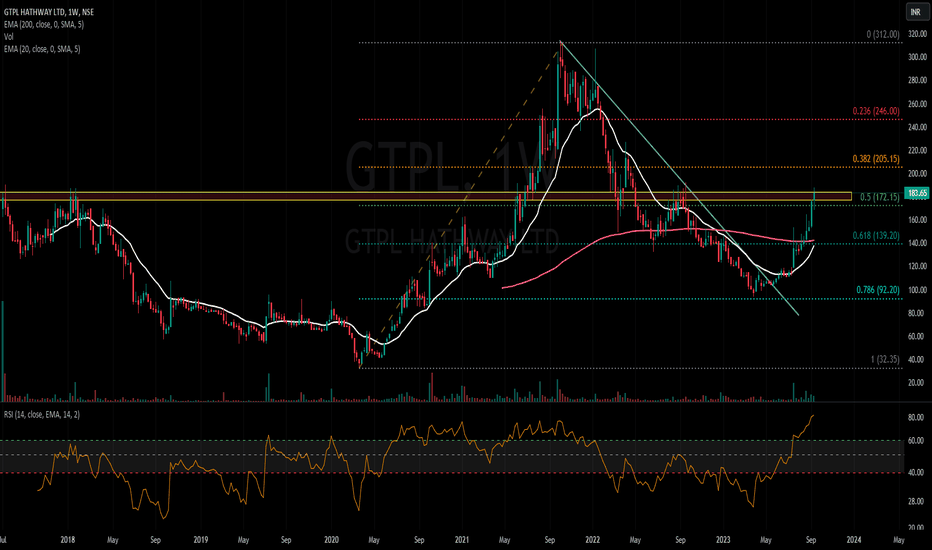
Can we catch the momentum in GTPL?GTPL Hathway is a very volatile cash stock which has given wild one sided moves in the past.
As seen in the chart, stock is in strong uptrend and has reached a supply zone of 185-190.
Price action at CMP is going to be interesting. A consolidation before breakout is always healthy.
However, if the stock sustains above 190, it can be a risky swing trade for explosive targets of 205, 224, 240++. SL can be below 168 DCB which is this week's low.
Weekly golden crossover is nearing in the stock which can be an indicator of continuation of momentum. Weekly RSI is overbought which can be a signal of consolidation/retracement so trade as per your own risk and keep trailing your SL immediately.
Idea has been shared for educational purposes only!
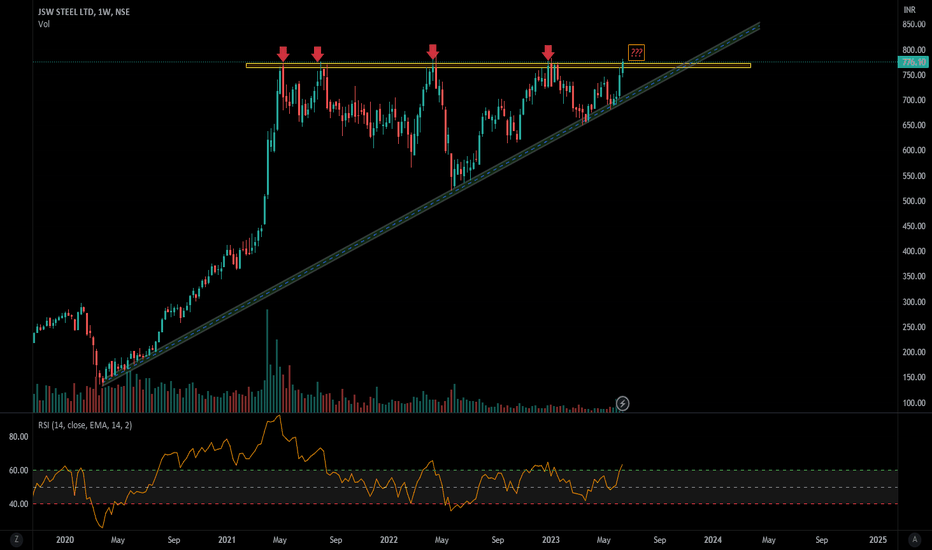
JSW STEEL- Bull run 2.0?We have seen an amazing bull run in JSWSteel during the metal sector rally of 2020-21.
Since then, stock has been consolidating with 770-780 acting as a strong supply zone for the stock.
However, the stock has recently taken support from a 3 year old trendline and currently standing at the same supply zone.
If the stock manages to sustain above 780-800 for a couple of weeks , it will confirm a breakout of a flag consolidation and we can expect Bull run 2.0 in this stock as well as other metal sector stocks.
Note:- Metal sectors are cyclical in nature. Please invest/trade accordingly. This idea is shared for educational purposes only and should not be taken as a recommendation.