Finnifty Intraday Analysis for 31st August 2026NSE:CNXFINANCE
Index is near 26500 resistance and if Index breaks and sustains 26500 level then uptrend is expected to continue. However, India Q1 2026-27 GDP data, scheduled one Monday evening, will decide the trend in the short term.
The upward movement may lead the Index to 26550 - 26600 resistance range and if the index crosses and sustains above this level then may reach near 26850 - 26900 range.
On the contrary, The downward moment may drag the to 26025 – 25975 support range and
Support and Resistance
Midnifty Intraday Analysis for 31st August 2026NSE:NIFTY_MID_SELECT
Index has resistance at 15000 strike and uptrend will be formed only if index breaks and sustains 15000 decisively. However, India Q1 2026-27 GDP data, scheduled one Monday evening, will decide the trend in the short term.
The upward movement may lead the Index near 15125 – 15150 resistance range and if the index crosses and sustains above this level then may reach 15300 – 15325 range.
On the contrary, The downward moment may drag the index to 14800 – 14775 support
NCDEX Guar Gum Futures: A New Impulsive Move Could Be DevelopingNCDEX:GUARGUM51! has formed an interesting Elliott Wave structure after completing a larger correction in March 2026.
The advance from the March low appears to have developed into a new upward sequence.
The decline into August appears to have completed Wave 2 , and the current recovery could represent the early stages of the next impulsive advance.
Key Level to Watch
A sustained move above 12869 level would strengthen the possibility that the current advance is developing as Wave 3.
P
Nifty - Expiry Day Analysis Sep 1The price took support from 24000 and is moving up, now facing resistance at the 24100 zone. It is sustaining above the trendline, but the price is still weak to give a trending move.
Buy above 24060 with the stop loss of 24000 for the targets 24100, 24160, 24220, 24280 and 24320.
Sell below 23960 with the stop loss of 24020 for the targets 23920, 23880, 23820 and 23780.
As per the daily chart, the 24000 zone will decide the trend direction.
The expected expiry day range is 23800 to 24300.
Alway
Nifty is trading below the Previous Day Low (PDL)Nifty is trading below the Previous Day Low (PDL), which keeps the intraday bias on the bearish side. As long as price remains below PDL, I will focus only on short-side opportunities and avoid counter-trend longs. Let the market prove strength before thinking about longs. Price action remains the key.
Disclaimer: This analysis is shared for educational purposes only and is not a buy or sell recommendation. Please do your own research and manage risk as per your trading plan.
BTCUSD: Rejection at Resistance & Bearish Breakdown — Intraday Market Overview & Technical Bias:
Bitcoin (BTCUSD) is showing clear signs of intraday distribution on the 30-minute timeframe. After an aggressive attempt to push higher toward the upper resistance levels (~$79,100 – $79,250 zone), price action met strong supply and reversed sharply. The breakdown below key intermediate levels (~$78,244) signals a shift in market structure, opening up lower targets.
Trade Execution Plan:
Bias: Short / Bearish
Entry Zone: $78,200 – $78,350 (on a minor pul
EURJPY SHOWING A GOOD DOWN MOVE WITH 1:10 RISK REWARD EURJPY SHOWING A GOOD DOWN MOVE WITH 1:10 RISK REWARD
DUE TO THESE REASON
A. its following a rectangle pattern that stocked the market
which preventing the market to move any one direction now it trying to break the strong resistant lable
B. after the break of this rectangle it will boost the market potential for break
C. also its resisting from a strong neckline the neckline also got weeker ald the price is ready to break in the outer region
all of these reason are indicating the same thing
MCX Mentha Oil: Is a New Trading Range Taking Shape?MCX:MENTHAOIL1! has moved into an important long-term price zone after spending several years in a broad trading range. The recent rally toward 1320 has brought the contract back to an area that previously acted as major resistance.
The key question now is whether this zone will lead to a temporary correction or become the upper boundary of a new trading range.
Near-Term View: 1196 – 1182
In the near term, Mentha Oil may see some further correction toward 1196–1182. I would treat this zo
NO CLEAR DIRECTION! As we can see NIFTY is still between an important range due to which no clear direction in the market can be determined and hence it could result in more volatility. Hence, as long as NIFTY maintains itself between this range and does not breaks either side and closed above or below it! We must stay cautious and avoid any positional bias. Plan your trades accordingly and keep watching everyone.
BUY SIDE TRADE in BTCLooking for a bullish momentum in BTC…. A simple 1:3 Risk reward trade in BTC will be placed at 4:30 Pm IST… if this candle remains green and closes above the 9 and 20 ema
Most importantly the price will continue to remain in a bullish momentum following a small area of support at this region
Nifty - Weekly review Aug 31 to Sep 4The price has taken support from the 24100 zone and is sustaining above it. Nearby support is at 24000, and resistance is at the 24300 zone. The price can move within this support/resistance if there is no trend strength.
Buy above 24220 with the stop loss of 24160 for the targets 24260, 24300, 24360, 24420, 24480 and 24520.
Sell below 23980 with the stop loss of 24040 for the targets 23940, 23880, 23820 and 23760.
24000 is a strong psychological level where bulls and bears will fight to gain st
COSMOFIRST: Breakout or Liquidity Grab?NSE:COSMOFIRST
After months of recovery, Cosmo First is approaching a major resistance zone near ₹900-916, where historical supply is expected to emerge. While a breakout may attract momentum buyers, the real focus is on how price behaves after the breakout .
One possible scenario is a liquidity grab —a brief move above resistance to trigger breakout participation, followed by a controlled pullback. If the decline occurs on declining volume and finds support around the newly formed demand
BNB: TEXTBOOK DOWNWARD CHANNEL —BEARISH REJECTION AT CHANNEL TOPBNB is currently presenting an interesting risk-defined short setup.
The daily chart shows a well-defined descending parallel channel, with price repeatedly respecting the channel's upper and lower boundaries.
After a strong rally from the lower portion of the structure, BNB has now reached the upper boundary of the descending channel and the previous swing-high resistance zone around 720–725.
What makes the current setup particularly interesting is what happened on 28 August.
🔴 Bearis
BTC/USD Technical Breakdown: Lower Highs Pointing to Downside BTC/USD is currently consolidating around $77,405, holding just above immediate support after a aggressive sell-off from the $79,500+ zone. The 15-minute chart reflects clear bearish momentum following a heavy drop, with price action failing to recover key resistance levels during subsequent pullbacks.
Resistance Levels:
$78,922 - $79,561: Major overhead supply zone marking the recent high breakdown point.
$77,600 - $77,800: Immediate intraday resistance capping short-term bounce attempts.
S
XAUUSD Analysis: Short Setup at Key Resistance Level Market Analysis & Setup Overview
Gold (XAUUSD) is currently consolidating around the $4,610 region on the short-term timeframe, failing to generate sustained upward momentum near major overhead resistance. On the 4-Hour chart, price action displays signs of exhaustion with lower highs rejecting near the $4,618 – $4,630 zone. A short bias is favored as momentum softens below critical resistance.
Trade Bias: Bearish / Short
Entry Zone: $4,610.00 – $4,618.00
Stop Loss (SL): $4,635.00 (Abo
Nifty Intraday Analysis for 28th August 2026NSE:NIFTY
The index is near the 24000 support level which is expected to be respected and the index has strong resistance in the 24300 - 24500 range and an uptrend is expected to be formed if the index breaks and sustains above 24500 level.
The upward movement may lead to 24300 – 24350 resistance range and if the index crosses and sustains above this level then may reach near 24550 – 24600 range.
On the contrary, The downward moment may drag the Index to 23900 – 23850 support range in d
Banknifty Intraday Analysis for 28th August 2026NSE:BANKNIFTY
Highest Call and Put OI is at 57500 strike which will act as make or break level in near term and trend will be formed on the side in which Index sustains decisively.
The upward moment may lead the Index to 58200 – 58300 resistance range in upward momentum and if the index crosses and sustains above this level then may reach near 58900 – 59000 range.
On the contrary, The downward moment may drag the Index to 56800 – 56700 support range in downward momentum and if this support
Finnifty Intraday Analysis for 28th August 2026NSE:CNXFINANCE
Index is near 26500 resistance and if Index breaks and sustains 26500 level then uptrend is expected to continue.
The upward movement may lead the Index to 26550 - 26600 resistance range and if the index crosses and sustains above this level then may reach near 26850 - 26900 range.
On the contrary, The downward moment may drag the to 26000 – 25950 support range and if this support too is broken then index may tank near 25700 – 25650 range.
Midnifty Intraday Analysis for 28th August 2026NSE:NIFTY_MID_SELECT
Index has resistance at 15000 strike and uptrend will be formed only if index breaks and sustains 15000 decisively.
The upward movement may lead the Index near 15100 – 15125 resistance range and if the index crosses and sustains above this level then may reach 15275 – 15300 range.
On the contrary, The downward moment may drag the index to 14800 – 14775 support range and if this support is broken then index may tank near 14625 – 14600 range.
15-minute Nifty 50 chart | August 27, 2026Based on your 15-minute Nifty 50 chart for today (August 27, 2026), here is a breakdown of the key intraday levels and zones to structure
Immediate Trading Zone
Current Price Action: Nifty opened with a sharp drop, testing the immediate support zone after a strong upward push on August 26.
Immediate Resistance (Supply Zone): 24,206.10 – 24,218.90
Context: The price is currently reacting just below this band. A sustained move above 24,220 is required to regain short-term bullish momentum.
I
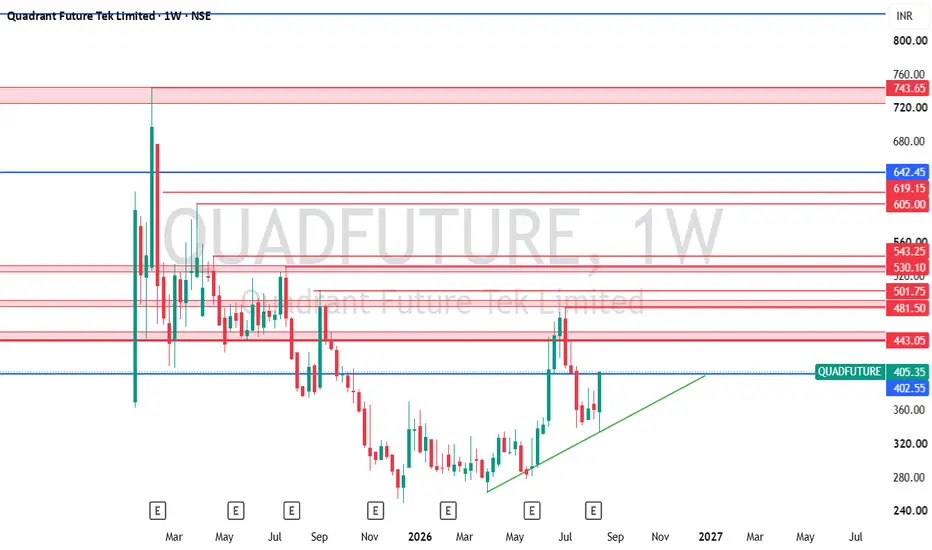
QUADFUTURE (Weekly Chart): Bullish Momentum🚀 QUADFUTURE (Weekly Chart): Bullish Momentum — Waiting for Retest/Pull-back Entry
Trade Thesis:
Following a sharp consolidation phase, NSE:QUADFUTURE has displayed a decisive bullish reversal, honoring its long-term ascending trendline. The stock locked in a 20% upper circuit backed by exceptional institutional volume (7.50M vs 30D average of ~558K). To avoid chasing fixed circuit limits, the strategy relies strictly on a pull-back or breakout consolidation entry.
Technical Parameters
XAUUSD 1H Analysis: Key Support Hold & Liquidity Grab Below ResiMarket Context
Gold (XAUUSD) on the 1-hour timeframe is currently consolidating around 4,643, recovering from a quick liquidity sweep down toward the 4,631 support area. Prior bullish momentum saw price reject strongly near the 4,680–4,684 resistance zone.
Technical Breakdown
Resistance Zones : Major resistance sits at 4,680.82 – 4,684.31, followed by higher targets at 4,705.13 and 4,671.82 acting as intermediary pivot levels.
Support Levels: Immediate support is holding well at 4,631.0
Nifty Intraday Analysis for 27th August 2026NSE:NIFTY
The index is in the 24200 - 24500 range and a trend is expected to be formed if the index breaks and sustains either side of the range.
The upward movement may lead to 24400 – 24450 resistance range and if the index crosses and sustains above this level then may reach near 24650 – 24700 range.
On the contrary, The downward moment may drag the Index to 24000 – 23950 support range in downward momentum and if this support is broken then index may tank near 23750 – 23700 range.


