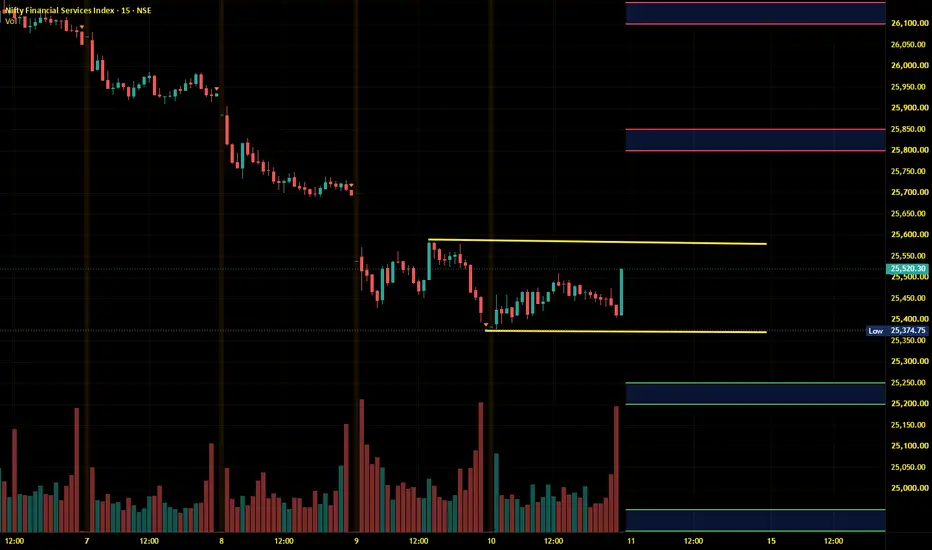
Finnifty Intraday Analysis for 15th September 2026NSE:CNXFINANCE
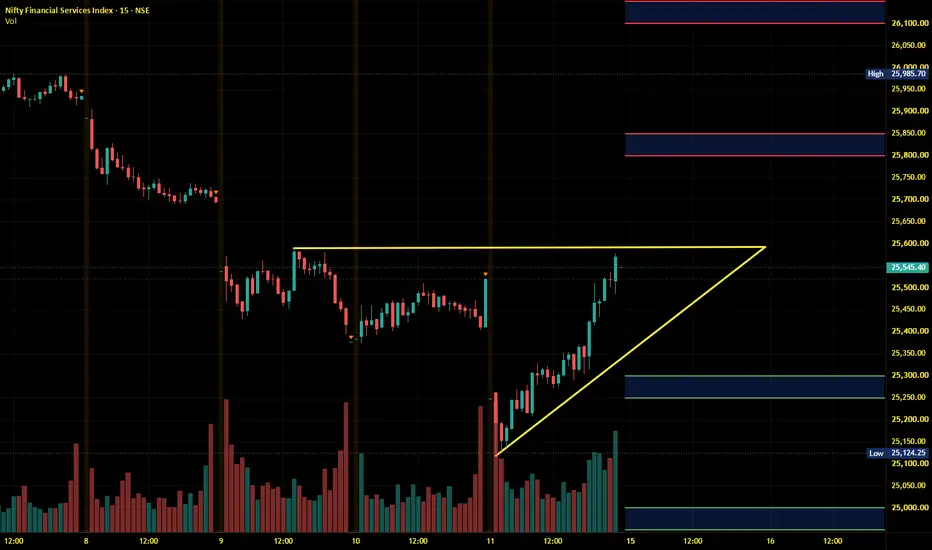
Index is near 25500 support and uptrend momentum expected to be formed if the index breaks and sustains above 25800. On the contrary, if 25500 support is broken again the downward risk upto 25000 level is expected.
The upward movement may lead the Index to 25800 - 25850 resistance range and if the index crosses and sustains above this level then may reach near 26100 - 26150 range.
On the contrary, The downward moment may drag the to 25300 – 25250 support range and if th
Support and Resistance
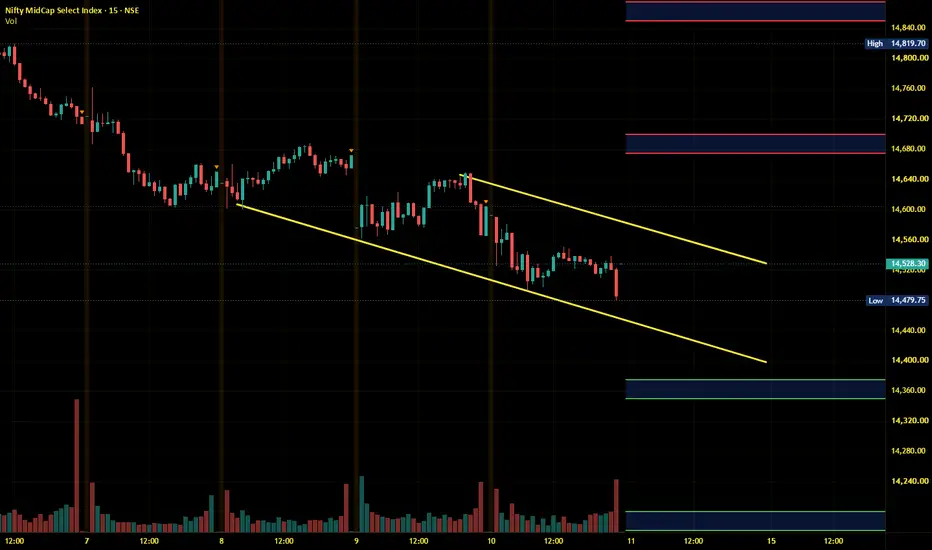
Midnifty Intraday Analysis for 15th September 2026NSE:NIFTY_MID_SELECT
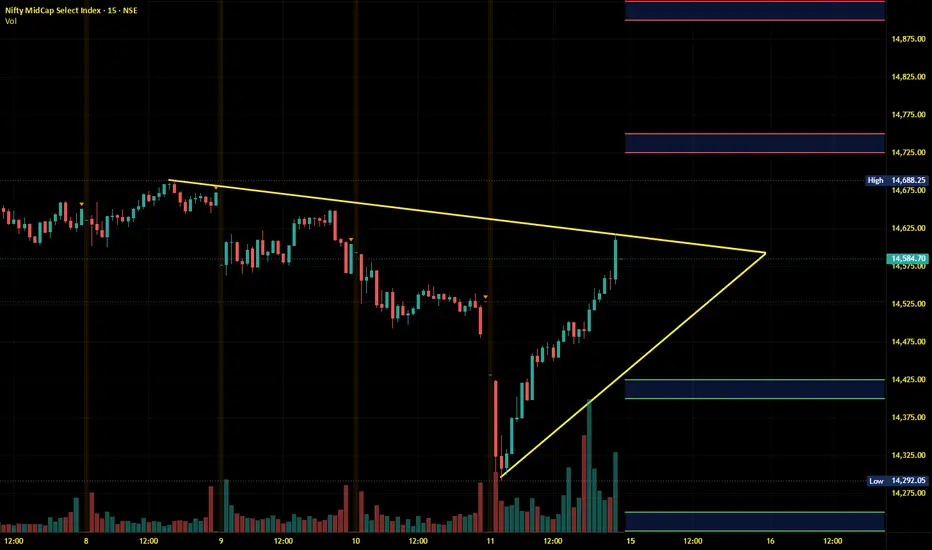
The index is in the 14500 - 14800 range and the decisive trend on either side will be confirmed if the index breaks and sustains on either side of the range.
The upward movement may lead the Index near 14725 – 14750 resistance range and if the index crosses and sustains above this level then may reach 14900 – 14925 range.
On the contrary, The downward moment may drag the index to 14425 – 14400 support range and if this support is broken then index may tank near 14250
NIFTY — Intraday Buy Setup Near 23,353Overview
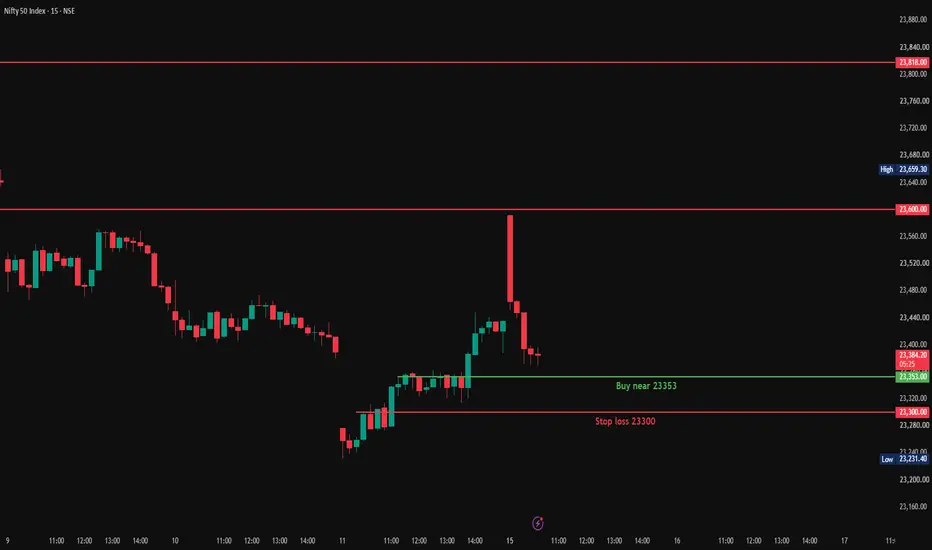
Nifty is trading at 23,375, consolidating after yesterday's sharp move up to a high of 23,592.85. Price has pulled back and is holding above a short-term support zone near 23,353, setting up a fresh intraday buying opportunity.
Trade Setup
Buy near: 23,353
Stop Loss: 23,300
Target 1: 23,410
Target 2: 23,460
Target 3: 23,520
Target 4: 23,580
Key Levels
Support: 23,353
Stop Loss: 23,300
Resistance: 23,600
Beginner's Lesson
Using small, staged targets every 50–60 points instead of o
Gold at a Potential Buying Zone Tomorrow? Key Levels to WatchGold has pulled back toward an important support area after facing resistance near the recent highs. The current price structure suggests that tomorrow could offer a potential buying opportunity, provided support holds and price confirms a bullish reversal.
On the gold chart, the key zone to monitor is around ₹4,238–₹4,277. A sustained hold above this area, followed by a move above ₹4,325, may indicate renewed bullish momentum.
Important levels
Support zone: ₹4,238–₹4,277
Immediate resistance
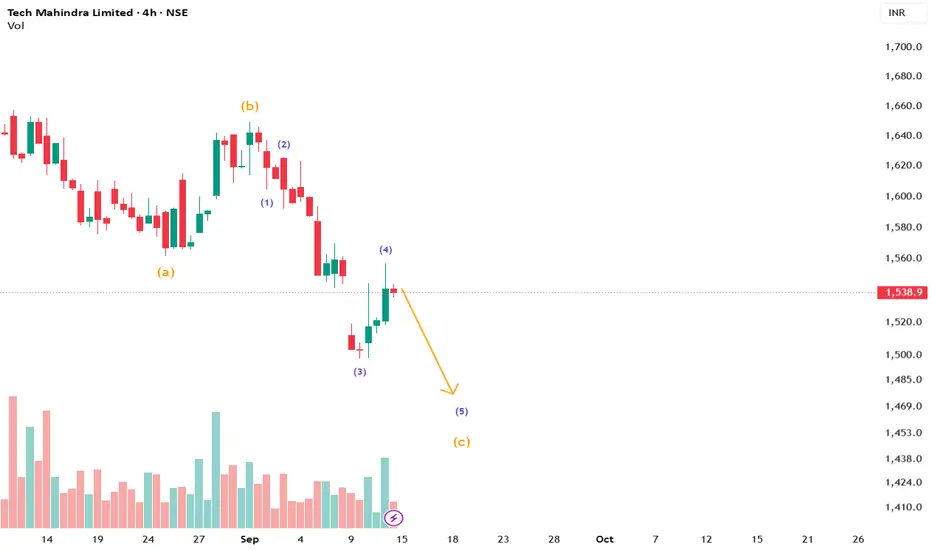
Tech Mahindra – Tracking the Final Leg LowerThe current structure suggests the (c) leg of an ABC correction may still be unfolding. Within this move, the lower-degree count appears to be progressing through Waves (1)–(5), with Wave (4) now complete.
If the structure remains intact, the final Wave (5) could extend lower and complete the larger corrective pattern around the projected zone.
The bearish count would weaken if price moves back above the recent Wave (4) high.
#TechMahindra #ElliottWave #TechnicalAnalysis #NSE #SwingTrading
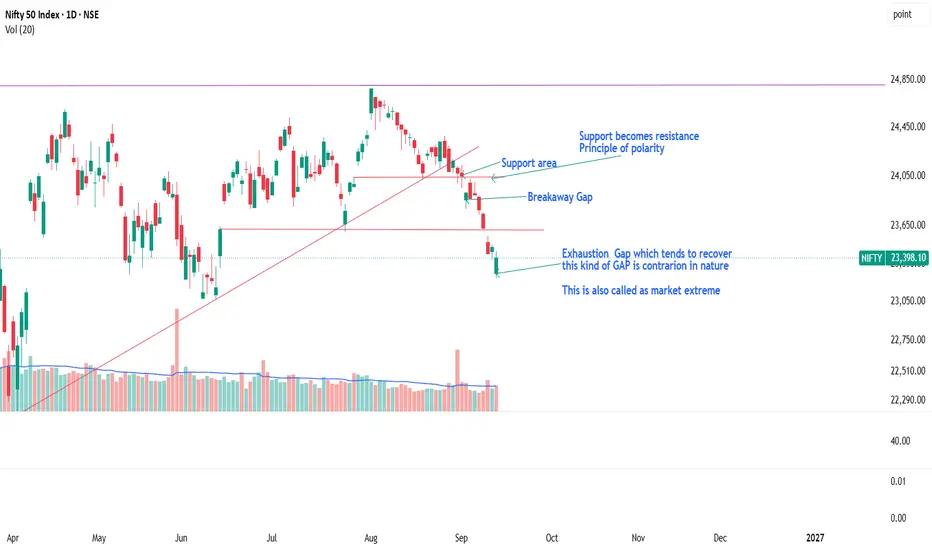
NIFTY 1D: Structural Break and Retest Leading Exhaustion climax### 📊 Executive Summary & Market Structure
This technical analysis details a structural regime shift on the daily (1D) chart of the Nifty 50 Index (NSEI). Following an extended, high-momentum advance supported by an ascending trendline, price action has transitioned into a corrective bear sequence. This breakdown has systematically executed a textbook series of classical structural principles: the violation of an ascending demand line, a structural support breach via a breakaway gap, a polar rol
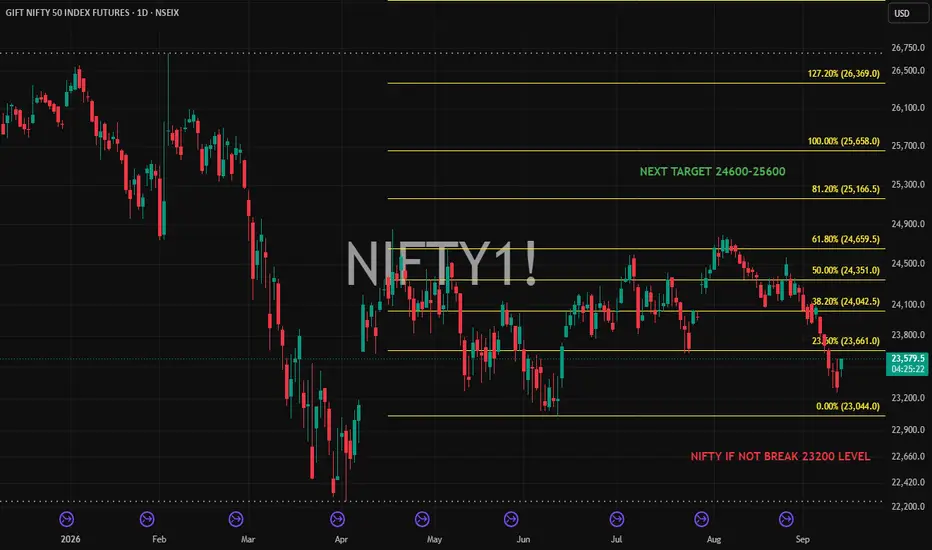
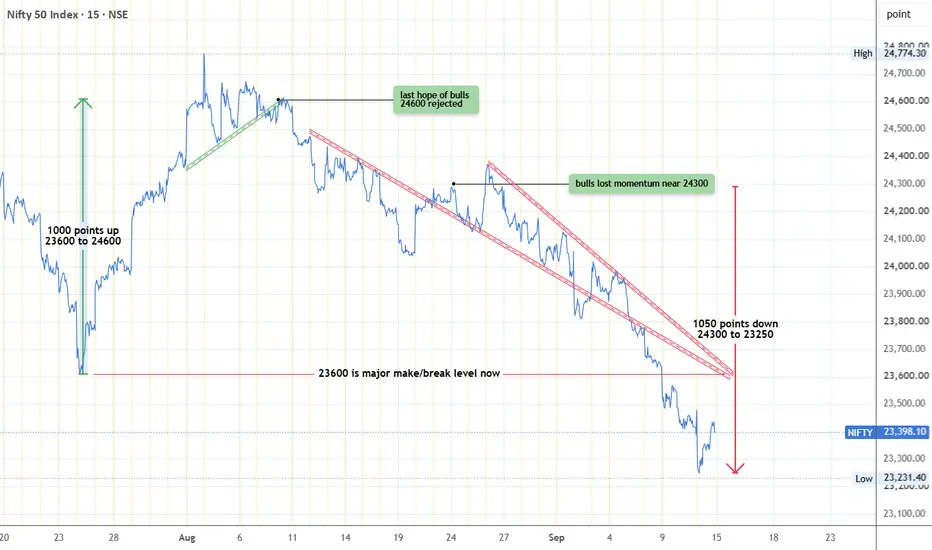
Importance of 23600 in NiftyWhat happened at 23600 was interesting to note.
Nifty gave a 1170 points rally and touched 24774
With the implementation of CAS not much hope was left among traders to trade based on chart patterns as closing prices were not in line with charts patterns.
Bulls attempt to take Nifty up lost its momentume near 24300 and we saw a 1050 points decline to 23250.
It did not even pause at 23600 on its way down.
If we draw the downtrend trajectory on 15 mins chart we would notice 2 downtrend lines clearl
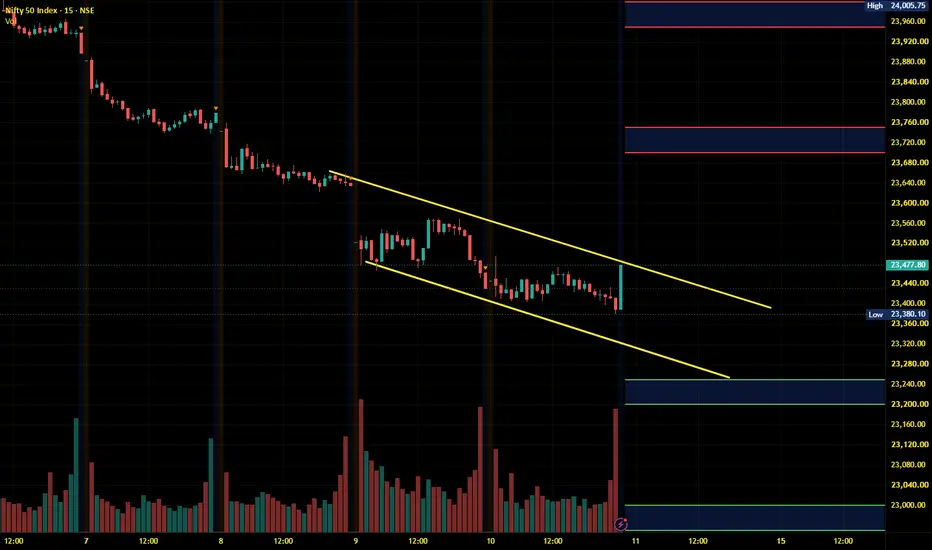
Nifty Intraday Analysis for 11th September 2026NSE:NIFTY
Index is near 23500 resistance level and uptrend momentum expected to be formed as long as the index sustains above 23500 and if 23500 resistance is not broken, the downward risk upto 23250 - 23200 range is expected.
The upward movement may lead to 23700 – 23750 resistance range and if the index crosses and sustains above this level then may reach near 23950 – 24000 range.
On the contrary, The downward moment may drag the Index to 23250 – 23200 support range in downward mom
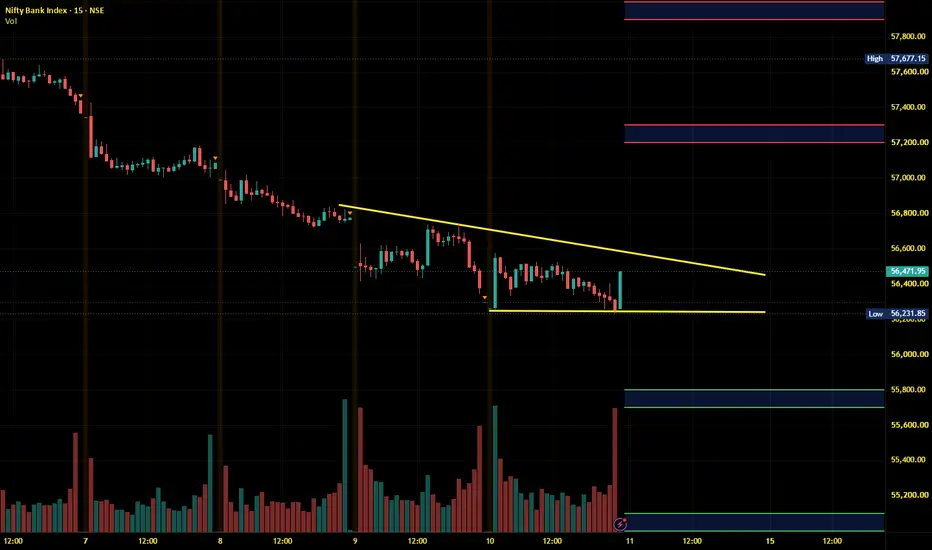
Banknifty Intraday Analysis for 11th September 2026NSE:BANKNIFTY
Index is near resistance and uptrend momentum expected to be formed as long as the index sustains above 56700 - 56800 range, else, the downward risk upto expected if 56200 - 56000 support range broken.
The upward moment may lead the Index to 57200 – 57300 resistance range in upward momentum and if the index crosses and sustains above this level then may reach near 57900 – 58000 range.
On the contrary, The downward moment may drag the Index to 55800 – 55700 support range in d
Finnifty Intraday Analysis for 11th September 2026NSE:CNXFINANCE
Index is near 25500 support and uptrend momentum expected to be formed as long as the index sustains above 25500 and if 25500 support is broken again the downward risk upto 25000 level expected.
The upward movement may lead the Index to 25800 - 25850 resistance range and if the index crosses and sustains above this level then may reach near 26100 - 26150 range.
On the contrary, The downward moment may drag the to 25250 – 25200 support range and if this support too is bro
Midnifty Intraday Analysis for 11th September 2026NSE:NIFTY_MID_SELECT
Index is near 14500 support level and bounce from the support level is expected as long as the support is not broken. However, the range bound moment is expected between 14500 - 14800 range.
The upward movement may lead the Index near 14675 – 14700 resistance range and if the index crosses and sustains above this level then may reach 14850 – 14875 range.
On the contrary, The downward moment may drag the index to 14375 – 14350 support range and if this support is bro
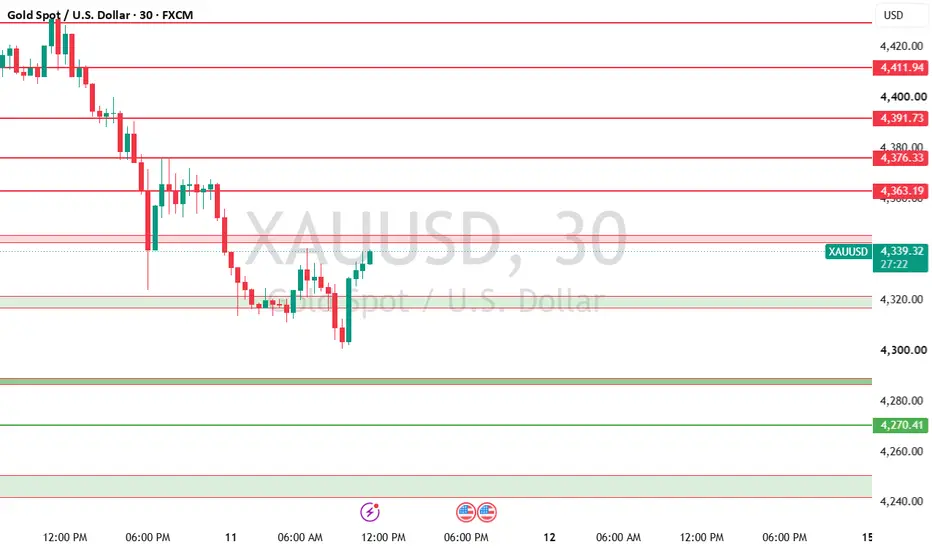
XAUUSD 30m: Intraday Consolidation & Key Rejection LevelsGold (XAUUSD) is currently moving in a tight consolidation range around the 4,334 mark on the 30-minute timeframe, following a recent downward push. Here are the key levels I am watching for the next intraday move:
Upside Resistance (Red Zones):
I have marked a series of distinct resistance hurdles above the current price action at 4,363.19, 4,376.33, 4,391.73, and 4,411.94 . If buyers can force a breakout above the immediate local resistance, these levels will act as primary targets and pot
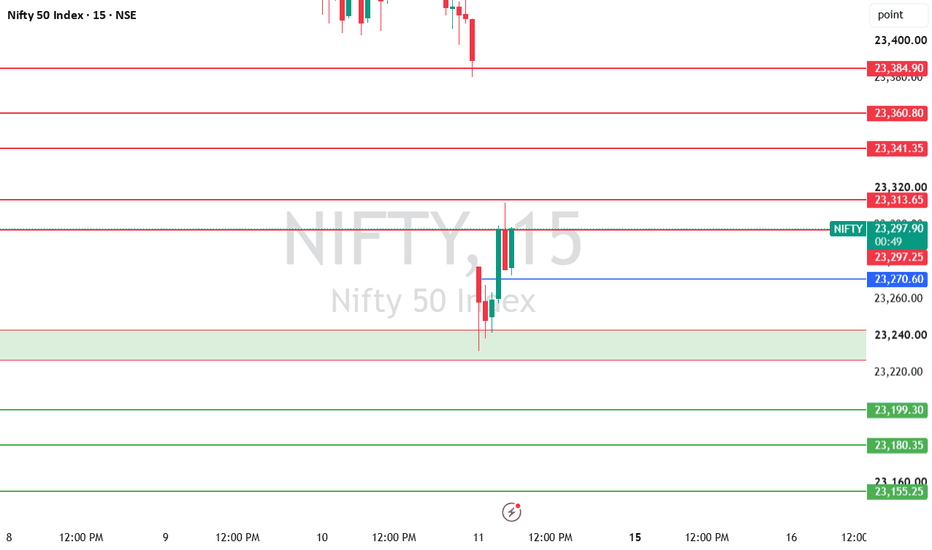
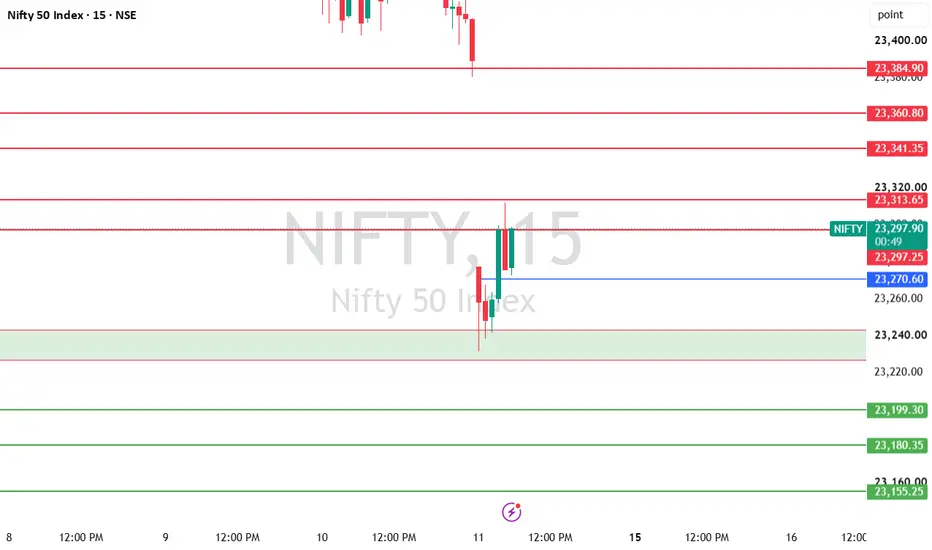
Intraday Levels Nifty 50 levels for September 11, 2026Intraday Levels
With the current price hovering around 23,280, here are the immediate horizontal levels marked on your 5-minute timeframe:
Resistance Levels (Upside)
23,297.25
23,313.65
23,341.35
23,360.80
23,384.90
Support Levels (Downside)
23,270.60 (Immediate pivot below current price)
23,240.00 (Upper edge of the green support zone)
23,199.30
23,180.35
23,155.25
Broader Market Technical Levels
Following a gap-down opening driven by weak global cues and elevated cr
Gold Aiming Bullish setup towards 4639 and 4840
PEPPERSTONE:XAUUSD is currently consolidating beneath a descending trendline resistance, while a strong horizontal resistance is also sitting around 4,443.77 .
The price is approaching a critical decision zone. A confirmed breakout above 4,443.77 , together with a break of the descending trendline, could open the way for a larger bullish move.
I am bullish on Gold because of:
Descending trendline has been acting as dynamic resistance.
4,443.77 is the key horizontal resistance.
Pr
SIGNS of REVERSAL?As we can see NIFTY reversed from our trendline support, exactly as analysed. Though the trendline is not yet touched and a minor space is still left which means NIFTY could fill in this gap. So we must wait for NIFTY to break the high of today’s candle for confirmation. So plan your trades accordingly and keep watching everyone.
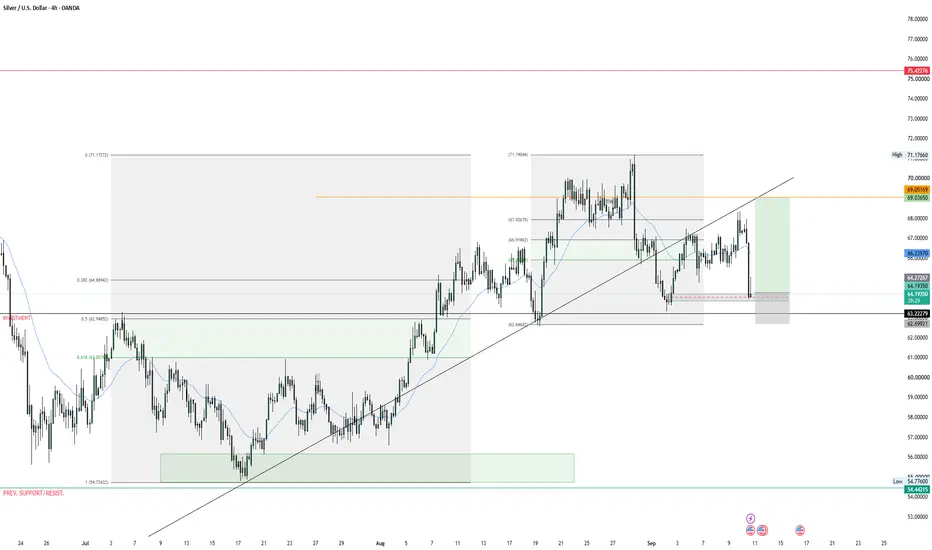
XAG/USD: High-Probability Demand Retest — Bulls Eyeing Range ExpSilver (4H): Liquidity Sweep at Key Support & Trendline Confluence Setup
XAGUSD Long Idea: Discount Zone Defense with High R:R Target
"CAN BUY SILVER ETF eg. (Nippon Silver, TATA silver ETF etc)
Instrument: Silver / U.S. Dollar (XAGUSD / OANDA)
Timeframe: 4-Hour (4h)
Bias: Bullish
Market Overview & Setup Logic
Silver has printed an impulsive upward structure and is now completing a healthy corrective retracement back into a critical multi-confluence demand zone. Following the initial impu
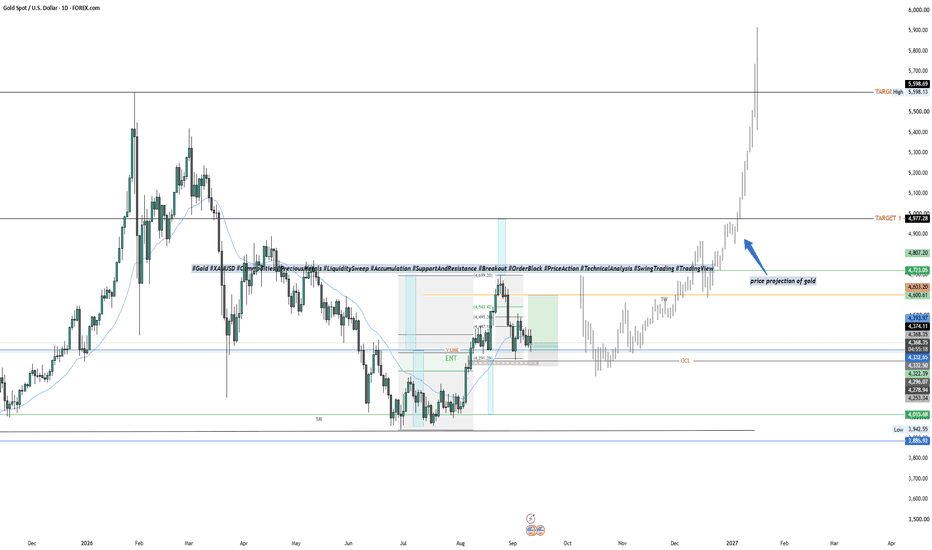
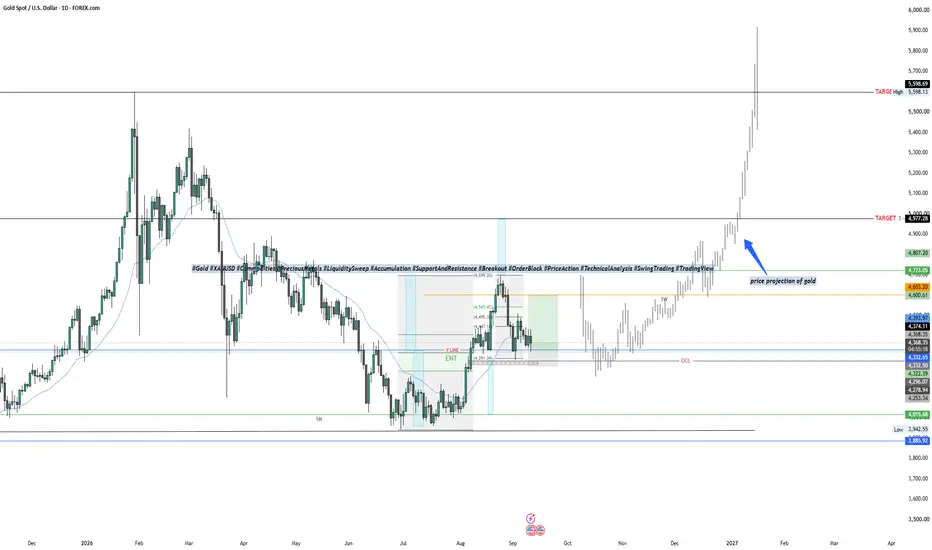
XAU/USD: Liquidity Sweep & Accumulation — The Path Toward Fresh Gold Spot (1D): Base Formed at Multi-Month Support | Bullish Expansion Ahead
XAUUSD Macro Setup: Order Block Defense and Projected Parabolic Run
Instrument: Gold Spot / U.S. Dollar (XAUUSD / FOREX.COM)
Timeframe: Daily (1D)
Bias: Bullish
Market Overview & Setup Logic
Gold has completed a classic accumulation phase following an extended correction into major monthly support (1M). The engineered downside sweep successfully purged sell-side liquidity before price reclaimed the short-term base
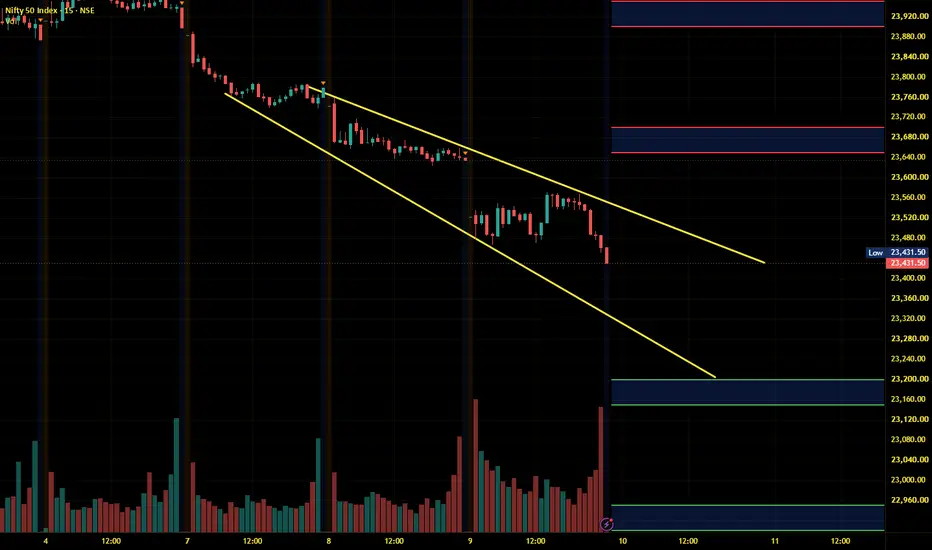
Nifty Intraday Analysis for 09th September 2026NSE:NIFTY
The 23500 support is broken and as long as the index is below this level downside moment upto 23000 level is expected.
The upward movement may lead to 23650 – 23700 resistance range and if the index crosses and sustains above this level then may reach near 23900 – 23950 range.
On the contrary, The downward moment may drag the Index to 23200 – 23150 support range in downward momentum and if this support is broken then index may tank near 22950 – 22900 range.