NIFTY| Trendline Meets Resistance — Confluence Zone on WatchOverview
After a structured decline from the January highs, NIFTY is now approaching one of the most significant technical confluences visible on the Daily chart — a point where a descending resistance trendline meets a horizontal resistance cluster near the 24,265 Swing High.
This is not a routine resistance test. It is a multi-layered confluence, and the market's reaction here will likely set the tone for the weeks ahead.
What the Chart Is Showing
📉 Descending Resistance Trendline — A clean t
Support and Resistance
NIFTY: 14-Day Rolling VWAP Remains the Key Decision ZoneNIFTY is approaching an important technical area around the 14-Day Rolling VWAP (~24,040), which has acted as resistance during today's session.
Participant-wise OI positioning continues to suggest a constructive (bullish) bias, but price confirmation is still required.
A sustained 15-minute close above the 14-Day Rolling VWAP and acceptance above 24,040 would strengthen the bullish case and shift attention toward the next resistance zone.
If price fails to reclaim this level, the market may
NIFTY 50 — Breakout Confirmed, Now Facing a Sharp RetestOverview
Nifty's Equilibrium Zone, tested four separate times since March, finally broke out on July 3 and rallied to a high of 24,530 in the sessions that followed. Today's session reversed that momentum sharply, falling 2.12% to close at 23,882 with an intraday low of 23,805 — pulling price back toward the same zone that had capped rallies through the earlier consolidation. This makes today's move a genuine retest of the breakout rather than an isolated dip.
Pattern Explanation
Between March a
Nifty Post Market Analysis Decoding Today's Price Action-110826Before jumping to any conclusion, let's first look at where the price is positioned on the weekly time frame.
One important observation is that Nifty was not able to close below last week's low. In my view, as long as Nifty does not break and close below last week's low, there is still a possibility of a bounce that could trap aggressive short sellers.
Last week's low is an important area because it can act as a major supply-demand decision zone. Markets often react sharply around such levels.
INFY | Falling Wedge Apex at ₹1,000 — Psychological Support TestOverview
Infosys — one of India's most watched IT heavyweights — is sitting at a critical technical junction today. A Falling Wedge that has been forming since February 2026 has reached its apex exactly at the ₹1,000 psychological support level. Today's opening candle is testing this confluence in real time.
The Falling Wedge
Since the February high of ₹1,728, Infosys has been declining within a well-defined Falling Wedge — two downward-sloping converging lines compressing price into a tighter
XAUUSD Weekly Plan — Don’t Chase 4,371Gold starts the new week with a bullish structure, but price is now trading in a very important decision area.
After the strong rally from the lower zones, gold is holding above the previous breakout structure and moving around 4,320 - 4,335.
The trend is still positive.
But after a strong move, I do not want to chase the middle of the chart.
I want to see how price reacts at the key zones.
The simple read
The nearest resistance is 4,371.
This is the short-term resistance area where gold
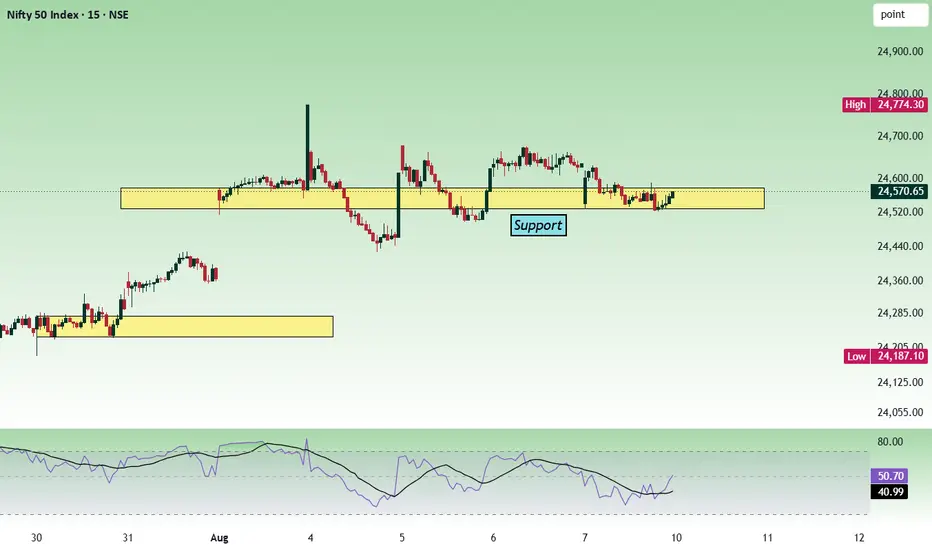
Nifty Intraday Analysis for 10th August 2026NSE:NIFTY
Highest Call OI is at 24600 strike which will act as immediate resistance and uptrend only possible if the index breaks and sustains above 24600 level.
The upward movement may lead to 24800 – 24850 resistance range and if the index crosses and sustains above this level then may reach near 25050 – 25100 range.
On the contrary, The downward moment may drag the Index to 24300 – 24250 support range in downward momentum and if this support is broken then index may tank near 24050
Banknifty Intraday Analysis for 10th August 2026NSE:BANKNIFTY
Highest Call and Put OI is built up at 58000 strike which will act as make of break level. uptrend only possible if the index breaks and sustains above 58000 level.
The upward moment may lead the Index to 58500 – 58600 resistance range in upward momentum and if the index crosses and sustains above this level then may reach near 59200 – 59300 range.
On the contrary, The downward moment may drag the Index to 57000 – 56900 support range in downward momentum and if this support i
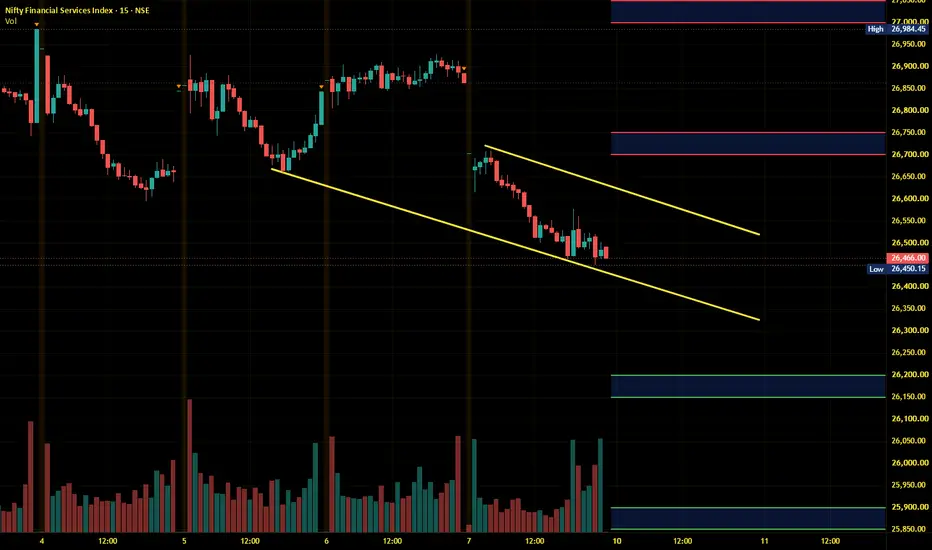
Finnifty Intraday Analysis for 10th August 2026NSE:CNXFINANCE
The downward momentum is expected to continue.
The downward moment may drag the to 26200 – 26150 support range and if this support too is broken then index may tank near 25900 – 25850 range.
On the contrary, The upward movement may lead the Index to 26700 - 26750 resistance range and if the index crosses and sustains above this level then may reach near 27000 - 27050 range.
Midnifty Intraday Analysis for 10th August 2026NSE:NIFTY_MID_SELECT
The Index has support near 14775 - 14750 range and it is broken then downward moment expected in the short term.
The upward movement may lead the Index near 5025 – 15050 resistance range and if the index crosses and sustains above this level then may reach 15200 – 15225 range.
On the contrary, The downward moment may drag the index to 14725 – 14700 support range and if this support is broken then index may tank near 14550 – 14525 range.
GOLD | Big Decision Zone — 4,150 Breakout or 3,900 Breakdown?Gold Futures — Daily Chart Study
COMEX: Gold Futures
Gold is currently trading near an important decision zone. Price is trying to hold the major support area, while the falling trendline resistance is still creating pressure on the upside.
The key support zone to watch is 3,900–3,960. As long as Gold holds this area, the structure is not fully broken and a recovery attempt can remain active.
Chart observations:
Gold is holding near an important support zone.
Falling trendline resistance is
Auropharma - Multitime frame analysisIn 15 minutes time frame, we can see a W pattern formation, which is bullish. In a one-hour timeframe, we can see the price is moving inside a channel.
Buy above 1580 with a stop loss of 1568 for the targets 1594, 1608, 1622 and 1636.
Once the price reaches the upper trendline of the channel, it has to break and sustain above it to move up further.
Always do your analysis before taking any trade.
ETHOS | Is the 2-Year Range Finally Ending? ₹3,400 Holds the KeyEthos Ltd. — Weekly Chart Research Journal
NSE/BSE: ETHOSLTD
After spending nearly two years inside a broad consolidation and repeatedly facing resistance from a falling trendline, Ethos is now attempting one of its stronger weekly breakouts from the recent structure.
The move above ₹2,850 is constructive, but the larger question is not whether the stock can produce a short-term bounce — it is whether this move can develop into a genuine weekly trend change.
Current stage: Breakout Confirmati
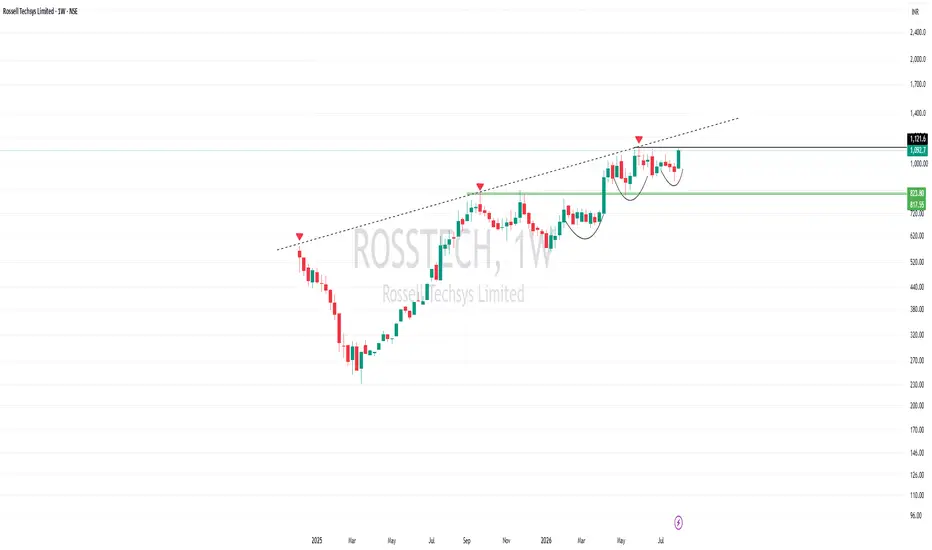
Rossell Techsys Ltd. (Weekly) – Educational Technical Analysis
This post is purely an educational breakdown of the current chart structure and the technical concepts it demonstrates.
1. Stage Analysis
The stock continues to trade in Stage 2, characterised by higher highs and higher lows. It is currently at an interesting point where the next major move will likely determine whether the primary uptrend resumes or weakens.
Bullish scenario: Breakout from the current base → Stage 2 continuation.
Bearish scenario: Breakdown below the current consol
HALDefense Indigenization: As a primary beneficiary of India’s push for defense self-reliance (Atmanirbhar Bharat), HAL enjoys a massive pipeline of domestic orders for fighter jets (such as the Tejas LCA Mk1A), trainer aircraft, and combat helicopters.
Structural Monopoly & Revenue Visibility: HAL maintains a virtual domestic monopoly on military aircraft manufacturing, paired with high-margin, recurring revenue from long-term Maintenance, Repair, and Overhaul (MRO) contracts.
Export Opportuniti
XAUUSD Weekly Plan — The NFP Breakout Changed the MapGold did not end the week quietly.
After the NFP reaction, price broke out strongly from the previous consolidation structure and pushed into a new bullish range.
Now the market is trading around 4,340 - 4,350, close to the first Fibo extension reaction area.
The trend is bullish.
But this is exactly where many traders make the same mistake:
They chase the candle after the news.
Tiara’s plan is different.
I want to see whether gold can confirm continuation or return for a clean retest.
T
Planning to buy LIC of India? Check this first.375 happens to be acting like a magnet for both buyers and sellers
The recent price action on monthly timeframe shows it is likely to act as support.
Lifetime low is 265. It may come near 360-355 levels and take a pause before showing bullish momentum.
Keep SL at 348 Tgt as 488
Levels are shown on the chart
The Science of Price Discovery: Why Markets Move the Way They Have you ever watched a stock trade around ₹1,000 for hours and then suddenly jump to ₹1,020?
Nothing magical happened.
The market was simply trying to answer one question:
What is the price buyers and sellers are willing to accept right now?
This process is called price discovery.
It is happening every second the market is open. Buyers are placing orders, sellers are responding, and price keeps moving until the market finds an area where enough participants are willing to trade.
Understan
Nifty - Weekly review August 10 to 14On Monday, we had a gap-up opening; the price opened above the important zone of 24500 and closed above it. The price did not give a big move, but moved in range after that.
The price should gain strength to move up further.
Buy above 24520 with the stop loss of 24460 for the targets 24580, 24620, 24680, 24720 and 24760.
Sell below 24380 with a stop loss of 24440 for the targets 24340, 24280, 24220, 24180 and 24120.
Always do your analysis before taking any trade.
ADBE | Strong Business, Broken Chart — Weekly Turnaround?Adobe Inc. — Weekly Trend-Change Research Journal
NASDAQ: ADBE
Adobe presents an interesting contrast right now:
The business continues to grow, while the stock has gone through a prolonged and severe correction.
After falling from much higher levels, ADBE is now attempting to recover from the $195–225 long-term support area and has started challenging its multi-year falling trendline.
Current stage: Breakout Confirmation Pending
Primary timeframe: Weekly
Intended horizon: Swing to long term
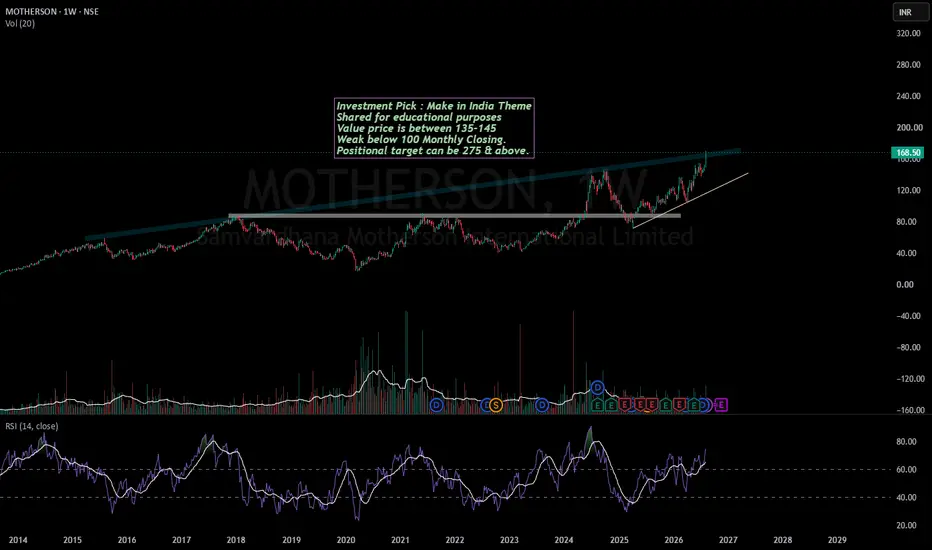
Motherson - An amazing auto ancillary stockMotherson Samvardhan has posted some amazing Q1 FY27 results similar to other Auto ancillary companies.
With the growing demand of EVs and commercial vehicles, we can see some sustainable high growth in these ancillary companies.
Stock is already in a strong uptrend and has broken a weekly trendline resistance. It is available at its 10 year average PE which is around 40.
If this stock manages to sustain above 135 for 1-2 months, we will see a strong rally which can take the stock to near 300 l
Should we enter Kalyan Jewellers now or never?Kalyan Jewellers saw good upmove from May 2024 to Jan 2025 giving 400 points move within 31 weeks
However the stock started correcting from 750 levels all the way down to 350 level by May 2026
It took 74 weeks to correct 400 points.
Now it has started moving up again and has zoomed past 450 to touch 600 within 4 weeks.
450 was the last swing high which gave us the 350 level. Now since price has moved up and sustained above 450 it will be ineteresting to see if we get a chance to enter at / nea