Banknifty Intraday Analysis for 30th July 2026NSE:BANKNIFTY
Index is near 57300 - 57400 resistance zone and if the Index breaks and sustains above this zone. However, global uncertainty and volatility may result in gap down opening.
The upward moment may lead the Index to 58000 – 58100 resistance range in upward momentum and if the index crosses and sustains above this level then may reach near 58700 – 58800 range.
On the contrary, The downward moment may drag the Index to 56500 – 56400 support range in downward momentum and if this su
Support and Resistance
Finnifty Intraday Analysis for 30th July 2026NSE:CNXFINANCE
Uptrend is expected to continue as long as the Index is above 26200. However, global uncertainty and volatility may result in gap down opening.
The upward movement may lead the Index to 26550 - 26600 resistance range and if the index crosses and sustains above this level then may reach near 26850 - 26900 range.
On the contrary, The downward moment may drag the to 26025 – 25975 support range and if this support too is broken then index may tank near 25700 – 25650 range.
Midnifty Intraday Analysis for 30th July 2026NSE:NIFTY_MID_SELECT
Uptrend is expected to continue as long as the Index is above 14600. However, global uncertainty and volatility may result in gap down opening.
The upward movement may lead the Index near 14850 – 14875 resistance range and if the index crosses and sustains above this level then may reach 15025 – 15050 range.
On the contrary, The downward moment may drag the index to 14525 – 14500 support range and if this support is broken then index may tank near 14350 – 14325 range
HAPPIESTMNDS: Accumulation Near QDZ | Momentum Building?NSE:HAPPSTMNDS
1. Structural Analysis & Price Action
⭐ Quarterly Demand Zone & Liquidity Sweep: The stock established a major floor in the ₹315 – ₹350 region (Quarterly Demand Zone). Point B represents a critical imbalance near ₹330, aggressively hunting sell-side liquidity before institutional buyers stepped in.
⭐ The Quick Vector Move (B to C): Following the imbalance at Point B, price produced a sharp impulse move ("QUICK MOVE") driving straight to Point C (~₹460.00). This rapid pric
Bitcoin structure, bearishness to continue??The up-swing which was started on 1st July, has already taken resistance from 66950 and has changed its direction and currently correcting in the bearish direction, we have spotted a declining channel which is getting respected by price, getting rejections form the upper boundary, currently after breaking below 63640 price has kept the bearish structure intact, we are expecting a further decline on the bitcoin an retest of ~61500 in near future if this declining channel sustains.
Immediate supp
XRP Bullish Reversal Setup From Key Support ZoneXRP is showing a potential bullish reversal near the $1.035–$1.050 support zone on the 4-hour chart.
Holding above $1.035 could push price toward $1.08 and $1.11–$1.12.
Trading Levels
Entry: $1.035–$1.050
TP1: $1.08
TP2: $1.11
Stop Loss: $1.03
Bias remains bullish above $1.035.
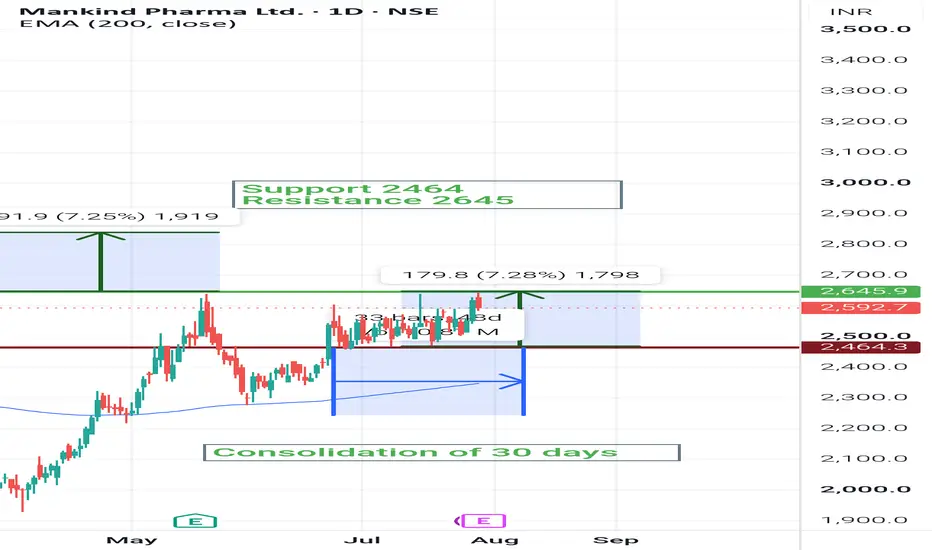
Mankind Pharma day : 29 julyMankind Pharma under consolidation,
Price range 2460-2640.
Which is of approximate 180 rs and 8%.
Once a breakout or a breakdown happens we may see same move either side.
Looking at trend chances that it will break at higher side.
Disclaimer: charts are for educational purposes.
Investment should be sole and based on self due diligence.
Charts and technical are not a guarantee of price movement..
Thanks
Nifty Intraday Analysis for 29th July 2026NSE:NIFTY
Index is near make or break 24000 level which is having highest Call and Put OI.
The upward movement may lead to 24200 – 24250 resistance range and if the index crosses and sustains above this level then may reach near 24450 – 24500 range.
On the contrary, The downward moment may drag the Index to 23775 – 23725 support range in downward momentum and if this support is broken then index may tank near 23500 – 23450 range.
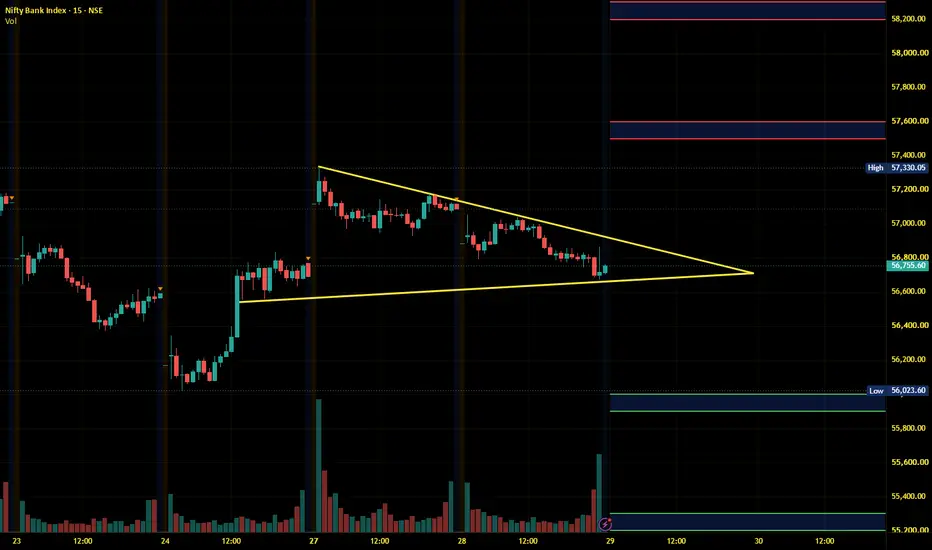
Banknifty Intraday Analysis for 29th July 2026NSE:BANKNIFTY
Index is at support and upside reversal is expected.
The upward moment may lead the Index to 57500 – 57600 resistance range in upward momentum and if the index crosses and sustains above this level then may reach near 58200 – 58300 range.
On the contrary, The downward moment may drag the Index to 56000 – 55900 support range in downward momentum and if this support is broken then the index may tank near the 55300 – 55200 range.
Finnifty Intraday Analysis for 29th July 2026NSE:CNXFINANCE
Index is near 26000 - 25950 support range and which is expected to be respected.
The upward movement may lead the Index to 26300 - 26350 resistance range and if the index crosses and sustains above this level then may reach near 26600 - 26650 range.
On the contrary, The downward moment may drag the to 25750 – 25700 support range and if this support too is broken then index may tank near 25450 – 25400 range.
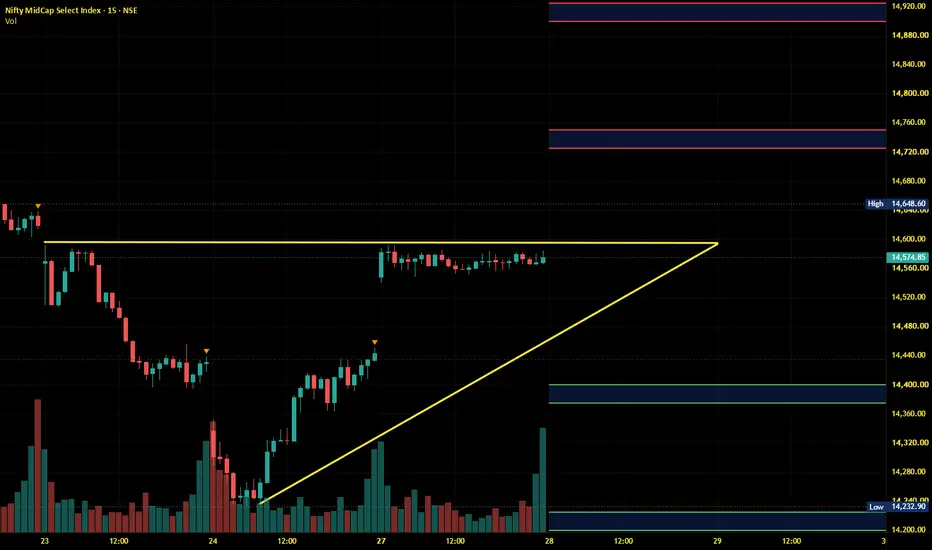
Midnifty Intraday Analysis for 29th July 2026NSE:NIFTY_MID_SELECT
Index is near 14500 support which is expected to be respected.
The upward movement may lead the Index near 14700 – 14725 resistance range and if the index crosses and sustains above this level then may reach 14875 – 14900 range.
On the contrary, The downward moment may drag the index to 14375 – 14350 support range and if this support is broken then index may tank near 14200 – 14175 range.
Sensex - Monthly expiry analysis July 30.The price opened gap up above the important support zone and is sustaining above 77500. If the price opens flat and sustains the current level, it can give a trending movement.
As per the daily chart, the price is bullish this week.
Buy above 77720 with a stop loss of 77560 for the targets 77840, 77980, 78120 and 78300.
Sell below 77400 with a stop loss of 77560 for the targets 77240, 77060, 76900 and 76740.
Always do your analysis before taking any trade.
Nifty - Monthly expiry analysis July 28We had a gap-up opening today. The price was struggling to sustain above 23940, moved in range, and now it is testing 24000.
Did we get a runaway gap today? How the price moves this week will answer.
Buy above 24020 with a stop loss of 23960 for the targets 24060, 24120, 24180 and 24220.
Sell below 23880 with a stop loss of 23940 for the targets 23820, 23780, 23720 and 23680.
Expected expiry day range is 23700 to 24200.
Always do your analysis before taking any trade.
Lodha Developers: Pullback Into Support After Strong AdvanceLodha Developers witnessed a sharp Wave (iii) rally, supported by expanding volume , indicating strong buying participation.
Price is now undergoing a healthy pullback while continuing to trade within a rising channel. The current decline is approaching a confluence of channel support and the 38.2% Fibonacci retracement, making this an important area to monitor.
If buyers defend this zone, the broader uptrend could remain intact and pave the way for the next leg higher. A break below the chan
Gold is still trading inside a bearish short-term structureXAUUSD — 4,038 Trap or 3,989?
After losing the previous triangle support, price continued to move lower and is now reacting around 4,030.
At first look, this bounce may look interesting.
But the chart is still not clean for buyers yet.
Why?
Because gold is still below the broken structure, below the descending pressure, and very close to the next OB Sell Zone around 4,038.
The simple read
Gold is currently testing the 4,030 - 4,038 reaction area.
If price reaches 4,038 and rejects, selle
BankNifty Price action analysis for Aug & SepPrice spent 12 weeks near 58000 level as it made the lifetime high of 61781
Price should have paused when it again came near 58000
instead we see it came crashing touching 50000 within 6 weeks
Price reached near 58000 level again in 12 weeks.
if it is truely bullish those who lost opportunity last time would jump in thinking it may touch 61000 again.
Instead it spent 6 weeks again at 58000 level and now it is showing signs of weakness, as bulls seem to be exhausted.
Most likely it will fall back
Nifty Intraday Analysis for 28th July 2026NSE:NIFTY
Volatility expected on the July Month F&O expiry day and swing on either side.
The upward movement may lead to 24200 – 24250 resistance range and if the index crosses and sustains above this level then may reach near 24450 – 24500 range.
On the contrary, The downward moment may drag the Index to 23800 – 23750 support range in downward momentum and if this support is broken then index may tank near 23550 – 23500 range.
Banknifty Intraday Analysis for 28th July 2026NSE:BANKNIFTY
Volatility expected on the July Month F&O expiry day and swing on either side.
The upward moment may lead the Index to 57800 – 57900 resistance range in upward momentum and if the index crosses and sustains above this level then may reach near 58500 – 58600 range.
On the contrary, The downward moment may drag the Index to 56400 – 56300 support range in downward momentum and if this support is broken then the index may tank near the 55700 – 55600 range.
UPLThe price is moving inside a descending channel. 600 zone is an important, crucial level in deciding the trend direction. The upper trend line of the channel can act as resistance. During a pullback, it can face resistance at channel trend line and fall.
Sell below 603 with a stop loss of 608 for the targets 598, 593, 589 and 583.
Always do your analysis before taking any trade.
Finnifty Intraday Analysis for 28th July 2026NSE:CNXFINANCE
Volatility expected on the July Month F&O expiry day and swing on either side.
The upward movement may lead the Index to 26400 - 26450 resistance range and if the index crosses and sustains above this level then may reach near 26700 - 26750 range.
On the contrary, The downward moment may drag the to 25850 – 25800 support range and if this support too is broken then index may tank near 25550 – 25500 range.
Midnifty Intraday Analysis for 28th July 2026NSE:NIFTY_MID_SELECT
Volatility expected on the July Month F&O expiry day and swing on either side.
The upward movement may lead the Index near 14725 – 14750 resistance range and if the index crosses and sustains above this level then may reach 14900 – 14925 range.
On the contrary, The downward moment may drag the index to 14400 – 14375 support range and if this support is broken then index may tank near 14225 – 14200 range.
PROTEAN | Weekly Recovery Attempt — ₹720 Is the Real TestProtean eGov Technologies — Weekly Chart Study
NSE: PROTEAN
After a steep correction from higher levels, Protean is attempting its first meaningful weekly recovery from the important ₹480–525 base zone.
The move above ₹600 is constructive, but the larger trend change is still pending. The real test lies between ₹675 and ₹720, where major weekly and monthly resistance is visible.
Current stage: Breakout Confirmation Pending
Primary timeframe: Weekly
Approach: Long-term weekly trend-change trac
Affle India (AFFLE) Descending Triangle Breakout | Bullish ReverAffle India Ltd. (NSE: AFFLE) has confirmed a bullish breakout from a well-defined Descending Triangle pattern on the 4-hour timeframe. After several weeks of correction, sellers gradually lost momentum while buyers consistently defended the horizontal support zone. The recent strong breakout above the descending trendline signals that demand has overpowered supply and that bullish momentum is returning.
The breakout candle is accompanied by strong buying pressure, indicating renewed market con