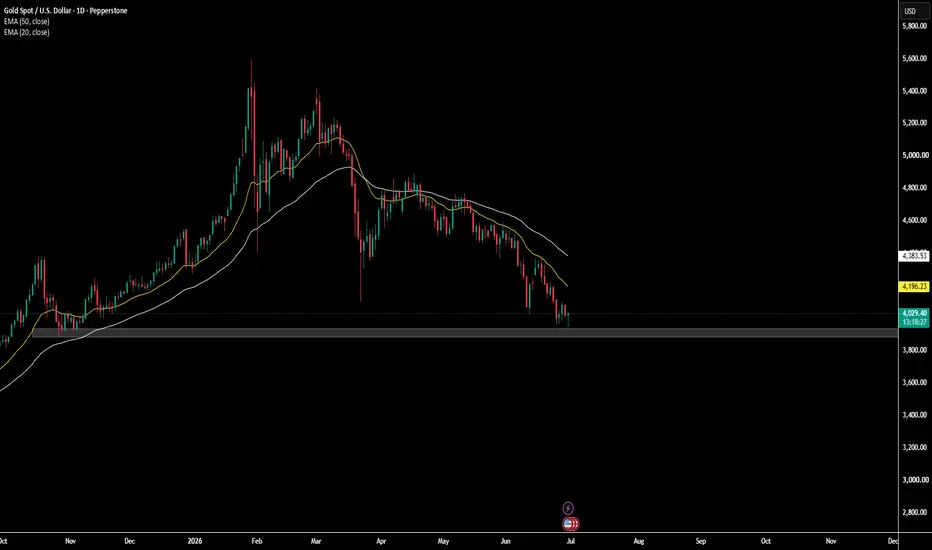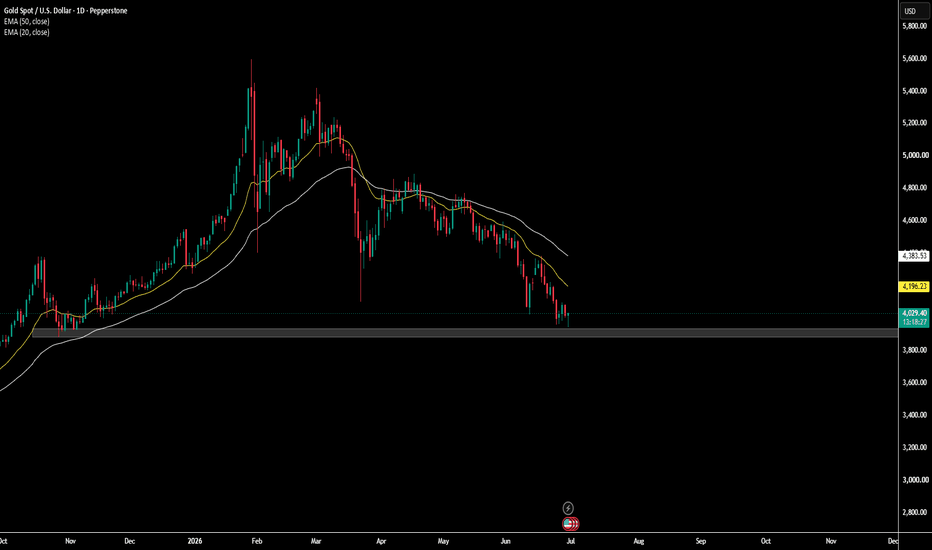
XAUUSD (Gold) — Daily | At Major Support After Record Quarterly Price: ~$4,030 | ATH: $5,602 (Jan 29, 2026) | Down ~14% this quarter — steepest on record.
Gold is sitting right at a key zone: the bottom of a falling channel + a horizontal demand area ($3,900–$3,950). This is the first real test of that zone since price broke above it last year.
Bullish case
Strong support confluence at $3,900–3,950 (channel + demand zone)
Big drop = oversold, bounce is likely even in a downtrend
Central banks + physical buyers still accumulating gold
US-Iran tension is pau
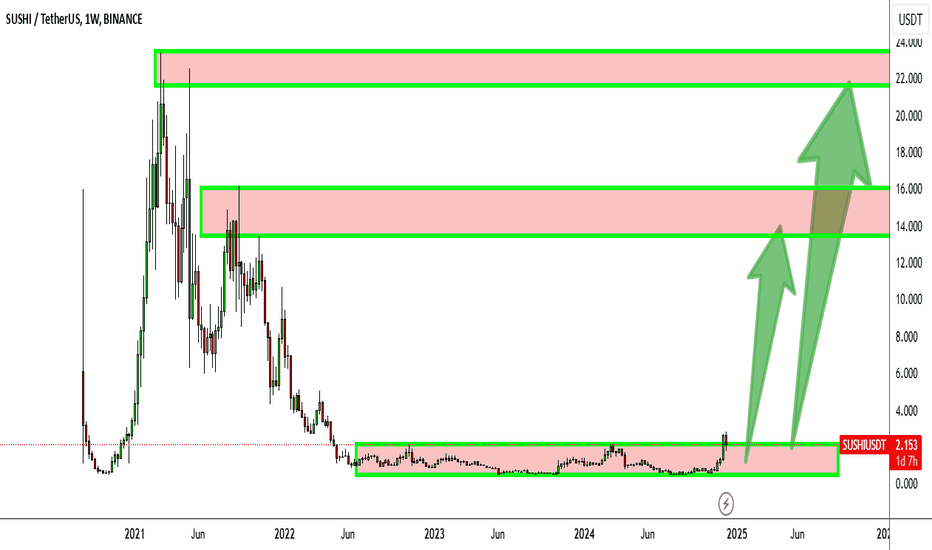
Support and Resistance
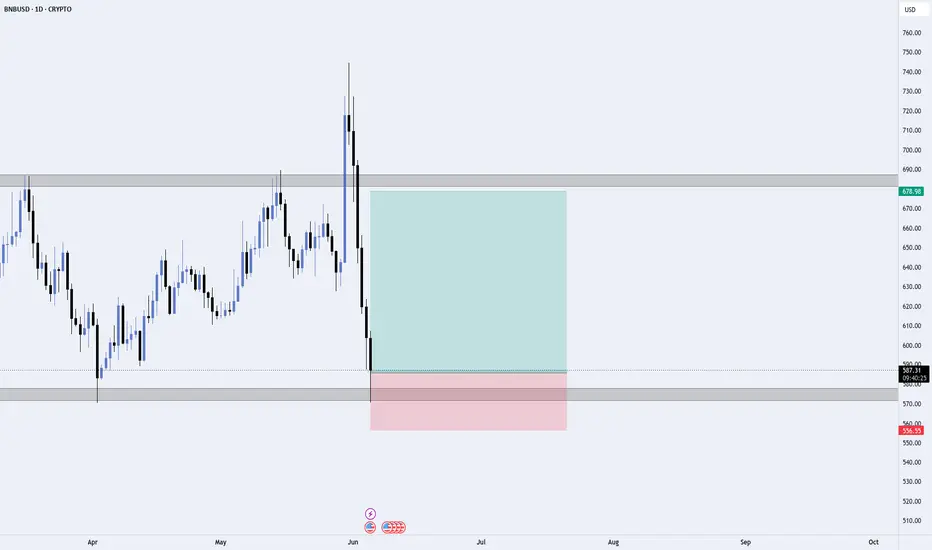
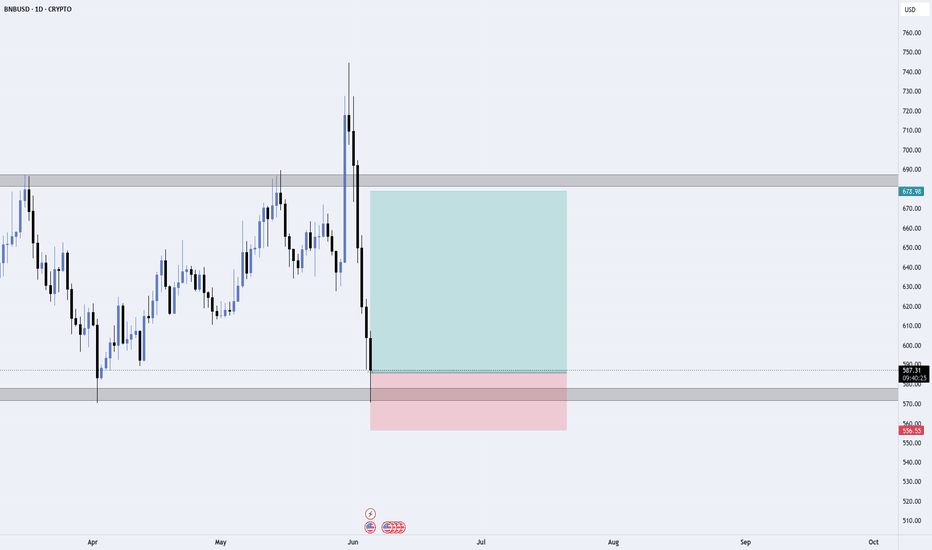
BNBUSD | Daily TimeframeBNB has experienced an aggressive sell-off into a major higher-timeframe demand zone around the $575-$580 region.
My thesis is based on a potential bullish reaction from this key support area:
• Price has reached a previously respected demand zone.
• The current move appears overextended after a strong bearish impulse.
• Risk-to-reward remains attractive with clearly defined invalidation below support.
• A successful defense of this zone could trigger a recovery toward the $675-$680 resistance
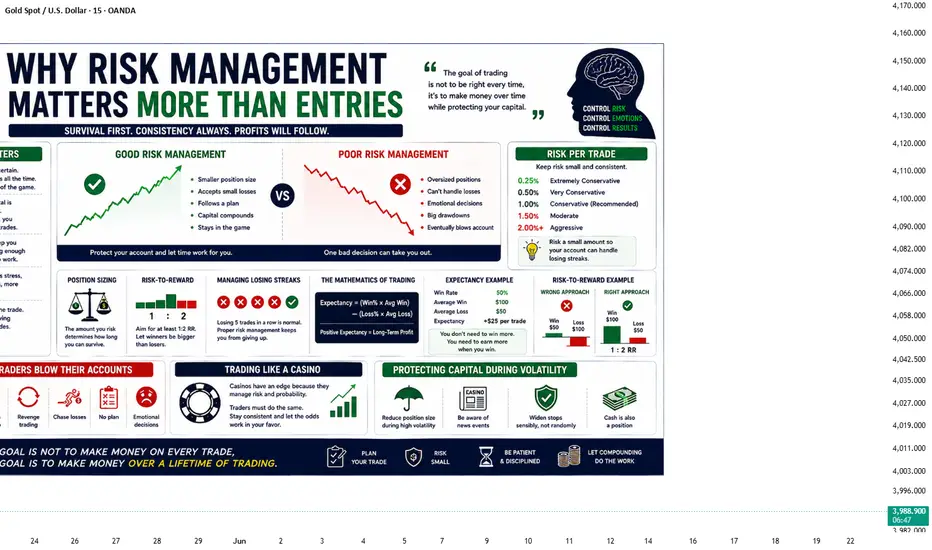
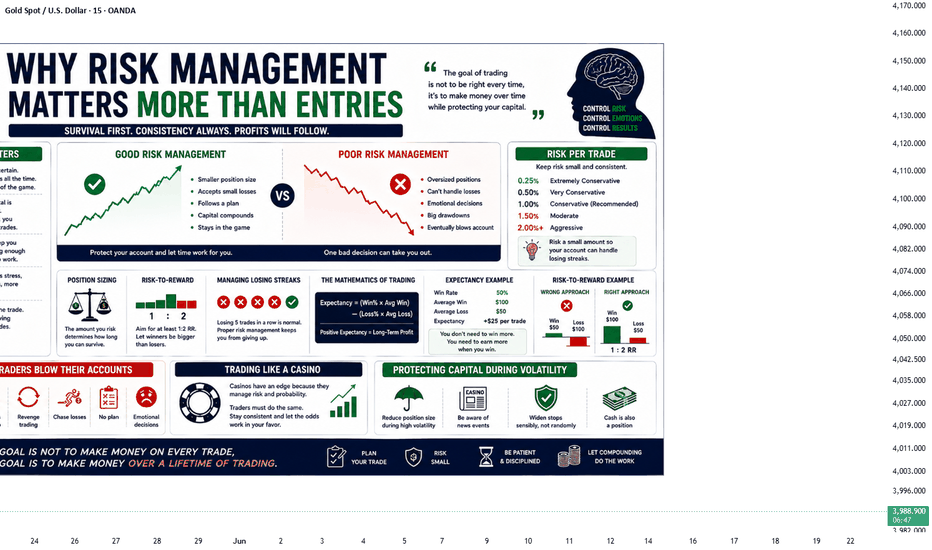
Risk Management Ask a group of traders what separates successful traders from unsuccessful ones, and many will mention strategy.
Some believe the answer is finding the perfect indicator.
Others search endlessly for the best chart pattern or the highest win-rate trading system.
While these things have value, they are not what determines long-term success.
The truth is much simpler.
A great entry cannot save poor risk management, but good risk management can survive imperfect entries.
This is one of the mos
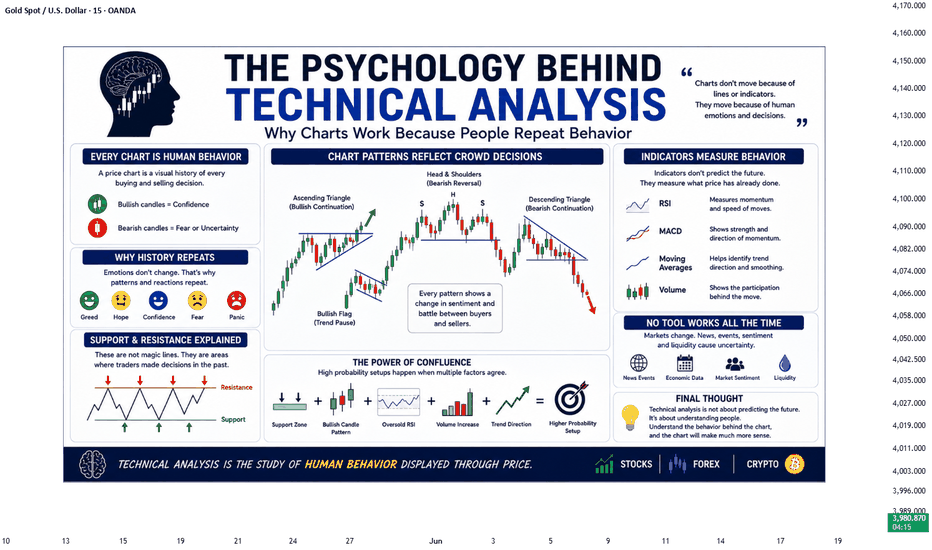
Technical AnalysisAsk two traders why they trust technical analysis, and you'll probably hear two different answers.
One might say it's because support and resistance work.
Another may point to moving averages, RSI, or chart patterns.
But beneath every indicator and every pattern lies one simple truth:
Technical analysis works because people behave in predictable ways.
Charts don't move because of lines, indicators, or mathematical formulas.
They move because millions of traders make decisions based on fe
HDFCBANK 1H | Rising Wedge Testing Support Near Range ResistanceOverview
HDFC Bank has been trading within a defined range on the 1-hour timeframe over the past three months, bounded by Range Resistance near ₹820 and Range Support levels around ₹726–730. After bouncing from the most recent range support, price has now formed a Rising Wedge as it approaches the upper boundary of this range — and it is currently testing the wedge's lower support line.
The Broader Range
Since mid-March, HDFC Bank has moved within a wide trading range. Price tested the upper bo
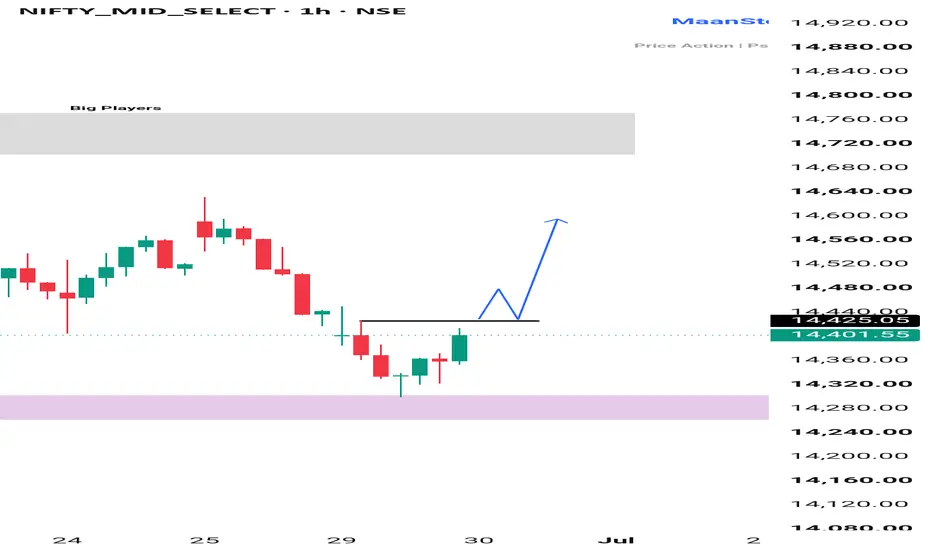
MIDCAP NIFTY ANALYSIS FOR TUESDAY 📊 MIDCAP NIFTY – Monthly Expiry Outlook (30 June)
CMP: 14,402
🔹 Midcap Nifty has bounced from the 14,280–14,320 demand zone. The next move depends on whether buyers can reclaim the breakout level.
Bullish View 🟢
• Demand zone should continue to hold.
• A break and hourly close above 14,425 can attract fresh buying.
• Upside targets: 14,550–14,600.
Bearish View 🔴
• If 14,280 breaks on a closing basis, the structure turns weak.
• Downside targets: 14,200–14,100.
⚠️ Expiry Reminder:
Midcap can
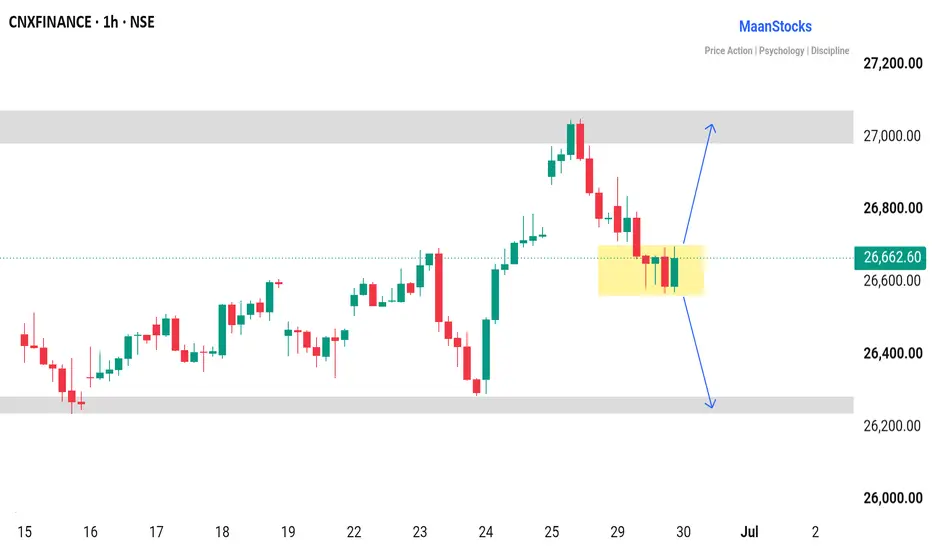
FINNIFTY VIEW FOR 30 JUNE🏦 FINNIFTY – Monthly Expiry Outlook (30 June)
CMP: 26,663
🔹 FINNIFTY is consolidating inside the 26,550–26,750 zone. Tomorrow's expiry move will likely begin after price breaks this range.
Bullish View 🟢
• Hold above the consolidation zone.
• A breakout and sustained move above 27,100 can trigger fresh buying.
• Upside targets: 27,300–27,500.
Bearish View 🔴
• A breakdown below 26,550 will weaken the short-term structure.
• Downside targets: 26,350–26,200.
⚠️ Expiry Reminder:
Avoid trading i
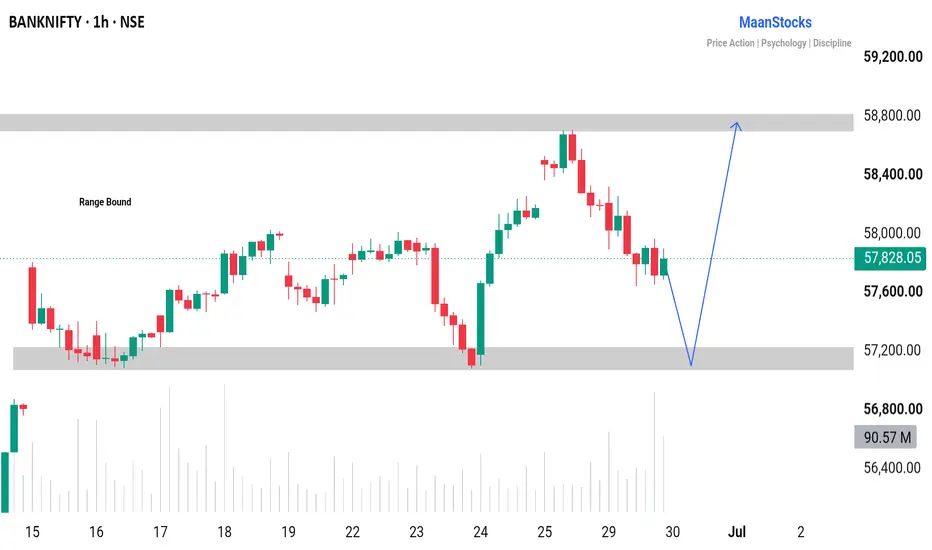
BANKNIFTY – Monthly Expiry Outlook for Tomorrow (30 June)🏦 BANKNIFTY – Monthly Expiry Outlook (30 June)
CMP: 57,828
🔹 Bank Nifty is trading inside a broad range. Tomorrow's move will depend on how price reacts near support.
Bullish View 🟢
• Strong support lies at 56,900–57,100.
• If this zone holds and buyers step in, expect a move back towards 58,800–59,000.
• A breakout and hold above 59,000 can extend the rally towards 59,300–59,500.
Bearish View 🔴
• A close below 56,900 will weaken the structure.
• Downside targets: 56,500–56,200.
⚠️ Expiry R
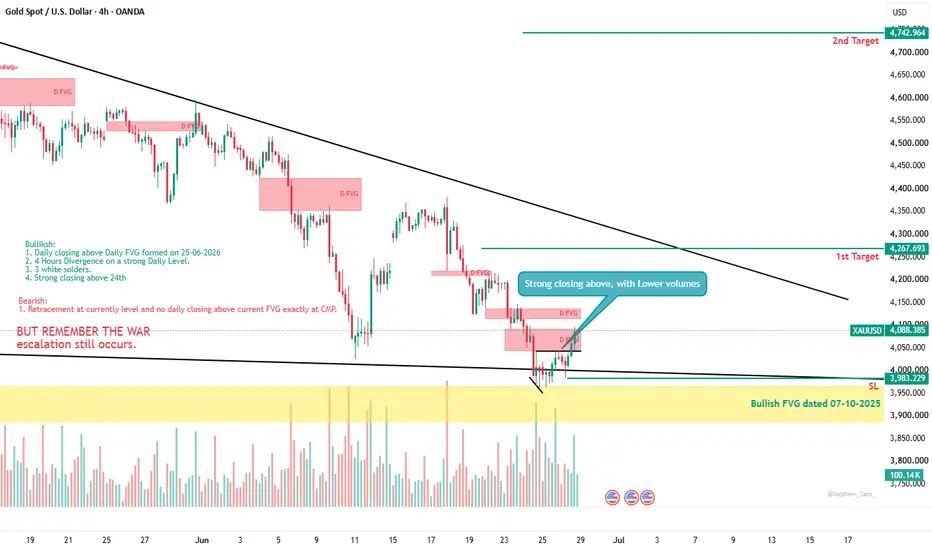
GREAT BULLISH SCENARIO BUT REMEMBER THAT ESCALATION OF US-IRANI am bullish for the following reasons.
1. Daily closing above Daily FVG formed on 25-06-2026
2. 4 Hours Divergence on a strong Daily Level.
3. 3 white solders.
The above weight is higher than 1 bearish point which is:
1. Retracement at currently level and no daily closing above current FVG exactly at CMP.
Volume analysis also indicating a sharp closing with Lower volume avove 4039.72 area.
Entry at CMP or anywhere above Bullish closing after market opens.
My SL: 3983
Target 1: 4267
Target
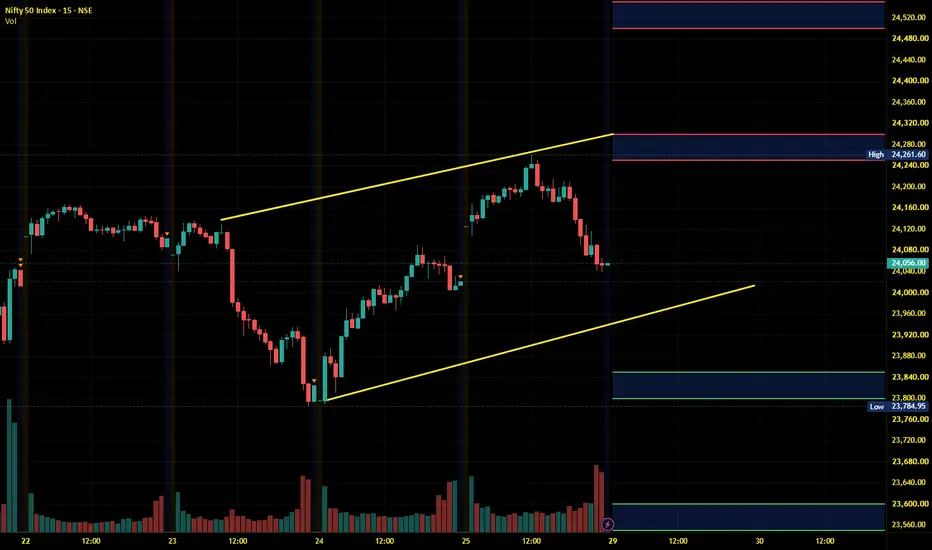
Nifty Intraday Analysis for 29th June 2026NSE:NIFTY
High volatility and a negative opening are expected due to global market turmoil and the upcoming F&O expiry on the NSE on 30th June.
The upward movement may lead to 24250 – 24300 resistance range and if the index crosses and sustains above this level then may reach near 24500 – 24550 range.
On the contrary, a downward moment may drag the Index to 23850 – 23800 support range in downward momentum and if this support is broken then index may tank near 23600 – 23550 range.
Banknifty Intraday Analysis for 29th June 2026NSE:BANKNIFTY
High volatility and a negative opening are expected due to global market turmoil and the upcoming F&O expiry on the NSE on 30th June.
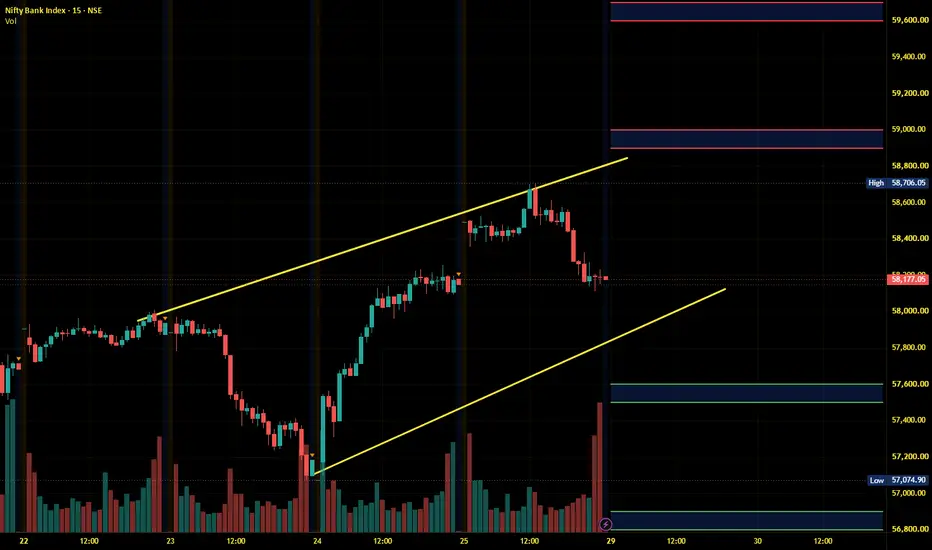
The upward moment may lead the Index to 58900 – 59000 resistance range in upward momentum and if the index crosses and sustains above this level then may reach near 59600 – 59700 range.
On the contrary, a downward moment may drag the Index to 57600 – 57500 support range in downward momentum and if this support is broken then the index may tank n
Finnifty Intraday Analysis for 29th June 2026NSE:CNXFINANCE
High volatility and a negative opening are expected due to global market turmoil and the upcoming F&O expiry on the NSE on 30th June.
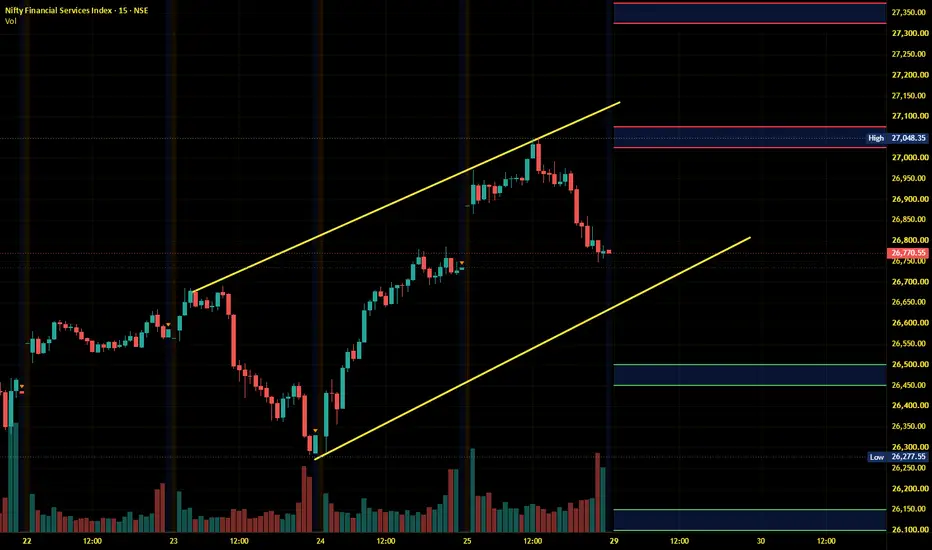
The upward movement may lead the Index to 27025 - 27075 resistance range and if the index crosses and sustains above this level then may reach near 27325 - 27375 range.
On the contrary, a downward moment may drag the to 26500 – 26450 support range and if this support too is broken then index may tank near 26150 – 26100 range.
Midnifty Intraday Analysis for 29th June 2026NSE:NIFTY_MID_SELECT
High volatility and a negative opening are expected due to global market turmoil and the upcoming F&O expiry on the NSE on 30th June.
The upward movement may lead the Index near 14600 – 14625 resistance range and if the index crosses and sustains above this level then may reach 14800 – 14825 range.
On the contrary, a downward moment may drag the index to 14300 – 14275 support range and if this support is broken then index may tank near 14125 – 14100 range.
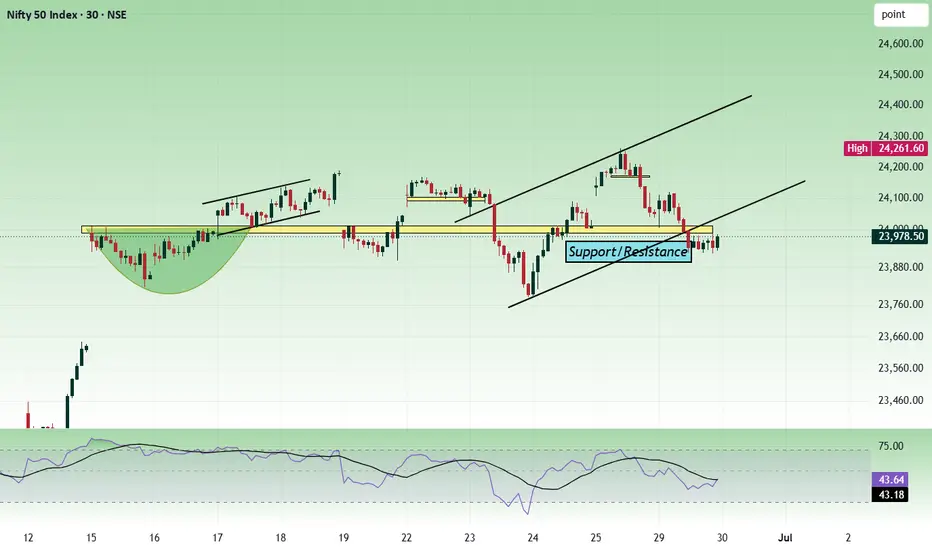
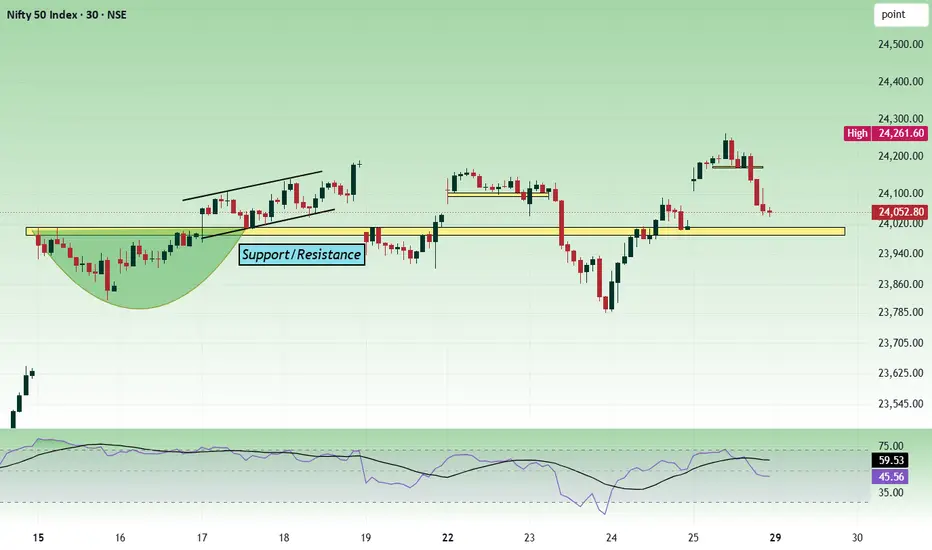
Nifty - Expiry day analysis June 30We can see the confluence at the 24000 zone formed by support/resistance and the ascending channel. The price can move within a range around this level if there is no trend strength.
To gain bullish strength, the price has to break the channel and sustain above 24020.
Buy above 24020 with the stop loss of 23960 for the targets 24060, 24120, 24180 and 24220.
Sell below 23880 with the stop loss of 23940 for the targets 23840, 23780, 23720 and 23680.
Expected expiry day range is 23700 to 24200.
Imp
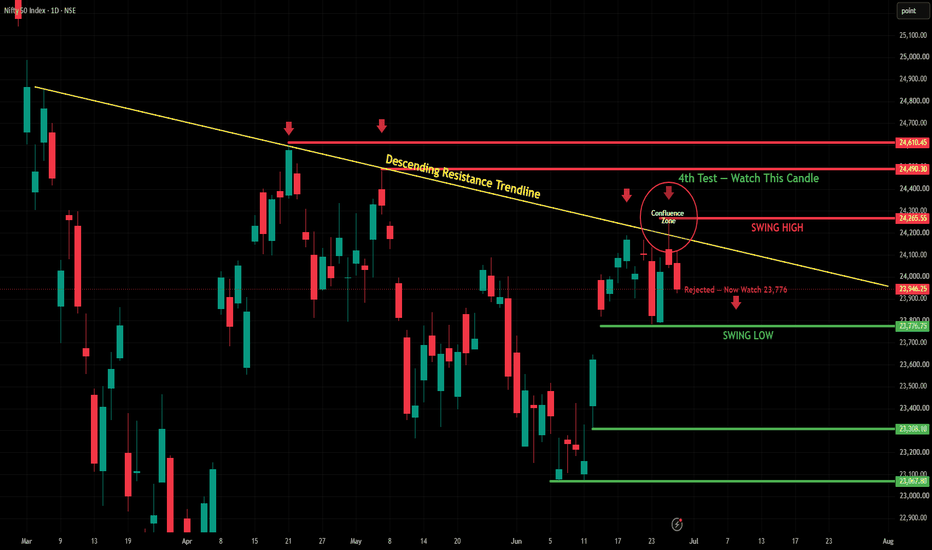
NIFTY | Confluence Zone Rejected — 23,776 Swing Low Now in FocusUpdate — What Happened
On June 27, this chart highlighted a critical Confluence Zone where the Descending Resistance Trendline met the Swing High resistance at 24,265. The analysis flagged it as the 4th test of this resistance structure and called for close attention.
Today's price action delivered the answer.
NIFTY opened at 24,061, attempted to push higher to 24,120, and then sold off sharply — closing at 23,946. The confluence zone held as resistance for the 4th consecutive time. The rejectio
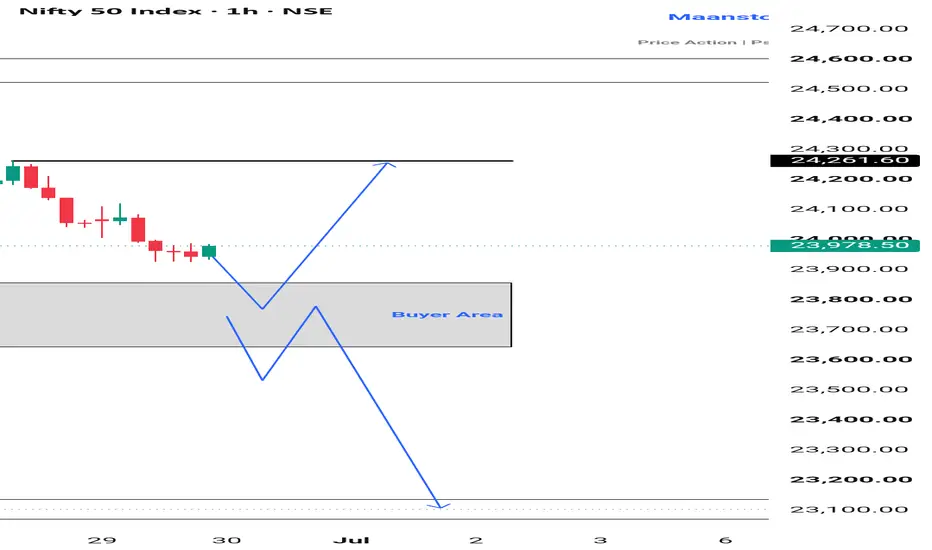
Nifty50 monthly expiry setup for tomorrow 📊 NIFTY 50 – 1H CHART ANALYSIS
CMP: 23,944
• Nifty is trading inside the 23,700–23,850 buyer zone after a healthy pullback.
• As long as this zone holds, buyers still have a chance to regain control.
• Immediate hurdle is 24,261. A clean breakout and hourly close above this level can trigger the next move towards 24,500–24,600.
• If price keeps rejecting below 24,261, expect more sideways movement inside the current range.
• A breakdown and close below 23,700 will invalidate the bullish setup
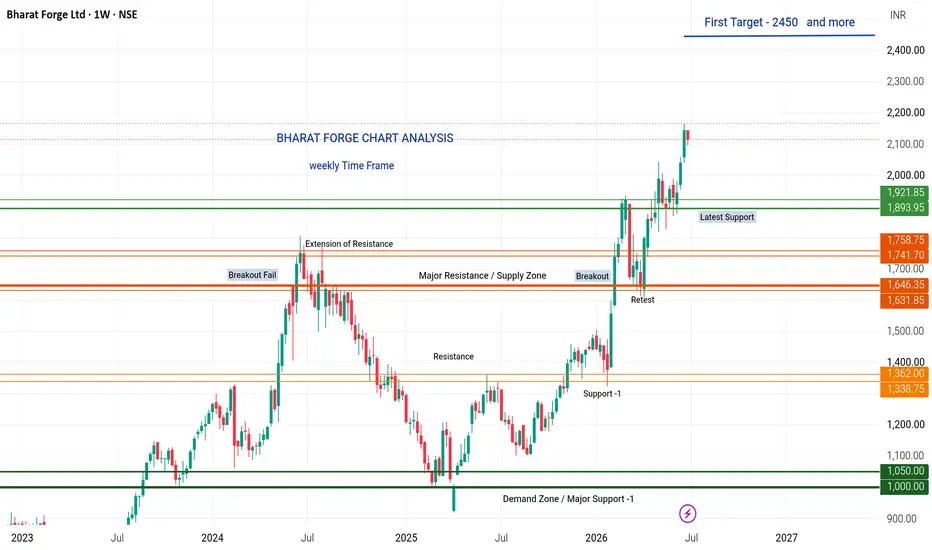
Bharat Forge Share Price Analysis: Massive Weekly Breakout BHARAT FORGE LTD – Weekly Chart Analysis
Bharat Forge continues to display a strong bullish structure on the weekly timeframe. After spending several months consolidating below the ₹1,630–₹1,650 major supply zone, the stock has finally delivered a decisive breakout. More importantly, the breakout was followed by a successful retest, where the previous resistance has now turned into a strong support. This Breakout → Retest → Continuation pattern is one of the strongest
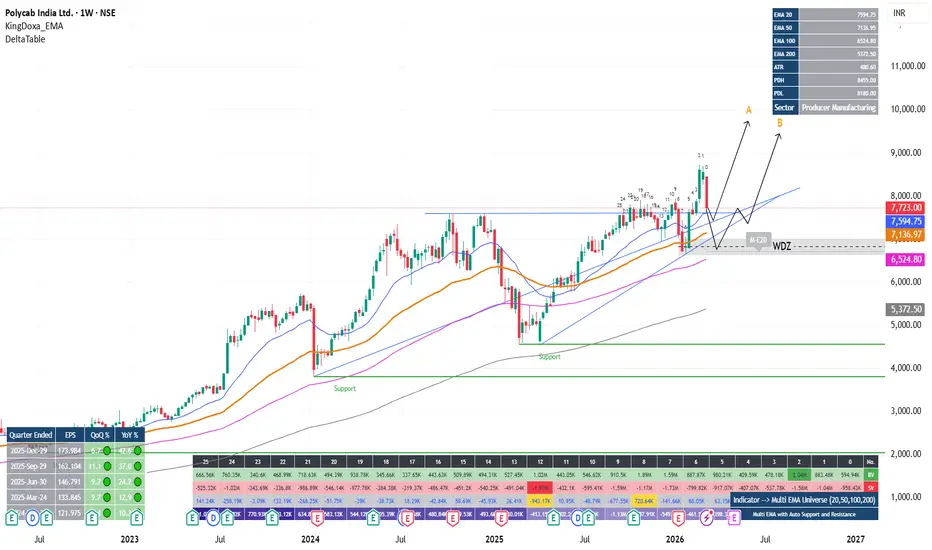
POLYCABNSE:POLYCAB
Weekly chart represent the strength of the stock.
On Weekly , stock above all major EMA validating its strength.
Nice Weekly demand zone is available around 7K which showed its strength of breakout.
Price currently returned to re-test breakout area.
On Daily , Price below EMA20 and near to EMA50 represent the pullback not a seller dominance.
Two major trendline support is also available to hold or return the price.
Two probable setups available as shown in chart.
NB:
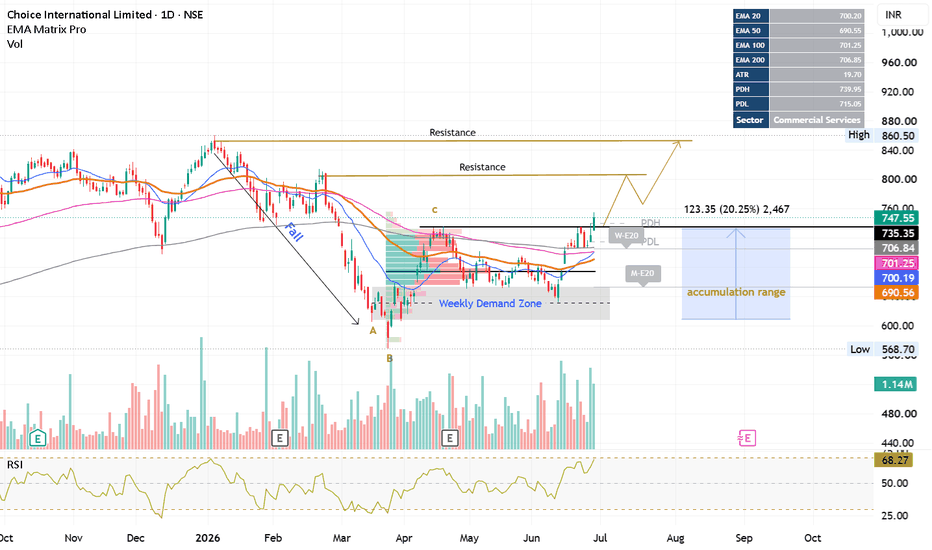
CHOICEIN : Accumulation Breakout AttemptNSE:CHOICEIN | Accumulation Breakout Attempt 🚀
Price action suggests CHOICEIN has completed a long consolidation phase after a sharp decline. The stock formed a potential accumulation structure with absorption near the ₹620–700 demand zone.
Recent price action shows:
✅ Break above EMA cluster
✅ Higher low formation
✅ Volume-backed bullish candle
✅ Momentum expansion
✅ Volume Profile also validate accumulation
Key levels to watch:
Resistance:
₹760 → ₹800 → ₹860
Support:
₹720 → ₹700 →
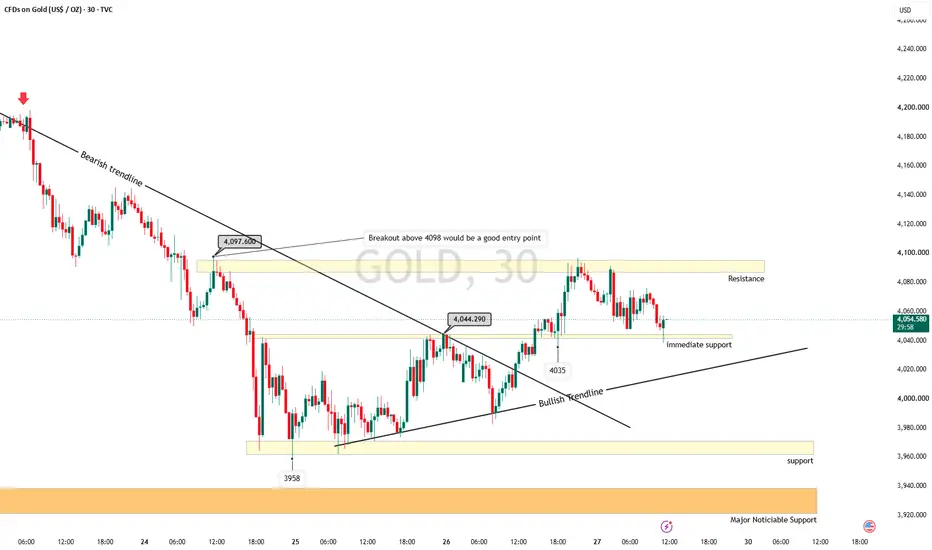
Gold Outlook and trade setup for 29th June 2026Price gave breakout above the level of 4045 on Friday & has retested the level of 4097 which is acting as an immediate resistance for the gold, if broken we can consider taking long positions, 4035 is acting as immediate support and price trying to find some strength at that level.
Trendlines should be noticed, bearish trendline broken on Friday and now it seems like price is respecting bullish trendline, price might retest the bullish trendline before showing it's continued up-move.
summary:
Nifty - Weekly review 28 June - July 3The price faced resistance at the 24260 - 24280 zone fall towards 24000. Important levels to expect a trending move are 24000, 24300 and 23900.
Buy above 24060 with the stop loss of 24000 for the targets 24100, 24160, 24220, 24280, 24340, 24400 and 24460.
Sell below 23880 with the stop loss of 23940 for the targets 23840, 23780, 23720, 23680, 23620, 23580 and 23540.
According to the daily chart, 23780-23820 is a support zone. If it breaks with bearish strength, it can test the 23300 - 23320 zon
Sensex View for 29 June 2026📊 SENSEX | NEXT WEEK ANALYSIS
CMP: 77,085
🔹 Last week, Sensex gave a strong recovery from lower levels.
🔹 Now price is testing an important demand zone around 76,900–77,000.
🔹 This zone will decide the direction for next week.
🟢 Bullish View
• If buyers defend this zone, expect a move towards 77,700–77,800.
• A strong breakout above 77,800 can extend the rally further.
🔴 Bearish View
• If 76,900 breaks with strong selling pressure, the next downside target is around 76,100–76,200.
⚠️ Key