Nifty - Expiry day analysis Sep 22As per the daily chart, the price is still forming an inside bar. On the 15th, we got a trending bearish move. The high that formed on the 15th can act as resistance.
On a lower time frame, we can see the price is moving along with the ascending channel's lower trend line.
Buy above 23420 with a stop-loss of 23360 for the targets 23460, 23500, 23560 and 23620.
Sell below 23300 with a stop loss of 23360 for the targets 23260, 23200, 23160 and 23120.
The expected expiry day range is 23200 to 2360
Support and Resistance
Nifty levels for 22nd Sep expiryThe uptrenline is resting on a bearish candle on 30 mins TF
This is early sign of weakness
Anymore selling in the 23450 level may take it down to 23330. Levels are marked on the chart.
If Nifty follows the downward projection line then 23330 is likely to be achieved by 13:30 (1:30 pm) on 22-Sep
There is intermediate support at this 23330 region and major support is near 23275
On the higher side 23575 is sellers area
XAUUSD GOLD ANALYSIS ON (21 SEP 2026)#XAUUSD UPDATE...!!!
Current price = 4340
BEST BUY AREA - 4335-4325
If price stay above 4300 then next target 4360,4380 and 4400 and below that 4280
Plan1;If price break 4335-4325 area,and stay above 4335 we will placed buy order in gold with target of 4360,4380 and 4400 & stop loss should be placed at 3300
Nifty Intraday Analysis for 21st September 2026NSE:NIFTY
The enactment of the Lindsey O. Graham Sanctioning Russia and Iran Act of 2026 empowers the US President to impose up to 100% tariffs on countries like India for importing Russian oil. Coupled with crude price surges driven by the ongoing Russia-Ukraine war and fresh Houthi-Saudi escalations, these geopolitical developments are sentimentally negative for the Indian market.
The index is near 23350 support and the index has strong resistance in the 23400 - 23500 range and if it break
Banknifty Intraday Analysis for 21st September 2026NSE:BANKNIFTY
The enactment of the Lindsey O. Graham Sanctioning Russia and Iran Act of 2026 empowers the US President to impose up to 100% tariffs on countries like India for importing Russian oil. Coupled with crude price surges driven by the ongoing Russia-Ukraine war and fresh Houthi-Saudi escalations, these geopolitical developments are sentimentally negative for the Indian market.
The index is near 56500 resistance and if index sustains above this level then uptrend is expected to cont
Finnifty Intraday Analysis for 21st September 2026NSE:CNXFINANCE
The enactment of the Lindsey O. Graham Sanctioning Russia and Iran Act of 2026 empowers the US President to impose up to 100% tariffs on countries like India for importing Russian oil. Coupled with crude price surges driven by the ongoing Russia-Ukraine war and fresh Houthi-Saudi escalations, these geopolitical developments are sentimentally negative for the Indian market.
The index is near 25500 resistance and if index sustains above this level then uptrend is expected to con
Midnifty Intraday Analysis for 21st September 2026NSE:NIFTY_MID_SELECT
The enactment of the Lindsey O. Graham Sanctioning Russia and Iran Act of 2026 empowers the US President to impose up to 100% tariffs on countries like India for importing Russian oil. Coupled with crude price surges driven by the ongoing Russia-Ukraine war and fresh Houthi-Saudi escalations, these geopolitical developments are sentimentally negative for the Indian market.
The index is at 14500 resistance and index sustains above this level and 14500 Put writing increa
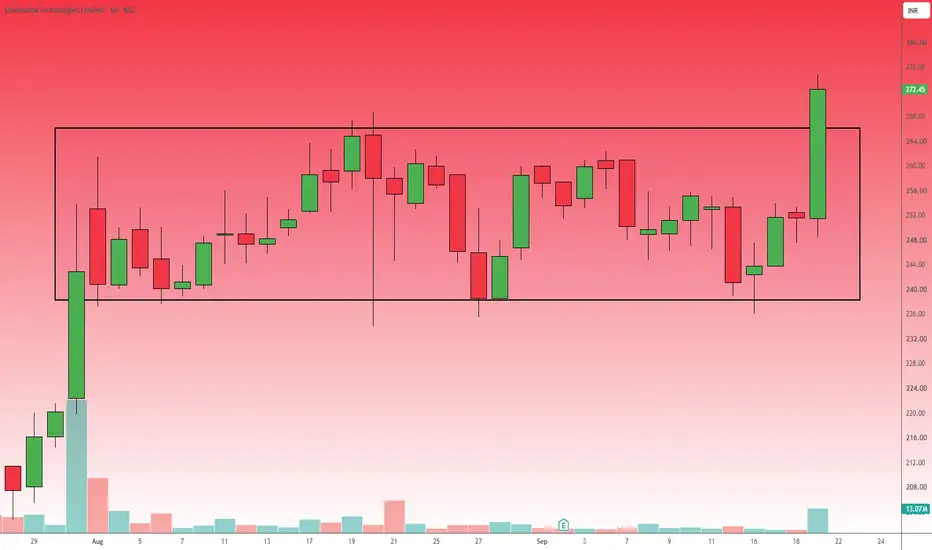
SHADOWFAX : Bullish Rectangle Breakout with Volume ConfirmationTrade Bias: Long
Chart Analysis:
As observed in Shadowfax Technologies has spent several weeks consolidating within a clear rectangular channel, bounded by support around 240.00 and resistance near 264.00.
The most recent daily price action demonstrates a definitive breakout above this resistance zone, printing a strong, full-bodied bullish candle that closed at 272.45 (+8.31%).
To satisfy the requirement of multiple technical confirmations, this pattern breakout is heavily supported by a ma
BITCOIN (BTC/USD) – DAILY CHART - Fibonacci AnalysisBitcoin is consolidating above the 0.618 Fibonacci support. A sustained breakout above $77,987 may open the way toward higher resistance levels.
🎯 TRADE LEVELS:
🟢 Entry: Above $77,987
🛑 Stop Loss: $74,616
🎯 Target 1: $82,281
🎯 Target 2: $94,681
📌 Wait for daily candle confirmation above resistance. Trail SL as price moves in your favor.
DISCLAIMER :
This content is created by Logic Trade Room for educational and informational purposes only.
It is not financial advice, investment advice,
Dr. Reddy’s Laboratories — Hourly chartBullish setup: Price has recovered strongly from the ₹1,130 support zone and reclaimed the key Fibonacci levels. It is now testing the ₹1,208 resistance / 1.0 Fib level.
Entry: Above ₹1,210 on a sustained breakout
Stop-Loss: ₹1,191
Targets: ₹1,220 → ₹1,235 → ₹1,256 (1.618 Fib)
Key levels: : ₹1,191 (0.786 Fib), ₹1,178 (0.618 Fib), ₹1,169 (0.5 Fib).
My View: A sustained breakout above ₹1,210 can open the way toward the higher Fibonacci targets. Failure to hold ₹1,191 may weaken the bulli
BAJAJ FINANCE: Bullish Reversal at Key Confluence Zone, LONG set
Overview
1. Trade Setup & Parameters
Current Market Price (CMP): ₹1,040.30 (+2.49%).
Entry Strategy: Buy in the range of ₹1,020.00 – ₹1,045.00 as the price confirms support off the trendline.
Stop Loss (SL): ₹995.00 on a daily candle closing basis (placed safely below the support zone and ascending trendline).
Target 1 (Intermediate): ₹1,100.40 (immediate horizontal swing resistance).
Target 2 (Main Objective): ₹1,150.00 – ₹1,170.60 (major overhead resistance area).
Risk-to-Reward Ra
GOLD MCX | ₹154,500 Breakout — Can Momentum Extend?Gold MCX is showing a meaningful 4-hour recovery attempt after breaking above the falling trendline that controlled price through most of September.
Price is now around ₹154,000–154,500, which makes this the first important breakout-confirmation area rather than a place to assume the move is already complete.
Current stage: 4H Breakout Confirmation
Primary timeframe: 4 Hour
Intended horizon: Short-term swing / trading
Why this chart matters now
The recent 4H structure has improved:
the fall
PWL | ₹130 Breakout Holds — Can ₹142 Open the Next Move?PWL has improved sharply on the daily chart after rebuilding strength from the recent base and reclaiming the important ₹130–132 zone.
The immediate question now is whether this breakout can hold and develop into a stronger swing move.
Current stage: Daily Breakout / Momentum Watch
Primary timeframe: Daily
Intended horizon: Short-term swing
A sustained hold above ₹130–132 keeps the current structure constructive.
The first important resistance is around ₹141–142. If price can clear and susta
AWFIS Space Solutions — Weekly Recovery WatchAWFIS has spent a long period correcting from its earlier highs and is now attempting to build a recovery from the ₹230–250 base region.
The recent move toward ₹300 was encouraging, but the latest weekly candle also showed that ₹295–305 remains an important resistance area.
So the current setup is not a confirmed long-term breakout yet.
Current stage: Early Recovery Watch
Primary timeframe: Weekly
Intended horizon: Swing to long term
Why this chart matters now
The stock has started making a
PINELABS | Weekly Breakout Retest — Can ₹192 Hold?Pine Labs has moved into an interesting phase after recovering from the ₹140–150 base area and breaking above the falling weekly trendline.
The latest move toward ₹200 was strong, but the more important question now is whether the stock can hold the breakout area rather than immediately fall back into the previous range.
Current stage: Breakout Confirmation Pending
Primary timeframe: Weekly
Intended horizon: Swing to long term
The current price near ₹192 is especially important because it sit
Nifty FMCG – A Sector to Watch Into Next WeekNifty FMCG remains in a corrective structure, with the current rebound appearing to be a smaller Wave (iv) within the ongoing decline.
The chart suggests the bounce may be close to completion in a FLAT correction, with a potential Wave (v) lower remaining in the current sequence. If the projected structure unfolds, the sector could continue to see weakness toward the next lower-degree wave target.
For now, FMCG is a sector worth keeping on the radar in the upcoming week.
#NiftyFMCG #FMCG #Ell
RPG Life Sciences – Wave (v) SetupRPG Life Sciences has completed a strong impulsive advance, followed by a correction that appears to have formed Wave (iv).
The current structure suggests a possible Wave (i)-(ii) within the next advance, with price holding above the marked Point of Ruin at ₹2,604.
The immediate focus is whether price can sustain above this level and develop the next impulsive leg. A break below ₹2,604 would invalidate the current bullish interpretation.
The chart also shows the projected Wave (iii), (iv)
VA Tech Wabag – Possible Wave iii SetupThe recent advance appears to have formed an ending diagonal, with overlapping price action near the Wave (iii) high.
Price has since corrected and appears to have formed a smaller Wave i-ii structure.
If the current structure holds, the next move could develop as Wave iii of the larger degree.
The setup remains valid as long as the recent corrective low holds. A break below it would invalidate the current interpretation.
Educational purposes only. Not investment advice.
Glenmark Pharma – Testing 0.382 Retracement for Wave ivGlenmark has completed an extended Wave (iii), followed by a corrective pullback currently labelled as Wave (iv). The correction has retraced around the 0.382 Fibonacci level of the preceding Wave (iii) advance, while also testing the rising channel support.
The current zone is therefore important for determining whether Wave (iv) is complete and the next Wave (v) can develop.
An alternate count is also marked, where the current move could be Wave (a) of a larger Wave (iv) correction. In tha
Paras Defence & Space Technologies – Channel Support SetupPARAS is undergoing a corrective Wave (iv), with the decline taking the form of a complex W-X-Y correction.
Price has retraced into the lower half of the rising channel and is currently showing a reaction from the channel support. Volume expanded during the earlier impulsive advance, while the correction has largely been accompanied by comparatively lower volume, which supports the corrective interpretation.
If the channel holds and Wave (iv) completes above the Point of Ruin at ₹1,338, the ne
Sona BLW – Coiling Before the Next MoveSona BLW has been in a strong impulsive advance, with the current structure suggesting a Wave (iv) correction. The recent price action has contracted into a tight range, forming a coiling pattern near the marked support zone.
This is also where the idea of nested waves becomes useful. Smaller-degree waves develop within larger-degree waves, and these successive contractions can build energy before the next larger move.
The support zone around ₹760–₹780 is therefore important. If it holds and t
Adani Energy Solutions Ltd. - A bounce in downtrendThe stock appears to be forming an ABC corrective structure within a rising channel after the sharp decline.
Wave C is currently testing the upper boundary of the channel. I’ll be watching how price behaves around this zone to assess whether the corrective structure is nearing completion and whether a potential Wave IV–V sequence develops.
This is a technical analysis of the price structure, not a buy/sell recommendation.
#AdaniEnergySolutions #AESL #TechnicalAnalysis #ElliottWave #ElliottWa
ICICI Prudential Life – Watching the Final LegThe current structure suggests a Wave iii decline is nearing completion, with the ongoing rebound appearing to be Wave iv.
Price is currently testing the 0.382 Fibonacci retracement near ₹473.50. If this resistance holds, the next Wave v lower could complete the larger Wave iii around the marked zone.
The key level to watch is the ₹473–₹479 area for signs of rejection.
Conditional risk caveat: If price sustains above the ₹473–₹479 resistance zone, the bearish Wave iv interpretation could weak
EURUSD Outlook for the upcoming week! Currently price is showing strong bearish moves, taking support of 1.1454 for a brief consolidation at a Fibonacci bounce-back zone, if this consolidation lasted for few more days and price forms a nice formation then we can expect breakout and moves in the upward direction (but long entries would still be risky for that we need some strong structure or breakout above 1.5666).
Otherwise looking at the downfall it seems really bearish, shorting would be the right opportunity if Price breaks belo