Symmetrical Triangle
Mastering the Symmetrical Triangle chart patternHello Friends,
Here we had shared Educational purpose post to understand & to master the Symmetrical Triangle chart pattern with real example on chart of the stock MARUTI.
Symmetrical Triangle Chart Pattern
A symmetrical triangle is a common chart pattern used by traders and investors to predict where the price of a stock or asset might go next.
What It Looks Like
Imagine two lines on a chart. One line is sloping up, and the other is sloping down. These lines meet at a point at the top
Would Aspinwall Crawl or Stand Tall ?Aspinwall and Company Limited is a multi-line business organization engaged in Logistics services across 9 branches in India, Coffee processing and trading at Mangalore, natural fiber division at Aleppey and Pollachi, Sales office in Hertogenbosch (Netherlands), Rubber plantations at Malappuram and manufacture and trading of Natural Fiber products.
Revenue Mix
Sale of products: 54%
Logistics : 46%
85% of the coffee exports are to Switzerland, Germany, Italy, England and Scandinavian countrie
Symmetrical Triangle and Pull back Pattern seen in Havells.Hello Traders & Investors,
I have brought another analysis on Symmetrical triangle pattern breakout. Well this almost similar to Triangle pattern, but in this lower band trendline act upward sloping support in security. Same we have seen in Havells. Well there is higher Chances that we can see huge momentum in coming few weeks. So let's go, i will explain a bit about this pattern so you guy's can understand and trade easily whenever you see this pattern next time.
Q:- What is Symmetrical Trian
NBCC looks all set for Big Gains.Hey guys I hope you all are doing well, making insane amount of profits.
Check out this chart for NBCC! It's like a cool artwork with a symmetrical pattern. So, for the past 5 years, it was consolidating in a beautiful range, symmetrical tringle pattern. Where initially it has dropped by around 60%, but then it bounced back and started making slightly lower highs and also higher lows.
There is another important line between support and resistance where price has been dancing around this multip
HCL TECH*HCL Tech*
Time Frame - weekly
Study -
-- After long run profit booking seen
-- After profit booking reversal seen
-- After reversal again profit booking seen
-- No consolidation going on, Kind of Symmetrical triangle pattern seen
Above 1100 looks good
This chart is only for educational purpose do your own study before taking any trades
TATA STEEL: Forming a Symmetrical Triangle PatternTata Steel is forming a Symmetrical Triangle Pattern and as per expectation it should give a breakout from 113.
Based on the pattern, one can enter after the breakout above 113 and a target can be set around 194 with Stoploss to be set around 102.
This gives us risk to reward ratio of 6.9.
Pattern is forming on weekly chart with horizon of 2-3 years.
Disclaimer:
This idea is only for education purpose, Please consult your financial advisor.
I am not SEBI registered.
FIEM INDUSTRIESThe co. enjoys a significant market share for the supply of automotive lighting & signaling equipment and rearview mirrors to Two-wheeler and Four-wheeler OEMs. It has diversified its product portfolio by venturing into LED Luminaires for Indoor and Outdoor applications and Integrated Passenger Information Systems with LED Display. It is a sole Supplier to Ola Electric for Headlamps, Tail Lamps, Indicators, Rear Fender Assembly and Mirrors. From 2018 to 2022, the co. has launched 7 models using
NAZARA - Symmetrical Continuation Triangle (Bullish) pattern Here's a breakdown of the key components and characteristics of the Symmetrical Continuation Triangle (Bullish) pattern :
Converging Trendlines: The pattern is formed by two converging trendlines, one drawn connecting the lower highs and the other connecting the higher lows. This creates a triangle-like shape on the price chart.
Price Consolidation: The pattern typically forms during a period of consolidation, where the price movement becomes range-bound. This consolidation phase signifie
Kis kisko pasand hai NESCO ?
This stock hasn't performed for a long time but on the larger time frame and uptrend it has formed a symmetrical triangle. The breakouts from the triangle are usually massive.
On the shorter time frame, I see the formation of an Inverted Head and Shoulder pattern which signifies that a bullish breakout is around the corner.
MACD on the shorter time frame also looks bullish.
Beautiful Breakout in UCO BANK.Good morning Traders.
Here is the technical analysis of UCO Bank we all should know.
>> Chart is self explanatory but to elaborating more Stock was consolidating in Symmetrical tringle pattern since 9 months. Where it has made a beautiful support and resistance lines in triangular shape and gave a Nit and clean breakout.
>>In the weekly time frame, we can observe that it had previously given a rectangular breakout after 15 months of consolidation and went up by more than 150%. Now, after this
Breakout alert in CSB bank.>>Stock has been in an uptrend since last year.
>>Over one year, it has been following a special trend line.
>>Since January 2023, it has slightly changed its direction and is now forming a beautiful
symmetrical triangle pattern.
>>Today, it has reached its resistance level and appears promising to break it.
>>If it breaks the trend line, we can initiate positions with a 1:1 risk-reward ratio as explained in the chart.
>>PSU banks were in the limelight today due to their exceptionally good
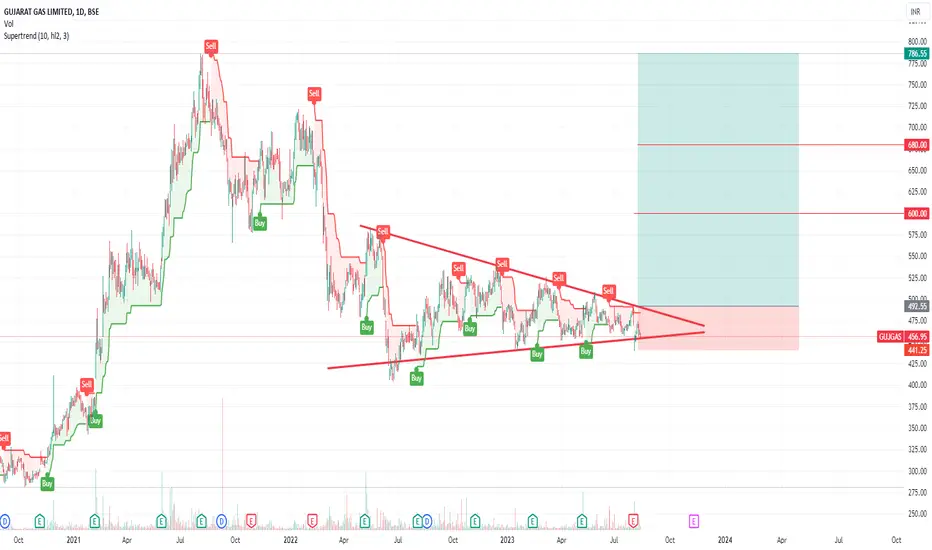
Gujarat GAS LTD | Good Opportunity Hello Friends,
Here is another stock am looking for to make position. Because
1. In sector rotation this stock / sector is in red zone means oversold zone so now it has time to come back.
2. In consolidation since long time
3. Triangle pattern which looks to strong break out up side.
4. can be small / short term swing trade for 20-30 points profit.
5. Or Good and Best for long hold
6. This sector are booming in futures so there will be good return on this stock.
So these are the points that
GLong
GODREJCP Possible tradeAnalysis in weekly time frame.
Took support nearly at 1000 . and making a neutral candlestick.
Now if crosses 1047, High possibility to reach near latest swing high at 1100 and 1150.
And if crosses 1000, then possibility to reach near horizontal support near 950 or trend line support.
And if it breaks or crosses the triangle the we can see the level of 1300 in coming few weeks.