SBI LIFE Daily chart AnalysisPossible Symmetrical Pattern Breakout in Daily time frame of SBI LIFE. If price closes above 1150, we can expect upside rally of nearly 10% in coming days. Ideal stop loss would be 1100 with risk reward of 2.5
Do your own analysis before making any financial decision. NSE:SBILIFE
Symmetrical Triangle
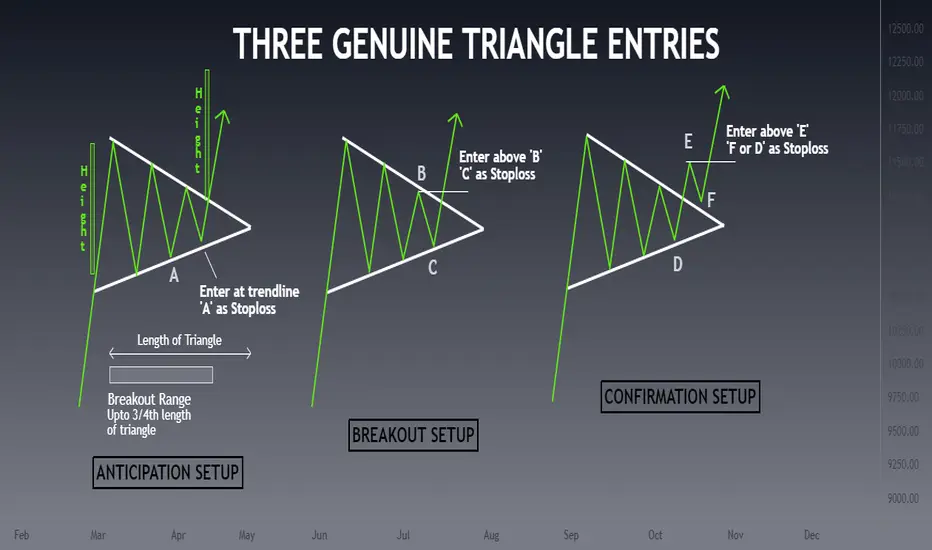
Three Genuine Triangle EntriesTriangles are very common and promising patterns. Normally they are considered as continuation patterns in the direction of prevailing trend. I am presenting here three useful entry techniques. None is better than the other and each one has its own strengths and weaknesses.
ANTICIPATION SETUP
As the name suggests, the trade is taken before the triangle breakout. It is in anticipation of a continuation breakout. Entry is taken at the third touch of the uptrendline.
Stoploss is fairly smaller
Ascending Triangle Forming : Apollo HospitalsNSE:APOLLOHOSP
Apollo Hospital is forming one of the common Technical patterns in its Chart on a daily time frame.
The technical pattern here we are talking about is Ascending Triangle.
More about Ascending Triangle:
It is formed by two lines converging towards each other, one of the lines will be a trendline heading upward and another line is a horizontal line.
The higher low of Stock forms the Trend line and the Highs of the stock form a Horizontal line.
This provides a great trading plan
Possible trend breakout in Lumax IndustriesObserved possible symmetrical triangle breakout in Lumax Industries. Previously stock was facing resistance multiple times at the trend line. Now we can see the price is moving above this trend line. We can also see increased volume at this point. We can enter the trade if the price closes above 1525. All possible targets are mentioned on the chart.
Trade set-up
1) Take position if price closes above 1525 in weekly chart.
2) Possible targets are 1723,2166,2580.
3) Stop-loss can be placed at 1
Symmetric Triangle Breakout in United Breweries In a daily Chart, already there was a symmetric triangle breakout. Probable target is given in the chart as per pattern. If it is coming for retest then 1600 should be major support next support will be 1550. These are the good level for entry, keeping stop loss below breakout candle's low that is 1490. Which is good risk reward ratio.
As per the current market situation, is better take trade in Future and option Segment with proper risk reward and hedging.
For cash Market enter with minimum
Probable upmove coming in IDEAIt is clear from the chart that IDEA has already made a symmetrical triangle pattern
And broke that with a strong bullish candle (Proving strength)
Now it made Flag & Pole pattern.
Which indicates a swing trading opportunity upto 9.35 - 9.50 level. (On the tine of publishing idea LTP was 8.8).
SL 8.20 is a must.
And also the stock is at strong support on weekly timeframe
Target 1 achieved in Adanient | 5% MoverThis idea is a follow-up to adanient
You can check the Link to Related Ideas.
Disclaimer: The information provided is for educational purposes only. Our intention is not to give any financial advice, don't take any decision without consulting your financial advisor.
Coforge | Short Term Buy | Symmetrical triangle | IT StockCoforge has been consolidating in a range from 4800 to 5800 from sometime and it formed a symmetrical triangle.
1. Buy only above 5625
2. Stop loss - 4800
3. Target 1 - 6,400
4. Target 2 - 6,800
Disclaimer : I am not a SEBI registered and this is just my analysis and sharing for education only. Do trade or invest at your own risk. I am not responsible for any profits/losses. I would suggest do your own research/consider your financial advisor before any trade/investment decision.