Sterlite Tech (W): Aggressive Bullish (Decadal Breakout)(Timeframe: Weekly | Scale: Logarithmic)
The stock has confirmed a breakout from a 10-Year Symmetrical Triangle (2014–2025). Unlike previous attempts (which left long upper wicks), this week shows a strong closing candle above the resistance, supported by "Climax Volume."
🚀 1. The Fundamental Catalyst (The "Why")
The technical explosion is fueled by a structural shift in business prospects:
> US Market Opening: The reduction in US tariffs removes a major overhang, making STL competit
Symmetrical Triangle
When Price Respects Structure: MTFAThis post is not a forecast and not a trade idea.
It’s simply a visual study of how price behaves when multiple higher-timeframe elements overlap.
Using historical price action only, this chart highlights:
-Monthly Fair Value Gap (Green Zone)
Showing how price reacts, respects, and rebalances inefficiencies over time.
-Monthly Supply Zone (Red Zone)
Clearly defining areas where price historically showed strong selling interest.
-Higher Timeframe Symmetrical Triangle (Green Lines)
Drawn from a b
Symmetrical Triangle Masterpiece : Multi-Layout W,DtfStep into this dynamic multi-layout window opened right in front of you—a split-screen showcase of pure price action artistry.
Left Side: Weekly Timeframe
Here, a symmetrical triangle (a classic continuation or reversal pattern formed by two converging trendlines of equal slope) takes center stage. Framing it are a green uptrend line (connecting higher lows for bullish structure) and a red downtrend line (linking lower highs for bearish pressure), creating a tightening coil of market indecision
Triangle Contraction Symphony: Hidden Supports, Inverted H&SWitness the mesmerizing dance of price action in this chart masterpiece. A pristine triangle contraction pattern emerges, bounded by a supportive yellow trendline below and a red counter-trendline above, perfectly channeling price within tightening bounds.
Layered hidden dotted support/resistance lines add depth, illustrating how price meticulously respects each level—time and again.
Culminating in a textbook inverted head and shoulders formation, this setup showcases contraction elegance at i
NH - STWP Equity Snapshot________________________________________
📊 STWP Equity Snapshot – NH
(Educational | Chart-Based Interpretation)
________________________________________
📌 Intraday Reference Levels (Structure-based)
Reference Price Zone: 1950
Risk Reference (If price weakens): 1829
Observed Upside Zones: 2095 → 2192
These zones highlight where intraday price reaction, pause, or expansion may occur based on recent structure.
________________________________________
📌 Swing Reference Levels
(Hybrid Model | 2–5 day
BSE - STWP Equity Snapshot________________________________________
STWP Equity Snapshot – BSE Ltd
(Educational | Chart-Based Interpretation)
📌 Intraday Reference Levels (Structure-based)
Reference Price Zone: 2,800
Risk Reference (If price weakens): 2,609
Observed Upside Zones: 3,028 → 3,181
________________________________________
📌 Swing Reference Levels (Hybrid Model | 2–5 days | Observational)
Reference Price Zone: 2,800
Risk Reference (If support breaks): 2,514
Higher Range Zones (If strength continues): 3,372 → 3,8
Kalyan Jewellers – Symmetrical Triangle Breakout (1-Day)Kalyan Jewellers is currently forming a symmetrical triangle pattern on the daily chart, indicating a period of consolidation as buyers and sellers balance out. A confirmed breakout above the upper trendline could signal the start of a new upward move, while a break below support may lead to further weakness.
At the current market price (CMP) around ₹500,
The key levels to watch are:
• Support: ₹446, ₹393
• Resistance: ₹530, ₹575
Company Overview
Kalyan Jewellers is one of India’s leadi
ITC symmetrical triangle breakout Price has broken down from a contracting structure.
Next major support sits near ₹358 (prior demand + structure support).
The recent wide-range candle + volume expansion suggests distribution, not a healthy pullback.
What to watch
A reaction near ₹358 is likely.
If price stabilizes with shrinking volume, a mean-reversion bounce is possible.
If selling pressure persists with volume, the trend shift confirms, and downside can extend.
KPI Green (D): Aggressive Bullish, Promoter-Backed MomentumTimeframe: Daily | Scale: Linear
The stock is staging a violent recovery from the bottom of a Symmetrical Triangle. While it has surged +26% in two days, it is currently testing the critical angular resistance . The move is backed by "Insider Buying," which gives it high structural conviction.
🚀 1. The Fundamental Catalyst (The "Why")
The volume explosion is driven by two major factors:
> Promoter Buying: Reports confirm that Quyosh Energia (Promoter Group) purchased shares (approx. 1
Seeing vs Believing: Multi-Pattern Structure vs Single-Line BOOn the left, the weekly chart is mapped as a full A+ type setup, where multiple structural elements work together instead of relying on a single, convenient line.
-A red counter trendline marks a series of lower-high rejection points, visually defining the “least liquidity” supply line that price has repeatedly respected.
-A dotted parallel channel outlines a broader multi-pattern context.
-A dashed hidden line adds another layer of structure, hinting at less obvious inflection zones that are
Simple Triangle Pattern on a Monthly Time FrameOverview -
This monthly chart illustrates a symmetrical triangle pattern defined by a series of higher lows and relatively stable swing highs, framed by a green ascending trendline and a red counter-trendline. The structure is presented in an observational manner to highlight how price has evolved within these converging boundaries over an extended period.
Triangle structure -
1.The green line represents the primary trendline, drawn from successive higher swing lows where price has repeatedly
Godrej Properties Symmetrical TriangleGodrej Properties is forming a Symmetrical Triangle. The recent news signify that they have acquired land / property deal worth of 2400 Cr which can boost the stock. I've outlined 4 possible targets using the Fib Tool. Not sure if it's gonna go down or up. Let me know your opinion about it.
#NaturalGas ($NG) Weekly Update — Trading at Breakout ZoneCMP: $4.400
+54% from suggested levels and +58% from lows. 🚀
Price trading in the key resistance zone $4.339–4.417.
WCB > $4.417 = Symmetrical Triangle breakout → Falling Wedge target: $5.246 🎯
🛡 Supports: $4.067 / $3.803 / $3.625–$3.572
🚧 Major Resistances:
• ST: $5.125–$5.630
• LT: $9.35–$10.00
Tight structure… breakout looks close. 🔥
#NG VANTAGE:NG #NaturalGas #Commodities #PriceAction #SymmetricalTriangle #FallingWedge #ChartPatterns #Breakout
📌 #Disclaimer:
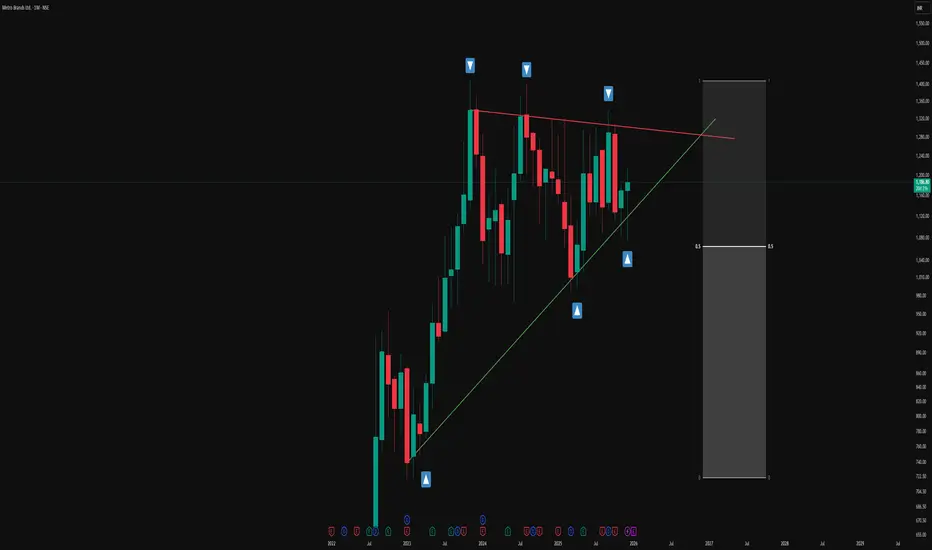
Symmetrical Triangle Formation with 50% EquilibriumVisual Structure and Pattern
-This chart illustrates a textbook symmetrical triangle pattern forming after a strong directional move.
-The red line represents the counter trendline (CT), connecting a series of lower highs.
-The green line marks the ascending trendline, connecting the sequence of higher lows.
-These converging lines encapsulate a contracting price structure, where volatility reduces over time, emphasizing indecision and consolidation among market participants.
-Symmetrical tr
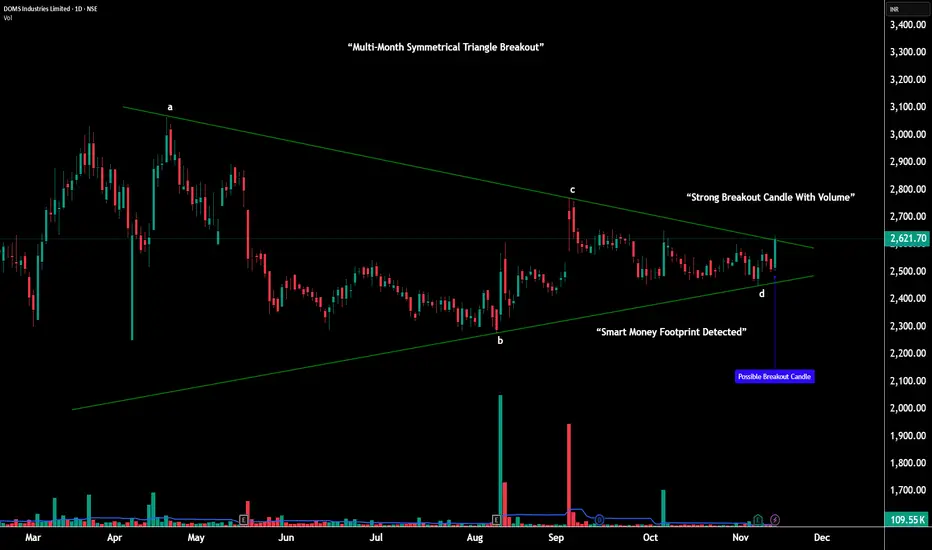
DOMS – Multi-Month Triangle Breakout |________________________________________
💹 DOMS Industries Ltd (NSE: DOMS)
Sector: Consumer & Stationery Products | CMP: 2621.70 |
View: Multi-Month Symmetrical Triangle Breakout With Expanding Momentum
________________________________________
📊 Price Action:
DOMS has spent the last five months forming a large symmetrical triangle — a volatility contraction structure marked by steady lower highs and higher lows from points A–B–C–D.
Throughout this period, buyers consistently defended the broader
Symmetrical Triangle Structure & Key EquilibriumEditorial Insights
- Symmetrical triangles signal a balanced tug-of-war between buyers and sellers; this compression, as mapped here, often precedes significant expansions in volume and volatility.
- The triangular structure’s edges—CT (red) and trendline (green)—have been tested repeatedly over months, reflecting both supply absorption and demand resilience.
- The hidden white line adds a subtle layer of convergence, useful for traders identifying areas of potential liquidity concentration.
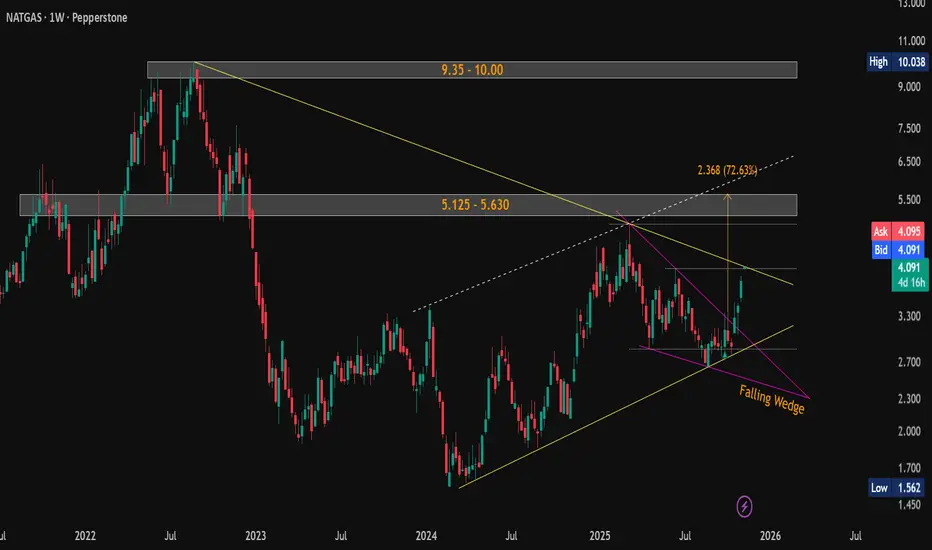
#NaturalGas ($NG) Weekly Update — Testing Critical Resistance!CMP: $4.092
💥 Up +38% from mentioned support ( $3.013–$2.956 ) and +46% from lows in a month . 🚀
The falling wedge breakout played out strongly, and price is now testing the critical resistance of the falling yellow trendline near the previous swing high $4.067 .
A weekly close above this trendline will confirm a major breakout , potentially triggering the next leg higher.
📊 Key Levels:
🛡 Supports: $4.067 / $3.013–$2.956 / $2.692–$2.643
🚧 Resistances / Targets: $5.125–$
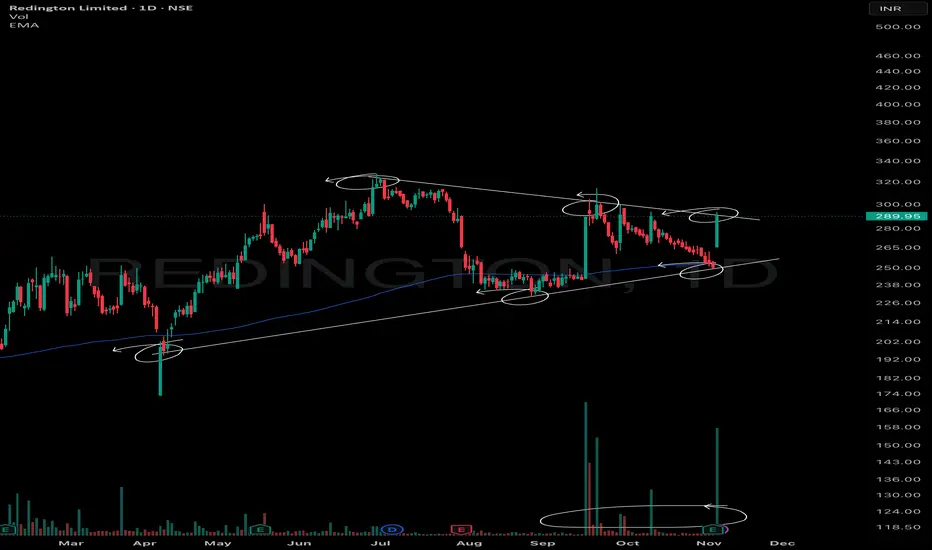
VCP Formation within Symmetrical Triangle above 200 EMAThis chart displays a Volatility Contraction Pattern (VCP) developing within a classic symmetrical triangle on the daily timeframe. Two sharply converging trendlines encapsulate the price action with the lower line connecting a series of higher lows (the trendline) and the upper line linking lower highs (counter trendline). Such convergence is characteristic of symmetrical triangles, which represent a period of price consolidation and equilibrium between buyers and sellers.
Volume tends to cont
Supply-Demand Squeeze: Symmetrical Triangle at the Flip zoneWitness a textbook supply-demand play on the monthly chart of Bharat Wire Ropes Ltd. as price contracts above a major zone conversion! The chart highlights a high-probability symmetrical triangle pattern—marked with a red counter trendline (lower highs) and a green trendline (higher lows).
This powerful squeeze forms right at the intersection of key supply and demand zones.
- Both supply (resistance) and demand (support) have been mapped for clear zone analysis.
- The symmetrical triangle show