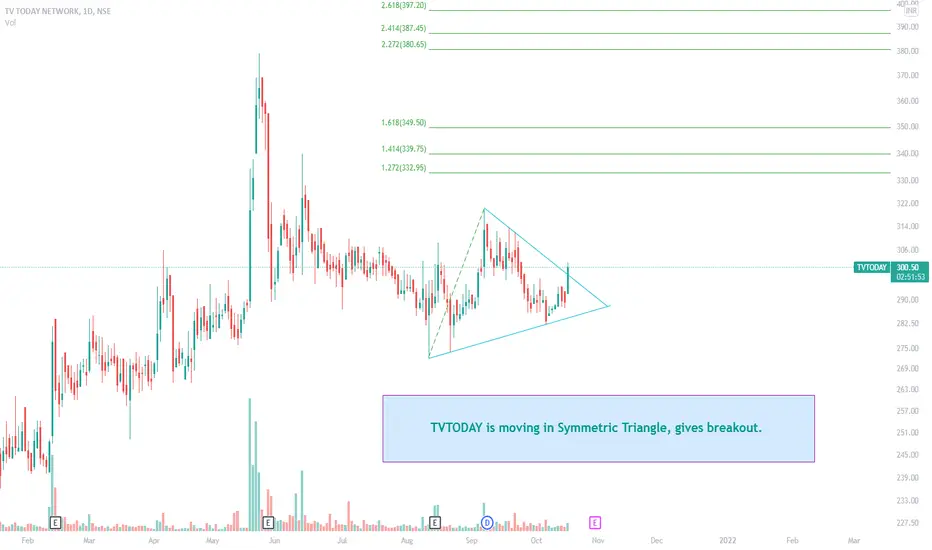
Symmetrical Triangle
Symmetrical Triangle in LRCUSDT* LRC in Daily time frame forms a Symmetrical triangle pattern.
* Symmetrical triangle occurs when the price consolidates between two parallel trendlines slightly sloping towards each other. The price is squeezed until it breaks the pattern.
* Symmetrical triangle is considered to be either trend continuation or trend reversal pattern depending on the pattern breakout.
* Above resistance LRC is bullish.
L
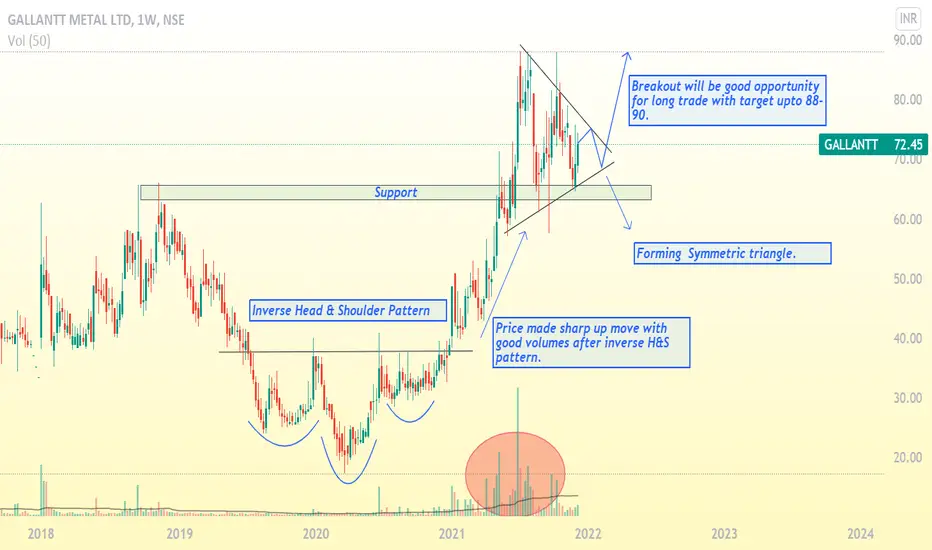
Symmetrical Triangle pattern Stock is in the midst of concluding a symmetrical triangle pattern. More often it is a continuation pattern. We expect positive breakout as the pattern has emerged during the long uptrend. RSI on daily and monthly chart provides scope of uptrend. So stock won't turn overbought on breakout
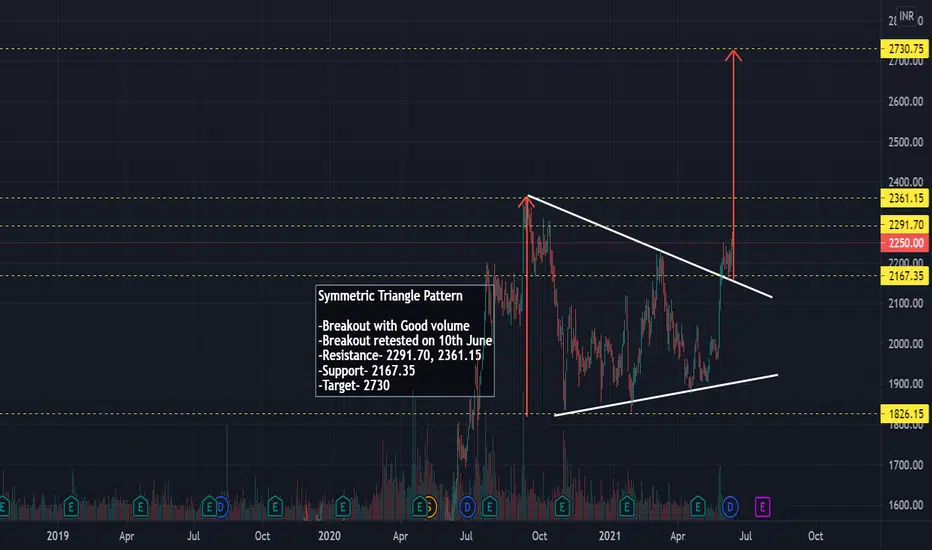
CDSL - All Time High Breakout1. Symmetric triangle formed.
2. Breakout of Symm triangle.
3. Retested the breakout
4. Price broke previous All time high with support of great volumes
**Great opportunity for swing trade with support of technicals validating at every stage.
** CDSL is monopoly until NSDL comes for IPO.
** Provided with the present Bull Run & IPO season the revenue will be all time high for CDSL..
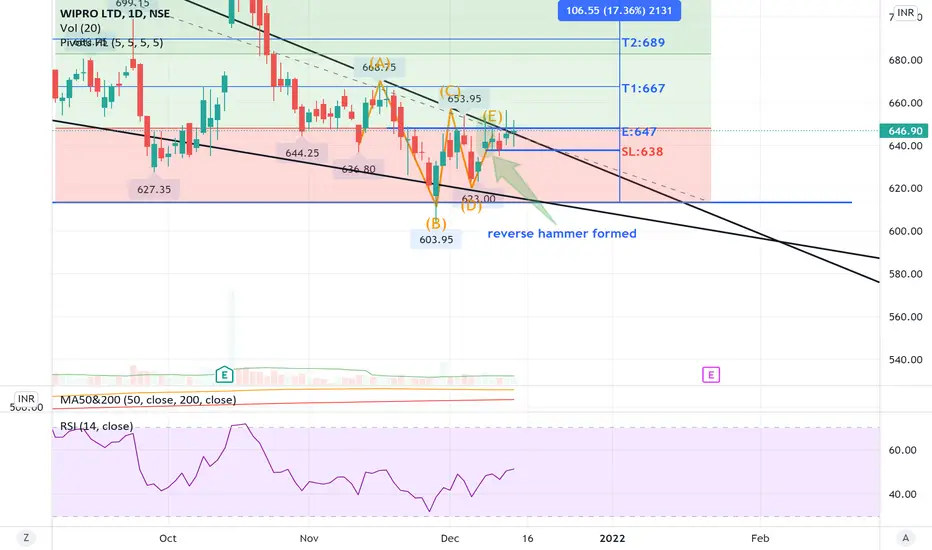
WIPRO - Ready for take off ?WIPRO today has closed on 646.90. entry was 647 which should be good as it has sustained a support above the triangle, would recommend to wait for one more candle for up move, if it closes above 647 tomorrow it should uptrend later.
looks like a doji candle creation to me hence its better to wait for one more candle before entering.
Symmetrical Triangle in the making Infy price movement is in the process of achieving symmetrical triangle pattern which is considered as the continuation pattern. Infy on a different time frame viz monthly chart is still overbought. Infy has been moving sideways. Thus, breakout of symmetrical triangle pattern may lead to continuation
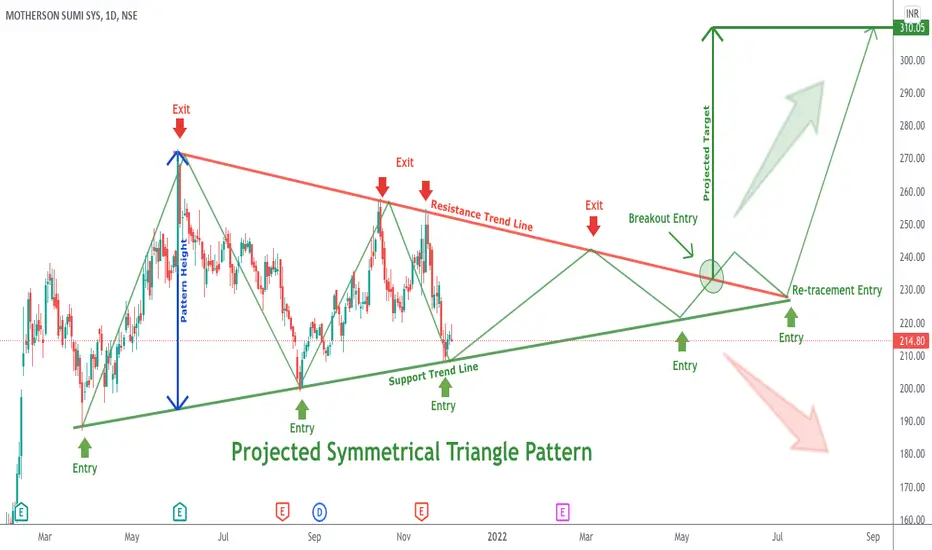
[Educational] Building Your Weekly Price Action WatchlistThis post helps you to understand how you can project any pattern formation in earlier stage. Also, It helps you to build your perfect weekly watchlist.
Create Your Price Action Weekly Watchlist in Following Sections:
1) Early Stage Price Action(Waiting Phase)
2) Mid-Stage Price Action(Reversal Entry Phase)
3) Final Price Action(Breakout/Breakdown Entry Phase)
Just spend few hours of your weekend and you don't required any screener to find perfect entry stock. You can build this watchlist acc
MEducation
RIIL under a Symmetrical TriangleAs seen in the chart, RIIL is trading under a Symmetrical Triangle in the weekly time frame. Any of the two -> break out above the upper trendline or break down below the lower trend line should be considered for further direction of the price. Do Note: Break out or Break down will be considered as close price of a weekly candle.
Disclaimer: This is for educational purpose only. This is not any recommendations. I am not SEBI registered. Please consult your financial advisor before taking any ac
BURGER KINGburger king is consolidating in a symmetrical triangle pattern, we can see a good breakout in this share in upcoming days for the target of 123, 250, 300.
we can imitate buying in this share at this place because of trendline support and range support. stop loss is 140 thanks
BLong
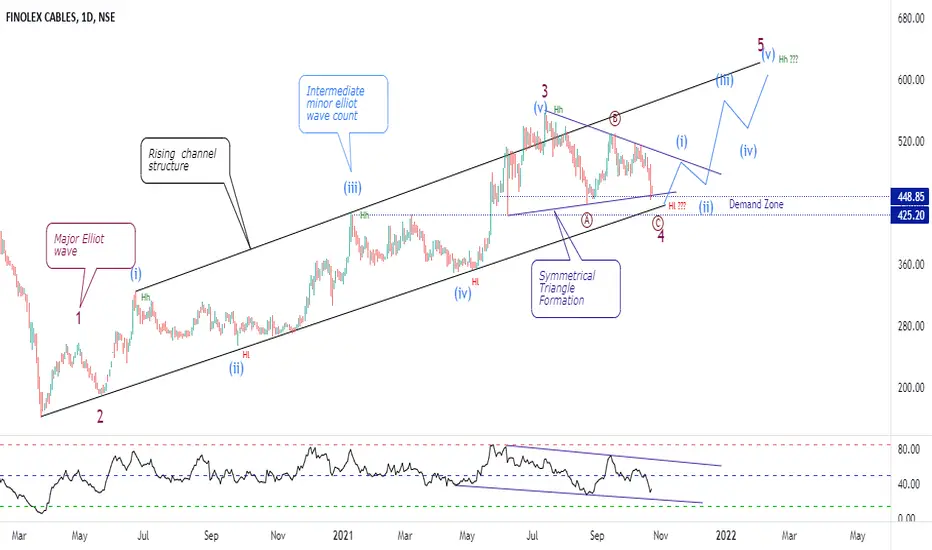
Finolex cables case studyFinolex Cable spot CMP : 455
Study :- Price action + chart patterns + Elliot wave
Time Frame :- Daily
There is Rising channel formation, currently price is around the demand line of long term structure, on smaller range of time frame there is formation of symmetrical triangle formation, which have demand line around current levels. so there are 2 structure formation as per chart patterns and both have demand levels around current levels. confluence of demand levels gives more confirmation of r